|
|
市場調査レポート
商品コード
1574315
AIT防止の世界市場:2024-2029年Global AIT Prevention Market: 2024-2029 |
||||||
|
|||||||
| AIT防止の世界市場:2024-2029年 |
|
出版日: 2024年10月22日
発行: Juniper Research Ltd
ページ情報: 英文
納期: 即日から翌営業日
|
全表示
- 概要
- 目次
| 主要統計 | |
|---|---|
| 2024年における企業のAITコスト総額: | 21億米ドル |
| 2029年における企業のAITコスト総額: | 9億2,900万米ドル |
| 2024年から2029年のAITトラフィックの減少率: | 53% |
| 予測期間: | 2024-2029年 |
当調査スイートは、今後5年間で大きく変化するAIT防止市場の詳細で洞察に満ちた分析を提供します。モバイルオペレーターやAIT防止ベンダーなどのステークホルダーは、AITとモバイルメッセージ詐欺の市場が今後5年間でどのように進化するか、またAIの影響や競合環境の進化を理解することができます。
本スイートには、AITのトラフィック、将来の減少に関するデータへのアクセス、防止市場における最新の動向と機会を明らかにする洞察に満ちた調査など、個別に購入できるいくつかのオプションが含まれています。さらに、AIT防止分野のリーダー18社に関する広範な分析を含む資料も含まれています。
主な特徴
- 市場力学:AIT防止市場の主要動向、市場課題による市場への影響、FaaS (Fraud-as-a-Service) がもたらす複雑性などを取り上げ、AITのホワイトリスト化、監視、ブロックなど、AIT防止におけるベンダーの介入を評価します。本調査には、主要60カ国におけるAIT防止市場の現在の展開と今後の成長に関する地域別の成長率分析も含まれています。
- 主な要点・戦略的提言:AIT防止市場における主な発展機会と調査結果の詳細な分析に加え、AIT防止ベンダー、規制当局、ネットワークオペレーターに対する主な戦略的提言も掲載しています。
- ベンチマーク業界予測:不正なA2P SMSのトラフィックと損失について、企業、モバイルオペレーター、モバイル加入者の損失別に5年間の予測データベースを提供します。
- Juniper Researchの競合リーダーボード:AIT対策ベンダー18社の能力とキャパシティを評価し、市場実績、収益、将来の事業見通しなどの基準でベンダーを採点します。
サンプルビュー
市場データ&予測レポート:
市場動向&戦略レポート:
市場データ&予測レポート
本調査スイートには、40の表と18,200以上のデータポイントからなる包括的な5年間の予測データセットへのアクセスが含まれています。この調査スイートには以下の指標が含まれています:
- 年間A2P SM総送信数
- 不正A2P SMS総数
- 不正SMSによる総損失額
これらの指標は、以下の主要市場について提供されています:
- モバイルオペレーターの損失
- 企業の損失
- モバイル加入者の損失
Juniper ResearchのInteractive Forecast Excelには以下の機能があります:
- 統計分析:データ期間中のすべての地域と国について表示される特定の指標を検索できるのがメリットです。グラフは簡単に変更でき、クリップボードにエクスポートできます。
- 国別データツール:このツールでは、予測期間中のすべての地域と国の指標を見ることができます。検索バーで表示される指標を絞り込むことができます。
- 国別比較ツール:特定の国を選択して比較することができます。このツールにはグラフをエクスポートする機能が含まれています。
- What-if分析:5つのインタラクティブなシナリオを通じて、ユーザーは予測の前提条件と比較することができます。
目次
市場動向・戦略
第1章 重要ポイント・戦略的推奨事項
第2章 将来の市場見通し
- AIT詐欺:イントロダクション
- 詐欺の影響
- AIT防止
- A2Pコストの上昇
- AITの複雑さ
- AIとAIT
- FaaS (Fraud-as-a-Service)
- SMSを介したその他の詐欺行為
第3章 エコシステム分析
- エコシステム分析:イントロダクション
- AIT削減ベンダー
- モバイルオペレーター
- メッセージングアグリゲーター
- CPaaSプロバイダー
- SMS詐欺
第4章 国別準備指数
- 国別準備指数:イントロダクション
- 重点市場
- 成長市場
- 飽和市場
- 新興国市場
競合リーダーボード
第1章 JuniperResearch:競合リーダーボード
第2章 ベンダープロファイル
- AIT不正防止ベンダープロファイル
- Arkose Labs
- BICS
- CM.com
- GMS (Global Message Services)
- Infobip
- LANCK Telecom
- LINK Mobility
- Mavenir Systems
- Mitto
- Monty Mobile
- Route Mobile
- Sinch
- Subex
- Syniverse
- Tata Communications
- Telesign
- Twilio
- VOX Solutions
- Juniper ResearchのLeaderboard:調査手法
- 制限と解釈
データ&予測
第1章 A2P SMS詐欺市場の概要
- A2P SMS詐欺市場の予測:イントロダクション
- 不正A2P SMS総数
- 不正SMSによる総損失額
第2章 オペレーターの損失:市場予測・重要ポイント
- オペレーターの損失
- 予測手法
- A2Pグレールートメッセージの年間総数
- グレールートトラフィックによるオペレーターの収益機会の損失
第3章 企業の損失:市場予測・重要ポイント
- 企業の損失
- 予測手法
- AITおよびSMSトラッシングによるA2P SMSトラフィック
- AITおよびSMSトラッシングの企業への総コスト
第4章 モバイル加入者の損失:市場予測・重要ポイント
- モバイル加入者の損失
- 予測手法
- モバイル加入者の損失につながる可能性のあるA2P SMSトラフィックの試みの合計
- モバイル加入者に損失をもたらしたA2P SMSトラフィックの合計
- 不正A2P SMSによるモバイル加入者の総損失額
第5章 SMSファイアウォールの支出:市場予測・重要ポイント
- SMSファイアウォール
- 予測手法
- SMSファイアウォールによって処理されたA2P SMSトラフィックの合計
- SMSファイアウォールに対する通信オペレーターの総支出
| KEY STATISTICS | |
|---|---|
| Total AIT cost to enterprises in 2024: | $2.1bn |
| Total AIT cost to enterprises in 2029: | $929m |
| 2024 to 2029 AIT traffic decline: | 53% |
| Forecast period: | 2024-2029 |
Overview
Our "AIT Prevention" research suite provides a detailed and insightful analysis of a market set for significant change over the next five years. It enables stakeholders from mobile operators and AIT prevention vendors to understand how the market for AIT and mobile messaging fraud will evolve over the next five years, as well as the impact of AI and the evolving competitive environment.
The AIT prevention market suite includes several different options that can be purchased separately, including access to data mapping of the traffic and future decline of AIT, and an insightful study uncovering the latest trends and opportunities within the prevention market. Additionally, it includes a document containing an extensive analysis of the 18 market leaders in the AIT prevention space. The coverage can also be purchased as a full research suite, which contains all these elements and includes a substantial discount.
Collectively, they provide a critical tool for understanding this rapidly emerging market; allowing AIT prevention vendors and operators to identify key approaches to shape their future strategy. This research suite's unparalleled coverage makes it an incredibly useful resource for projecting the future of such an uncertain and fast-moving market.
Key Features
- Market Dynamics: Insights into key trends and market impacts resulting from challenges within the AIT prevention market. This research addresses challenges posed by fraudulent players utilising AI within AIT fraud and the complexities presented with FaaS (Fraud-as-a-Service). This research then assesses vendor intervention in AIT prevention, such as whitelisting, monitoring and blocking AIT. This AIT prevention research also includes a regional market growth rate analysis on the current development and future growth of AIT prevention across 60 key countries.
- Key Takeaways & Strategic Recommendations: In-depth analysis of key development opportunities and findings within the AIT prevention market, accompanied by key strategic recommendations for AIT prevention vendors, regulators and network operators.
- Benchmark Industry Forecasts: Five-year forecast databases are provided for fraudulent A2P SMS traffic and losses, split by enterprise, mobile operator and mobile subscriber losses.
- Juniper Research Competitor Leaderboard: Key player capability and capacity assessment for 18 AIT prevention vendors via the Juniper Research Competitor Leaderboard; scoring these vendors on criteria such as market performance, revenue and future business prospects.
SAMPLE VIEW
Market Data & Forecasting Report:

The numbers tell you what's happening, but our written report details why, alongside the methodologies.
Market Trends & Strategies Report:

A comprehensive analysis of the current market landscape, alongside strategic recommendations.
Market Data & Forecasting Report
The market-leading research suite for the Mobile Messaging market includes access to a comprehensive five-year forecast dataset comprising 40 tables and over 18,200 datapoints. Metrics in the research suite include:
- Total A2P SMS Sent per Annum
- Total Fraudulent A2P SMS
- Total Losses to Fraudulent SMS
These metrics are provided for the following key market verticals:
- Mobile Operator Losses
- Enterprise Losses
- Mobile Subscriber Losses
Juniper Research Interactive Forecast Excel contains the following functionality:
- Statistics Analysis: Users benefit from the ability to search for specific metrics, displayed for all regions and countries across the data period. Graphs are easily modified and can be exported to the clipboard.
- Country Data Tool:This tool lets users look at metrics for all regions and countries in the forecast period. Users can refine the metrics displayed via a search bar.
- Country Comparison Tool: Users can select and compare specific countries. The ability to export graphs is included in this tool.
- What-if Analysis: Here, users can compare forecast metrics against their own assumptions via 5 interactive scenarios.
Market Trends & Strategies Report
This trends analysis report examines the "AIT Prevention" market landscape in detail; assessing market trends and factors shaping the evolution of this rapidly changing fraudulent activity. The essential strategy report delivers a comprehensive analysis of the strategic opportunities for AIT prevention providers; addressing key verticals and developing challenges, and how stakeholders must navigate these. It also includes evaluation of key country-level opportunities for AIT prevention growth.
Competitor Leaderboard Report
The Competitor Leaderboard report provides a detailed evaluation and market positioning for 18 leading vendors in the AIT prevention space. The vendors are positioned as established leaders, leading challengers, or disruptors and challengers based on capacity and capability assessments:
|
|
This competitive analysis document is centred around the Juniper Research Competitor Leaderboard, a vendor positioning tool that provides an at-a-glance view of the competitive landscape in a market; backed by a robust methodology.
Table of Contents
Market Trends & Strategies
1. Key Takeaways and Strategic Recommendations
- 1.1. Key Takeaways and Strategic Recommendations
2. Future Market Outlook
- 2.1. Introduction to AIT Fraud
- Figure 2.1: AIT Fraud Infographic
- Figure 2.2: Total Revenue Loss to AIT and SMS Trashing ($m), Split by 8 Key Regions, 2024, $2.1 billion
- Figure 2.3: Total AIT and SMS Trashing A2P SMS Traffic (m), Split by 8 Key Regions, 2024-2029
- 2.2. Impact of Fraud
- i. Enterprises
- Figure 2.4: Total AIT and SMS Trashing A2P SMS Traffic (m), Split by 8 Key Regions, 2020-2023
- ii. Mobile Operators
- iii. Consumers
- i. Enterprises
- 2.3. AIT Prevention
- 2.4. Rising A2P Costs
- Figure 2.5: Average Cost per A2P SMS ($), Split by 8 Key Regions, 2024-2029
- 2.5. Complexities of AIT
- 2.6. AI and AIT
- 2.7. FaaS (Fraud-as-a-Service)
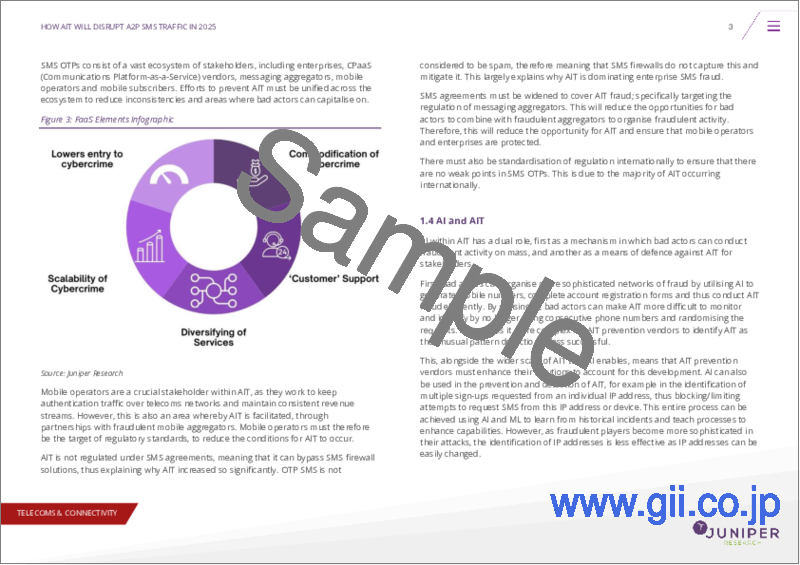
- Figure 2.6: FaaS Elements Infographic
- 2.8. Additional Forms of Fraud over SMS
- i. SMS Phishing
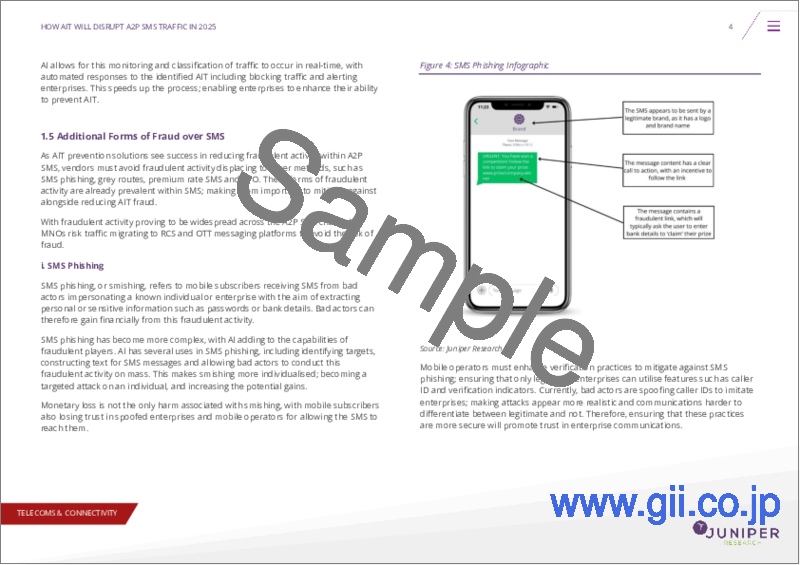
- Figure 2.7: SMS Phishing Infographic
- Figure 2.8: Total Mobile Subscriber Losses Attributable to Fraudulent A2P SMS ($m), Split by 8 Key Regions, 2024-2029
- ii. Grey Routes
- Figure 2.9: Lost Operator Revenue Opportunity due to Grey Route Traffic ($m), Split by 8 Key Regions, 2024-2029
- iii. Premium Rate SMS
- iv. ATO
- v. SMS Trashing
- i. SMS Phishing
3. Ecosystem Analysis
- 3.1. Introduction to Ecosystem Analysis
- 3.1.1. AIT Mitigation Vendors
- 3.1.2. Mobile Operators
- 3.1.3. Messaging Aggregators
- 3.1.4. CPaaS Providers
- 3.2. SMS Fraud
- Figure 3.1: SMS Fraud Ecosystem Infographic
4. Country Readiness Index
- 4.1. Introduction to Country Readiness Index
- Figure 4.1: AIT/SMS Fraud Country Readiness Index Regional Definitions
- Table 4.2: Juniper Research Country Readiness Index Scoring Criteria: AIT/SMS Fraud Prevention
- Figure 4.3: Juniper Research Country Readiness Index: AIT/SMS Fraud Prevention
- Table 4.4: AIT/SMS Fraud Prevention Country Readiness Index: Market Segments
- 4.2. Focus Markets
- Figure 4.5: Total Losses to A2P SMS Fraud ($m), Split by 8 Focus Markets, 2024
- i. High GDP
- Figure 4.6: Average Mobile Subscriber Loss per Successful Fraudulent A2P SMS ($), Split by Eight Focus Markets, 2024-2029
- ii. High Mobile Subscriber User Base
- Figure 4.7: Mobile Subscribers (m), Split by Eight Focus Markets, 2024-2029
- iii. Gaps in Regulation
- 4.3. Growth Markets
- i. Increasing Mobile Subscribers
- Figure 4.8: Total Mobile Subscribers (m), Split by Growth Markets, 2024-2029
- ii. Pakistan
- iii. Nigeria
- i. Increasing Mobile Subscribers
- 4.4. Saturated Markets
- i. West Europe
- Figure 4.9: Total A2P SMS Traffic (m), Split by Eight Saturated Markets, 2024-2029
- ii. Hong Kong, Israel, New Zealand and Qatar
- Figure 4.10: Total Mobile Subscribers (m), Split by Four Saturated Markets, 2024
- i. West Europe
- 4.5. Developing Markets
- Figure 4.11: Total Losses to A2P SMS Fraud ($m), Split by Developing Markets, 2024
- i. GDP per Capita
- ii. Mobile Subscribers
- Table 4.12: Juniper Research's Country Readiness Index Heatmap: North America
- Table 4.13: Juniper Research's Country Readiness Index Heatmap: Latin America
- Table 4.14: Juniper Research's Country Readiness Index Heatmap: West Europe
- Table 4.15: Juniper Research's Country Readiness Index Heatmap: Central & East Europe
- Table 4.16: Juniper Research's Country Readiness Index Heatmap: Far East & China
- Table 4.17: Juniper Research's Country Readiness Index Heatmap: Indian Subcontinent
- Table 4.18: Juniper Research's Country Readiness Index Heatmap: Rest of Asia Pacific
- Table 4.19: Juniper Research's Country Readiness Index Heatmap: Africa & Middle East
Competitor Leaderboard
1. Juniper Research Competitor Leaderboard
- 1.1. Why Read This Report
- Table 1.1: Juniper Research Competitor Leaderboard: Vendors & Product Portfolio
- Figure 1.2: Juniper Research Competitor Leaderboard: AIT Fraud Prevention
- Table 1.3: Juniper Research Competitor Leaderboard: Vendors
- Table 1.4: Juniper Research Competitor Leaderboard Heatmap: AIT Fraud Prevention Vendors
2. Vendor Profiles
- 2.1. AIT Fraud Prevention Vendor Profiles
- 2.1.1. Arkose Labs
- i. Corporate Information
- ii. Geographical Spread
- iii. Key Clients & Strategic Partnerships
- iv. High-level View of Offering
- v. Juniper Research's View: Key Strengths & Strategic Opportunities
- 2.1.2. BICS
- i. Corporate Information
- Table 2.1: BICS' Select Financial Information (Euro-m), 2022 & 2023
- ii. Geographical Spread
- iii. Key Clients & Strategic Partnerships
- iv. High-level View of Offering
- v. Juniper Research's View: Key Strengths & Strategic Opportunities
- i. Corporate Information
- 2.1.3. CM.com
- i. Corporate Information
- Table 2.2: Acquisitions Made by CM.com, 2021-present
- Table 2.3: CM.com's Select Financial Information (Euro-m), 2022-2023
- ii. Geographical Spread
- iii. Key Clients & Strategic Partnerships
- iv. High-level View of Offering
- v. Juniper Research's View: Key Strengths & Strategic Opportunities
- i. Corporate Information
- 2.1.4. GMS (Global Message Services)
- i. Corporate Information
- ii. Geographical Spread
- iii. Key Clients & Strategic Partnerships
- iv. High-level View of Offering
- v. Juniper Research's View: Key Strengths & Strategic Opportunities
- 2.1.5. Infobip
- i. Corporate Information
- Table 2.4: Infobip's Acquisitions - April 2021 to Present
- ii. Geographical Spread
- iii. Key Clients & Strategic Partnerships
- iv. High-level View of Offering
- Figure 2.5: Infobip's Signals Solution
- v. Juniper Research's View: Key Strengths & Strategic Opportunities
- i. Corporate Information
- 2.1.6. LANCK Telecom
- i. Corporate Information
- ii. Geographical Spread
- iii. Key Clients & Strategic Partnerships
- iv. High-level View of Offering
- v. Juniper Research's View: Key Strengths and Strategic Opportunities
- 2.1.7. LINK Mobility
- i. Corporate Information
- ii. Geographical Spread
- iii. Key Clients & Strategic Partnerships
- iv. High-level View of Offering
- v. Juniper Research's View: Key Strengths & Strategic Opportunities
- 2.1.8. Mavenir Systems
- i. Corporate Information
- ii. Geographical Spread
- iii. Key Clients & Strategic Partnerships
- iv. High-level View of Offering
- Figure 2.6: Mavenir's Fraud and Security Suite
- v. Juniper Research's View: Key Strengths & Strategic Opportunities
- 2.1.9. Mitto
- i. Corporate Information
- ii. Geographical Spread
- iii. Key Clients & Strategic Partnerships
- iv. High-level View of Offering
- v. Juniper Research's View: Key Strengths & Strategic Opportunities
- 2.1.10. Monty Mobile
- i. Corporate Information
- ii. Geographical Spread
- iii. Key Clients & Strategic Partnerships
- iv. High-level View of Offering
- v. Juniper Research's View: Key Strengths & Strategic Opportunities
- 2.1.11. Route Mobile
- i. Corporate Information
- Table 2.7: Route Mobile's Annual Financial Information (Indian Rupee Cr), 2021-2023
- ii. Geographical Spread
- iii. Key Clients & Strategic Partnerships
- iv. High-level View of Offering
- Figure 2.8: Route Mobile's Route Shield Solution
- v. Juniper Research's View: Key Strengths & Strategic Opportunities
- i. Corporate Information
- 2.1.12. Sinch
- i. Corporate Information
- Table 2.9: Sinch's Recent Acquisitions, 2020-2021
- Table 2.10: Sinch's Select Financial Information ($m), 2021-2023
- ii. Geographical Spread
- iii. Key Clients & Strategic Partnerships
- iv. High-level View of Offering
- v. Juniper Research's View: Key Strengths & Strategic Opportunities
- i. Corporate Information
- 2.1.13. Subex
- i. Corporate Information
- Table 2.119: Subex's Financial Information ($m), 2022 and 2023
- ii. Geographical Spread
- iii. Key Clients & Strategic Partnerships
- iv. High-level View of Offering
- v. Juniper Research's View: Key Strengths & Strategic Opportunities
- i. Corporate Information
- 2.1.14. Syniverse
- i. Corporate Information
- ii. Geographical Spread
- iii. Key Clients & Strategic Partnerships
- iv. High-level View of Offering
- v. Juniper Research's View: Key Strengths & Strategic Opportunities
- 2.1.15. Tata Communications
- i. Corporate Information
- ii. Geographical Spread
- iii. Key Clients & Strategic Partnerships
- iv. High-level View of Offering
- v. Juniper Research's View: Key Strengths & Strategic Opportunities
- 2.1.16. Telesign
- i. Corporate Information
- ii. Geographical Spread
- iii. Key Clients & Strategic Partnerships
- iv. High-level View of Offering
- v. Juniper Research's View: Key Strengths & Strategic Opportunities
- 2.1.17. Twilio
- i. Corporate Information
- Table 2.1210: Twilio's Acquisitions, November 2019-present
- Table 2.1311: Twilio's Revenue ($m), 2021-2023
- ii. Geographical Spread
- iii. Key Clients & Strategic Partnerships
- iv. High-level View of Offering
- Figure 2.1412: Twilio's Verify SMS Fraud Insights Dashboard
- v. Juniper Research's View: Key Strengths & Strategic Opportunities
- i. Corporate Information
- 2.1.18. VOX Solutions
- i. Corporate Information
- ii. Geographical Spread
- iii. Key Clients & Strategic Partnerships
- iv. High-level View of Offering
- v. Juniper Research's View: Key Strengths & Strategic Opportunities
- 2.1.1. Arkose Labs
- 2.2. Juniper Research Leaderboard Methodology
- 2.3. Limitations & Interpretations
- Table 2.1513: Juniper Research Competitor Leaderboard Scoring Criteria: AIT Prevention Vendors
Data & Forecasting
1. A2P SMS Fraud Market Summary
- 1.1. Introduction to A2P SMS Fraud Market Forecasts
- Figure 1.1: Total Mobile Subscribers (m), Split by 8 Key Regions, 2024-2029
- 1.2. Total Fraudulent A2P SMS
- Figure & Table 1.2: Total Fraudulent A2P SMS (m), Split by 8 Key Regions, 2024-2029
- Table 1.3: Total Fraudulent A2P SMS (m), Split by Operator, Enterprise and Mobile Subscriber, 2024-2029
- 1.3. Total Losses to Fraudulent A2P SMS
- Figure & Table 1.4: Total Losses to Fraudulent A2P SMS ($m), Split by 8 Key Regions, 2024-2029
- Table 1.5: Total Losses to Fraudulent A2P SMS ($m), Split by Operator, Mobile Subscriber and Enterprise Losses, 2024-2029
2. Operator Losses: Market Forecasts & Key Takeaways
- 2.1. Operator Losses
- 2.1.1. Operator Losses Forecast Methodology
- i. Request for Information
- Figure 2.1: Operator Losses Forecast Methodology
- i. Request for Information
- 2.1.2. Total Number of A2P Grey Route Messages per Annum
- Figure & Table 2.2: Total Number of A2P Grey Route Messages per Annum (m), Split by 8 Key Regions, 2024-2029
- 2.1.3. Lost Operator Revenue Opportunity due to Grey Route Traffic
- Figure & Table 2.3: Lost Operator Revenue Opportunity due to Grey Route Traffic ($m), Split by 8 Key Regions, 2024-2029
- 2.1.1. Operator Losses Forecast Methodology
3. Enterprise Losses: Market Forecasts & Key Takeaways
- 3.1. Enterprise Losses
- 3.1.1. Forecast & Methodology
- Figure 3.1: Enterprise Losses Forecast Methodology
- 3.1.2. Total AIT and SMS Trashing A2P SMS Traffic
- Figure & Table 3.2: Total AIT and SMS Trashing A2P SMS Traffic (m), Split by 8 Key Regions, 2024-2029
- 3.1.3. Total Cost of AIT and SMS Trashing to Enterprises
- Figure & Table 3.3: Total Cost of AIT and SMS Trashing to Enterprises ($m), Split by 8 Key Regions, 2024-2029
- 3.1.1. Forecast & Methodology
4. Mobile Subscriber Losses: Market Forecasts & Key Takeaways
- 4.1. Mobile Subscriber Losses
- 4.1.1. Forecast & Methodology
- Figure 4.1: Mobile Subscriber Losses Forecast Methodology
- 4.1.2. Total A2P SMS Traffic Attributable to Mobile Subscriber Loss Attempts
- Figure & Table 4.2: Total A2P SMS Traffic Attributable to Mobile Subscriber Loss Attempts (m), Split by 8 Key Regions, 2024-2029
- 4.1.3. Total A2P SMS Traffic that Causes Mobile Subscriber Losses
- Figure & Table 4.3: Total A2P SMS Traffic that Causes Mobile Subscriber Losses (m), Split by 8 Key Regions, 2024-2029
- 4.1.4. Total Mobile Subscriber Losses Attributable to Fraudulent A2P SMS
- Figure & Table 4.4: Total Mobile Subscriber Losses Attributable to Fraudulent A2P SMS ($m), Split by 8 Key Regions, 2024-2029
- Table 4.5: Average Loss per Successful Fraudulent A2P SMS ($), Split by 8 Key Regions, 2024-2029
- 4.1.1. Forecast & Methodology
5. SMS Firewall Spend: Market Forecasts & Key Takeaways
- 5.1. SMS Firewalls
- 5.1.1. Forecast & Methodology
- Figure 5.1: SMS Firewalls Forecast Methodology
- 5.1.2. Total A2P SMS Traffic Handled by SMS Firewalls
- Figure & Table 5.2: Total A2P SMS Traffic Handled by SMS Firewalls (m), Split by 8 Key Regions, 2024-2029
- 5.1.3. Total Operator Spend on SMS Firewalls
- Figure & Table 5.3: Total Operator Spend on SMS Firewalls ($m), Split by 8 Key Regions, 2024-2029
- 5.1.1. Forecast & Methodology
