|
|
市場調査レポート
商品コード
1548967
KYC/KYBシステムの世界市場:2024-2029年Global KYC/KYB Systems Market: 2024-2029 |
||||||
|
|||||||
|
|||||||

| KYC/KYBシステムの世界市場:2024-2029年 |
|
出版日: 2024年09月04日
発行: Juniper Research Ltd
ページ情報: 英文
納期: 即日から翌営業日
|

全表示
- 概要
- 目次
| 主要統計 | |
|---|---|
| 2024年の総支出額 | 308億米ドル |
| 2029年の支出総額 | 529億米ドル |
| 2024年から2029年の市場成長率 | 71% |
| 予測期間 | 2024-2029年 |
当調査パッケージは、金融機関、eコマースプラットフォーム、規制機関、技術ベンダーなどのステークホルダーが、今後の成長、主要動向、競合環境を理解できるよう、進化する市場を詳細かつ洞察的に分析します。
当スイートには、KYC/KYBシステム市場の採用と将来の成長をマッピングしたデータへのアクセス、市場の最新動向と機会、ID詐欺とマネーロンダリングとの闘いにおける市場リーダー19社の広範な分析が含まれます。
主な特徴
- 市場力学:KYC/KYBシステムの現在の開発とセグメント成長に関する地域別の成長分析、KYC/KYBシステム領域を形成する世界の規制枠組みの評価、KYC/KYBシステム市場の主要動向、市場拡大の課題、将来の展望と洞察、オンライン取引や金融犯罪の増加によってもたらされる課題と、規制当局の関与の強化による潜在的なメリット、次世代技術を通じて顧客や企業をデジタルに取り込むために使用される多くの本人確認アプローチの評価などについて取り上げています。
- 主な要点と戦略的提言:KYC/KYBシステム市場の主な成長機会と調査結果を詳細に分析し、金融機関、規制機関、eコマース・プラットフォームなどのステークホルダーに対する主な戦略的提言も掲載しています。
- ベンチマーク業界予測:概要には、KYC/KYBシステムの総収益予測が含まれており、消費者向けと企業向けのユースケースに分かれています。また、KYC/KYBシステムに対する世界の支出額も、金融5業種と非金融5業種に分けて掲載しています。
- Juniper Researchの競合リーダーボード:KYC/KYBシステムベンダー19社の能力を、Juniper Researchの競合リーダーボードで評価しています。
サンプル
市場データと予測レポート:
現在の市場情勢を包括的に分析し、戦略的な提言と予測結果を解説します。
市場動向と戦略レポート:
現在の市場情勢を包括的に分析し、戦略的提言を行います。
市場データ&予測レポート
当調査スイートには、74の表と26,720を超えるデータポイントの予測データ一式へのアクセスが含まれています。この調査スイートには以下の指標が含まれています:
- サードパーティのKYC/KYBシステムを利用している企業の総数
- KYC/KYBシステムに対する総支出額 (金融業界とその他の業界における区分)
Juniper Research Interactive Forecast Excelには、以下の機能があります:
- 統計分析:データ期間中のすべての地域と国について表示され、特定の指標を検索することができます。グラフは簡単に変更でき、クリップボードへのエクスポートも可能です。
- 国別データツール:このツールでは、予測期間中のすべての地域と国の指標を見ることができます。検索バーで表示される指標を絞り込むことができます。
- 国別比較ツール:ユーザーは国を選択し、特定の国についてそれぞれを比較することができます。グラフのエクスポートも可能です。
- What-if分析:5つのインタラクティブなシナリオにより、ユーザーは予測の前提条件と比較することができます。
市場動向と戦略レポート
当レポートでは、KYC/KYBシステム市場の情勢を詳細に調査し、急速に成長する市場の動向と進化を形成する要因を評価しています。オンライン金融犯罪や不正行為の増加、主要地域におけるKYC/KYB法の整備と改正、顧客や企業のデジタル対応に使用される多くの次世代技術アプローチなどがもたらす課題に対応し、KYC/KYBシステムプロバイダーにとっての戦略的機会を包括的に分析しています。
競合リーダーボードレポート
競合リーダーボードレポートでは、KYC/KYBシステム分野の主要ベンダー19社について、詳細な評価と市場でのポジショニングを掲載しています。
目次
市場動向と戦略
第1章 重要ポイントと戦略的推奨事項
- 重要ポイント
- 戦略的推奨事項
第2章 市場情勢
- イントロダクション
- 主な動向と促進要因
- 今後の展望
- 本人確認とKYC/KYBシステム
- データベース検証
- 一般的な生体認証
- 指紋
- 顔
- 音声
- 生体検知
- ディープフェイク検出
- 行動バイオメトリクス
- 新たな生体認証
- 虹彩
- 網膜
- 手形
- 静脈パターン認識
- 一般的な生体認証
競合のリーダーボード
第1章 KYC/KYBシステム:競合リーダーボード
- このレポートを読む理由
- ベンダープロファイル
- AU10TIX
- Data Zoo
- Encompass Corporation
- Entrust
- Experian
- Fenergo
- Jumio
- Know Your Customer
- LexisNexis Risk Solutions
- Minerva
- Moody's
- Persona
- Sardine
- Shufti Pro
- Socure
- Sumsub
- Veriff
第2章 未来のリーダーインデックス:KYC/KYBシステム
- 未来のリーダーベンダープロファイル
- Baselayer
- Dotfile
- Gatenox
- Labrys
- Parcha
- Quadrata
- TransactionLink
- Vespia
- Juniper Research未来リーダー指数評価手法
- 制限と解釈
データと予測
第1章 世界のKYC/KYBシステムの予測
第2章 世界のKYC/KYBシステム市場
- 世界のKYC/KYBシステム市場
- サードパーティのKYC/KYBシステムを使用している企業数
- サードパーティKYC/KYBシステムの総支出
第3章 金融ビジネス:世界のKYC/KYBシステムの予測
- サードパーティのKYC/KYBシステムを使用している金融事業者の総数
- サードパーティKYC/KYBシステムへの総支出:金融事業者別
- サードパーティのKYC/KYBシステムを使用している銀行の総数
- 銀行業界におけるサードパーティのKYC/KYBシステムへの総支出
- サードパーティのKYC/KYBシステムを使用しているフィンテックの総数
- フィンテック業界におけるサードパーティKYC/KYBシステムへの総支出
- サードパーティのKYC/KYBシステムを使用している保険会社の総数
- 保険業界におけるサードパーティAMLシステムへの総支出
- サードパーティKYC/KYBシステムを利用する投資会社の総数
- 投資業界におけるサードパーティKYC/KYBシステムへの総支出
- サードパーティのAMLシステムを使用している貸付会社の総数
- 融資業界におけるサードパーティKYC/KYBシステムへの総支出
第4章 専門企業およびその他の企業:世界のKYC/KYBシステムの予測
- サードパーティのKYC/KYBシステムを使用している専門企業およびその他の企業の合計数
- サードパーティKYC/KYBシステムへの総支出:専門企業とその他の企業別
- サードパーティのKYC/KYBシステムを使用しているゲームおよびギャンブル事業者の総数
- ゲームおよびギャンブル業界におけるサードパーティのKYC/KYBシステムへの総支出
- サードパーティのKYC/KYBシステムを使用しているEコマース企業の総数
- Eコマース業界におけるサードパーティのKYC/KYBシステムへの総支出
- サードパーティのKYC/KYBシステムを使用している通信事業者の総数
- 通信業界におけるサードパーティのKYC/KYBシステムへの総支出
- サードパーティのKYC/KYBシステムを使用しているヘルスケア事業者の総数
- ヘルスケア業界におけるサードパーティのKYC/KYBシステムへの総支出
- サードパーティKYC/KYBシステムを導入している不動産事業者の総数
- 不動産業界におけるサードパーティKYC/KYBシステムへの総支出
| KEY STATISTICS | |
|---|---|
| Total spend in 2024: | $30.8bn |
| Total spend in 2029: | $52.9bn |
| 2024 to 2029 market growth: | 71% |
| Forecast period: | 2024-2029 |
'KYC/KYB Systems ~ LexisNexis Risk Solutions and Experian Revealed as Market Leaders'
Overview
Our "KYC/KYB Systems" research suite provides a detailed and insightful analysis of an evolving market; enabling stakeholders such as financial institutions, eCommerce platforms, regulatory agencies and technology vendors to understand future growth, key trends and the competitive environment.
The suite includes several different options that can be purchased separately, including access to data that maps adoption and future growth of the KYC/KYB systems market. The research in this insightful study uncovers the latest trends and opportunities within the market, and provides extensive analysis of the 19 market leaders in the fight against identity fraud and money laundering. The coverage can also be purchased as a Full Research Suite, containing all of these elements, at a substantial discount.
Collectively, these documents provide a critical tool for understanding the rapidly evolving KYC/KYB systems market; allowing banks and technology vendors to shape their future strategy. Its unparalleled coverage makes this research suite an incredibly useful resource for charting the future of such an uncertain and rapidly growing market.
Key Features
- Market Dynamics: The banking market share research also includes a regional market growth analysis on the current development and segment growth of KYC/KYB systems; an assessment of the global regulatory frameworks that have shaped the KYC/KYB systems realm. Also provided are a future outlook of, and insights into, key trends and market expansion challenges within the KYC/KYB systems market. The research addresses challenges posed by the increase of online transactions and financial crime and the potential benefits of increasing regulatory involvement, and an assessment of the many identity verification approaches used to digitally onboard customers and businesses through next-generation technology.
- Key Takeaways & Strategic Recommendations: In-depth analysis of key development opportunities and key findings within the KYC/KYB systems market, accompanied by key strategic recommendations for stakeholders including financial institutions, regulatory bodies, eCommerce platforms and more.
- Benchmark Industry Forecasts: The overview includes forecasts for total revenue for KYC/KYB systems, split by consumer vs business use cases. Also included is the global spend on KYC/KYB systems; split across five financial and five non-financial industry segments.
- Juniper Research Competitor Leaderboard: Key player capability and capacity assessment for 19 KYC/KYB Systems vendors, via the Juniper Research Competitor Leaderboard.
- Juniper Research Future Leaders Index: Key player capability and capacity assessment for eight KYC/KYB Systems vendors, via the Juniper Research Future Leaders Index; including:
- Baselayer
- Dotfile
- Gatenox
- Labrys
- Parcha
- Quadrata
- TransactionLink
- Vespia
SAMPLE VIEW
Market Data & Forecasting Report:
A comprehensive analysis of the current market landscape, alongside strategic recommendations and a walk-through of the forecasts.
Market Trends & Strategies Report:
A comprehensive analysis of the current market landscape, alongside strategic recommendations.
Market Data & Forecasting Report
This market-leading research suite for the "KYC/KYB Systems" market includes access to the full set of forecast data of 74 tables and over 26,720 datapoints. Metrics in the research suite include:
- Total Number of Companies Using Third-party KYC/KYB Systems
- Total Spend on KYC/KYB Systems (split across the financial sector and other industries)
These metrics are provided for the following key market verticals:
- Financial Industries
- Banking
- Fintech
- Insurance
- Investment
- Lending
- Non-financial Industries
- Gaming & Gambling
- eCommerce
- Telco
- Healthcare
- Real Estate
Juniper Research Interactive Forecast Excel contains the following functionality:
- Statistics Analysis: Users benefit from the ability to search for specific metrics; displayed for all regions and countries across the data period. Graphs are easily modified and can be exported to the clipboard.
- Country Data Tool: This tool lets users look at metrics for all regions and countries in the forecast period. Users can refine the metrics displayed via a search bar.
- Country Comparison Tool: Users can select countries and compare each of them for specific countries. The ability to export graphs is included in this tool.
- What-if Analysis: Here, users can compare forecast metrics against their own assumptions, via five interactive scenarios
Market Trends & Strategies Report
This report examines the "KYC/KYB Systems" market landscape in detail; assessing market trends and factors shaping the evolution of the rapidly growing market. The report delivers comprehensive analysis of the strategic opportunities for KYC/KYB systems providers; addressing challenges posed by the increase in online financial crime and illicit activities, the development and revision of KYC/KYB laws across key regions, and the many next generation technological approaches used to digitally onboard customers and businesses.
Competitor Leaderboard Report
The Competitor Leaderboard report provides a detailed evaluation and market positioning for 19 leading vendors in the "KYC/KYB Systems" space. These vendors are positioned as established leaders, leading challengers or disruptors and challengers, based on capacity and capability assessments:
|
|
This document is centred around the Juniper Research Competitor Leaderboard; a vendor positioning tool that provides an at-a-glance view of the competitive landscape in a market, backed by a robust methodology.
Table of Contents
Market Trends & Strategies
1. Key Takeaways & Strategic Recommendations
- 1.1. Key Takeaways
- 1.2. Strategic Recommendations
2. Market Landscape
- 2.1. Introduction
- 2.1.1. The History of Regulatory Frameworks
- Figure 2.1: Basel III Framework
- 2.1.2. The Current KYC Regulatory Landscape
- Figure 2.2: Factors Determining Customers' Potential Risk Level
- i. KYC (Know Your Customer)
- Figure 2.4: Verification Alternatives to KYC
- iii. KYI (Know Your Investor)
- iv. KYP (Know Your Patient)
- v. KYD (Know Your Data)
- vi. Age Verification
- 2.1.3. Shifting and Emerging Regulatory Landscape
- i. EU - AI Act
- Figure 2.6: Fundamental Aims of the EU's AI Act
- ii. China - Deepfake Legislation
- Figure 2.7: China's Deepfake Legislation Requirements
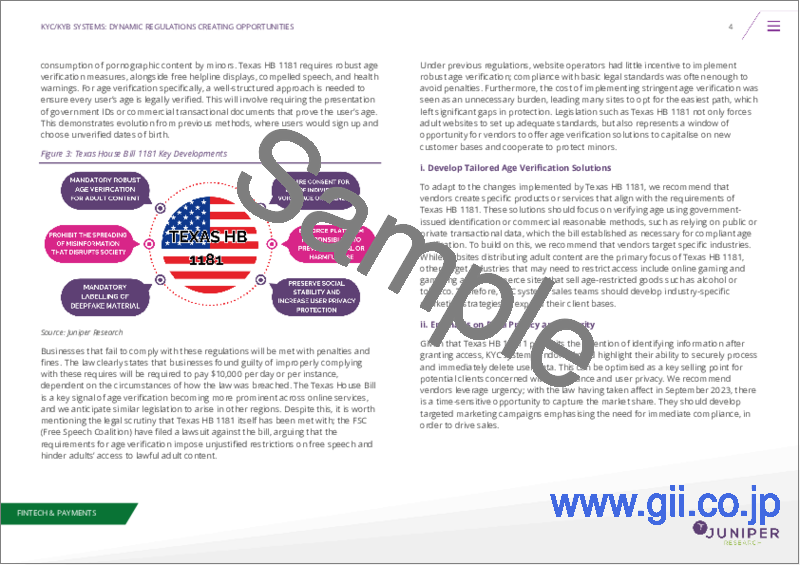
- iii. US - Texas HB (House Bill) 1181
- Figure 2.8: Texas House Bill 1181 Key Developments
- iv. India - Digital KYC
- v. UAE
- i. EU - AI Act
- 2.1.1. The History of Regulatory Frameworks
- 2.2. Key Trends and Driver
- 2.2.1. Combatting Financial Fraud and Corruption
- 2.2.2. Increase in Digital Nomads
- Figure 2.9: Scenarios that Utilise KYC Verification across Various Industries
- 2.2.3. Expansion of Remote Verification
- 2.2.4. Ongoing KYC Processes
- 2.3. Future Outlook
- 2.3.1. Increased Use of Advanced AI and Machine Learning
- 2.3.2. Greater Emphasis on Biometric Verification
- 2.3.3. Blockchain for Immutable Verification Records
- 2.3.4. Adoption of SSI (Self-sovereign Identity) Models
- Digital Onboarding: Verification Technologies
- 3.1. Identification Verification & KYC/KYB Systems
- 3.1.1. Document Verification
- i. Document Scanning
- ii. MRZ (Machine-readable Zones)
- iii. Embedded Chips
- 3.1.2. Document Reading
- 3.1.3. Using Documents for Verification
- i. Photo IDs
- ii. Age Verification
- iii. Linked Biometrics
- 3.1.1. Document Verification
- 3.2. Database Verification
- 3.2.1. Common Biometrics
- i. Fingerprint
- ii. Facial
- iii. Voice
- iv. Liveness Detection
- v. Deepfake Detection
- vi. Behavioural Biometrics
- 3.2.2. Emerging Biometrics
- i. Iris
- ii. Retina
- iii. Handprint
- iv. Vein Patter Recognition
- 3.2.1. Common Biometrics
Competitor Leaderboard
1. KYC/KYB Systems - Competitor Leaderboard
- 1.1.1. Why Read This Report
- KYC/KYB Systems Market Takeaways
- Table 1.1: Juniper Research Competitor Leaderboard KYC/KYB Systems Market Vendors & Product Portfolio
- Figure 1.2: Juniper Research Competitor Leaderboard KYC/KYB Systems Vendors
- Table 1.3: Juniper Research Competitor Leaderboard Vendors and Positioning
- Table 1.4: Juniper Research Competitor Leaderboard for KYC/KYB Systems Heatmap
- Table 1.4: Juniper Research Competitor Leaderboard for KYC/KYB Systems Heatmap (Continued)
- KYC/KYB Systems Market Takeaways
- 1.2. Vendor Profiles
- 1.2.1. AU10TIX
- i. Corporate
- Table 1.5: AU10TIX's Investment Rounds ($m), 2019-2024
- ii. Geographical Spread
- iii. Key Clients & Strategic Partnerships
- iv. High-level View of Offerings
- v. Juniper Research's View: Key Strengths & Strategic Development Opportunities
- i. Corporate
- 1.2.2. ComplyAdvantage
- 1.2.3. Data Zoo
- i. Corporate
- ii. Geographical Spread
- iii. Key Clients & Strategic Partnerships
- iv. High-level View of Offerings
- v. Juniper Research's View: Key Strengths & Strategic Development Opportunities
- 1.2.4. Encompass Corporation
- i. Corporate
- Table 1.7: Encompass' Investment Rounds ($m), 2016-2022
- ii. Geographical Spread
- iii. Key Clients & Strategic Partnerships
- iv. High-level View of Offerings
- v. Juniper Research's View: Key Strengths & Strategic Development Opportunities
- i. Corporate
- 1.2.5. Entrust
- i. Corporate
- ii. Geographical Spread
- iii. Key Clients & Strategic Partnerships
- iv. High-level View of Offerings
- v. Juniper Research's View: Key Strengths & Strategic Development Opportunities
- 1.2.6. Experian
- i. Corporate
- Table 1.8: Experian's Financial Snapshot ($m), 2021-2023
- ii. Geographical Spread
- iii. Key Clients & Strategic Partnerships
- iv. High-level View of Offerings
- v. Juniper Research's View: Key Strengths & Strategic Development Opportunities
- i. Corporate
- 1.2.7. Fenergo
- i. Corporate
- Table 1.9: Fenergo's Investment Rounds ($m), 2013-2021
- ii. Geographical Spread
- iii. Key Clients & Strategic Partnerships
- iv. High-level View of Offerings
- v. Juniper Research's View: Key Strengths & Strategic Development Opportunities
- i. Corporate
- 1.2.8. Jumio
- i. Corporate
- Table 1.10: Jumio's Investment Rounds ($m), 2010-2021
- ii. Geographical Spread
- iii. Key Clients & Strategic Partnerships
- iv. High-level View of Offerings
- v. Juniper Research's View: Key Strengths & Strategic Development Opportunities
- i. Corporate
- 1.2.9. Know Your Customer
- i. Corporate
- ii. Geographical Spread
- iii. Key Clients & Strategic Partnerships
- iv. High-level View of Offerings
- v. Juniper Research's View: Key Strengths & Strategic Development Opportunities
- 1.2.10. LexisNexis Risk Solutions
- i. Corporate
- ii. Geographical Spread
- iii. Key Clients & Strategic Partnerships
- iv. High-level View of Offerings
- v. Juniper Research's View: Key Strengths & Strategic Development Opportunities
- 1.2.11. Minerva
- i. Corporate
- ii. Geographical Spread
- iii. Key Clients & Strategic Partnerships
- iv. High-level View of Offerings
- v. Juniper Research's View: Key Strengths & Strategic Development Opportunities
- 1.2.12. Moody's
- i. Corporate
- Table 1.11: Moody's Financial Snapshot ($m), 2021-2023
- ii. Geographical Spread
- iii. Key Clients & Strategic Partnerships
- iv. High-level View of Offerings
- Figure 1.12: Moody's KYC ecosystem
- Figure 1.13: Moody's GRID PEP risk rating system
- v. Juniper Research's View: Key Strengths & Strategic Development Opportunities
- i. Corporate
- 1.2.13. Persona
- i. Corporate
- Table 1.14: Persona's Investment Rounds ($m), 2019-2021
- ii. Geographical Spread
- iii. Key Clients & Strategic Partnerships
- iv. High-level View of Offerings
- v. Juniper Research's View: Key Strengths & Strategic Development Opportunities
- i. Corporate
- 1.2.14. Sardine
- i. Corporate
- Table 1.15: Sardine's Investment Rounds ($m), 2021-2024
- ii. Geographical Spread
- iii. Key Clients & Strategic Partnerships
- iv. High-level View of Offerings
- v. Juniper Research's View: Key Strengths & Strategic Development Opportunities
- i. Corporate
- 1.2.15. Shufti Pro
- i. Corporate
- ii. Geographical Spread
- iii. Key Clients & Strategic Partnerships
- iv. High-level View of Offerings
- v. Juniper Research's View: Key Strengths & Strategic Development Opportunities
- 1.2.16. Socure
- i. Corporate
- Table 1.16: Socure's Investment Rounds ($m), 2015-2023
- ii. Geographical Spread
- iii. Key Clients & Strategic Partnerships
- iv. High-level View of Offerings
- v. Juniper Research's View: Key Strengths & Strategic Development Opportunities
- i. Corporate
- 1.2.17. Sumsub
- i. Corporate
- Table 1.17: Sumsub's Investment Rounds ($m), 2017-2022
- ii. Geographical Spread
- iii. Key Clients & Strategic Partnerships
- iv. High-level View of Offerings
- v. Juniper Research's View: Key Strengths & Strategic Development Opportunities
- i. Corporate
- 1.2.18. Trulioo
- i. Corporate
- v. Juniper Research's View: Key Strengths & Strategic Development Opportunities
- 1.2.19. Veriff
- i. Corporate
- Table 1.18: Veriff's Funding Rounds ($m), 2018-2022
- ii. Geographic Spread
- iii. Key Clients & Strategic Partnerships
- iv. High-level View of Offering
- v. Juniper Research's View: Key Strengths & Strategic Development Opportunities
- Table 1.19: Juniper Research Competitor Leaderboard Scoring Criteria: KYC/KYB Systems
- i. Corporate
- 1.2.1. AU10TIX
2. Future Leaders Index: KYC/KYB Systems
- Table 2.1: Juniper Research Future Leaders Index - KYC/KYB Systems Vendors & Product Portfolio
- Figure 2.2: Juniper Research Future Leaders Index - KYC/KYB Systems
- Table 2.3: Juniper Research Future Leaders Vendors - KYC/KYB Systems
- Table 2.4: Juniper Research Future Leaders Index Heatmap: KYC/KYB Systems
- 2.1. Future Leaders Vendor Profiles
- 2.1.1. Baselayer
- i. Corporate
- ii. Geographical Spread
- iii. Key Clients & Strategic Partnerships
- iv. High-level View of Offerings
- v. Juniper Research's View: Key Strengths & Strategic Development Opportunities
- 2.1.2. Dotfile
- i. Corporate
- ii. Geographical Spread
- iii. Key Clients & Strategic Partnerships
- iv. High-level View of Offerings
- v. Juniper Research's View: Key Strengths & Strategic Development Opportunities
- 2.1.3. Gatenox
- i. Corporate
- ii. Geographical Spread
- iii. Key Clients & Strategic Partnerships
- iv. High-level View of Offerings
- v. Juniper Research's View: Key Strengths & Strategic Development Opportunities
- 2.1.4. Labrys
- i. Corporate
- ii. Geographical Spread
- iii. Key Clients & Strategic Partnerships
- iv. High-level View of Offerings
- v. Juniper Research's View: Key Strengths & Strategic Development Opportunities
- 2.1.5. Parcha
- i. Corporate
- ii. Geographical Spread
- iii. Key Clients & Strategic Partnerships
- iv. High-level View of Offerings
- v. Juniper Research's View: Key Strengths & Strategic Development Opportunities
- 2.1.6. Quadrata
- i. Corporate
- ii. Geographical Spread
- iii. Key Clients & Strategic Partnerships
- iv. High-level View of Offerings
- v. Juniper Research's View: Key Strengths & Strategic Development Opportunities
- 2.1.7. TransactionLink
- i. Corporate
- ii. Geographical Spread
- iii. Key Clients & Strategic Partnerships
- iv. High-level View of Offerings
- v. Juniper Research's View: Key Strengths & Strategic Development Opportunities
- 2.1.8. Vespia
- i. Corporate
- ii. Geographical Spread
- iii. Key Clients & Strategic Partnerships
- iv. High-level View of Offerings
- v. Juniper Research's View: Key Strengths & Strategic Development Opportunities
- 2.1.1. Baselayer
- 2.1. Juniper Research Future Leader Index Assessment Methodology
- 2.2. Limitations & Interpretations
- Table 2.5: Juniper Research Future Leader Index: KYC/KYB Systems
Data & Forecasting
1. Global KYC/KYB Systems Forecast
- 1.1.1. Introduction
- 1.1.2. Methodology
- Figure 1.1: KYC/KYB Systems Forecast Methodology for Financial Businesses (Banks, Fintechs, Insurance, Investment, Lending)
- Figure 1.2: KYC/KYB Systems Forecast Methodology for Professional and Other Businesses (Gambling & Gaming, eCommerce, Telco, Healthcare, and Real Estate)
2. Global KYC/KYB Systems Market
- 2.1. Global KYC/KYB Systems Market
- 2.1.1. Number of Businesses Using Third-party KYC/KYB Systems
- Figure & Table 2.1: Total Number of Businesses using Third-party KYC/KYB Systems, Split by 8 Key Regions, 2024-2029
- 2.1.2. Total Spend of Third-party KYC/KYB Systems
- Figure & Table 2.2: Total Spend on Third-party AML Systems per annum ($m), Split by 8 Key Regions, 2024-2029
- 2.1.1. Number of Businesses Using Third-party KYC/KYB Systems
3. Financial Businesses: Global KYC/KYB Systems Forecast
- 3.1.1. Total Number of Financial Businesses Using Third-party KYC/KYB Systems
- Figure & Table 3.1: Total Number of Financial Businesses Using Third-party KYC/KYB Systems, Split by 8 Key Regions, 2024 - 2029
- Table 3.2: Total Number of Financial Businesses Using Third-party KYC/KYB Systems per annum, Split by Industry 2024-2029
- 3.1.2. Total Spend on Third-party KYC/KYB Systems by Financial Businesses
- Figure & Table 3.3: Total Spend on Third-party AML Systems by Financial Businesses per annum ($m), Split by 8 Key Regions, 2024-2029
- Table 3.4: Total Spend on Third-party KYC/KYB Systems by Financial Businesses per annum ($m), Split by Industry, 2024-2029
- 3.1.3. Total Number of Banks Using Third-party KYC/KYB Systems
- Figure & Table 3.5: Total Number of Banks Using Third-party KYC/KYB Systems per annum, Split by 8 Key Regions, 2024-2029
- 3.1.4. Total Spend on Third-party KYC/KYB Systems in the Banking Industry
- Figure & Table 3.6: Total Spend on Third-party KYC/KYB Systems in the Banking Industry per annum ($m), Split by 8 Key Regions, 2024-2029
- 3.1.5. Total Number of Fintechs Using Third-party KYC/KYB Systems
- Figure & Table 3.7: Total Number of Fintechs Using Third-party KYC/KYB Systems per annum, Split by 8 Key Regions. 2024-2029
- 3.1.6. Total Spend on Third-party KYC/KYB Systems in the Fintech Industry
- Figure & Table 3.8: Total Spend on Third-party KYC/KYB Systems in the Fintech Industry per annum ($m), Split by 8 Key Regions, 2024-2029
- 3.1.7. Total Number of Insurance Companies Using Third-Party KYC/KYB Systems
- Figure & Table 3.9: Total Number of Insurance Companies Using Third-party KYC/KYB Systems per annum, Split by 8 Key Regions, 2024-2029
- 3.1.8. Total Spend on Third-party AML Systems in the Insurance Industry
- Figure & Table 3.10: Total Spend on Third-party KYC/KYB Systems in the Insurance Industry per annum ($m), Split by 8 Key Regions, 2024-2029
- 3.1.9. Total Number of Investment Companies Using Third-party KYC/KYB Systems
- Figure & Table 3.11: Total Number of Investment Companies Using Third-party KYC/KYB Systems per annum, Split by 8 Key Regions, 2024-2029
- 3.1.10. Total Spend on the Third-party KYC/KYB Systems in the Investment Industry
- Figure & Table 3.12: Total Spend on Third-party KYC/KYB Systems in the Investment Industry per annum ($m), Split by 8 Key Regions, 2024-2029
- 3.1.11. Total Number of Lending Companies Using Third-party AML Systems
- Figure & Table 3.13: Total Number of Lending Companies Using Third-party KYC/KYB Systems, Split by 8 Key Regions, 2024-2029
- 3.1.12. Total Spend on the Third-party KYC/KYB Systems in the Lending Industry
- Figure & Table 3.14: Total Spend on Third-party KYC/KYB Systems in the Lending Industry per annum ($m), Split by 8 Key Regions, 2024-2029
4. Professional and Other Businesses: Global KYC/KYB Systems Forecast
- 4.1.1. Total Number of Professional and Other Businesses Using Third-Party KYC/KYB Systems
- Figure & Table 4.1: Total Number of Professional and Other Businesses using Third-Party KYC/KYB Systems, Split by 8 Key Regions, 2024-2029
- Table 4.2: Total Number of Professional and Other Businesses Using Third-party KYC/KYB, Split by Industry, 2024-2029
- 4.1.2. The Total Spend on Third-party KYC/KYB System by Professional and Other Businesses
- Figure & Table 4.3: Total Spend on Third-party KYC/KYB System by Professional and Other Businesses ($m), Split by 8 Key Regions, 2024-2029
- Table 4.4: Total Spend on Third-party KYC/KYB System by Professional and Other Businesses ($m), Split by 8 Key Regions, 2024-2029
- 4.1.3. Total Number of Gaming & Gambling Businesses Using Third-party KYC/KYB Systems
- Figure & Table 4.5: Total Number of Gaming & Gambling Businesses Using Third-party KYC/KYB Systems (m), Split by 8 Key Regions, 2024-2029
- 4.1.4. Total Spend on Third-party KYC/KYB Systems in the Gaming & Gambling Industry
- Figure & Table 4.6: Total Spend on Third-party KYC/KYB Systems in the Gaming & Gambling industry ($m), Split by 8 Key Regions, 2024 - 2029
- 4.1.5. Total Number of eCommerce Businesses Using Third-party KYC/KYB Systems
- Figure & Table 4.7: Total number of eCommerce Businesses Using Third-party KYC/KYB Systems, Split by 8 Key Regions, 2024-2029
- 4.1.6. Total Spend on Third-party KYC/KYB Systems in the eCommerce Industry
- Figure & Table 4.8: Total Number of eCommerce Businesses Using Third-party KYC/KYB Systems in the eCommerce Industry ($m), Split by 8 Key Regions, 2024-2029
- 4.1.7. Total Number of Telco Businesses Using Third-party KYC/KYB Systems
- Figure & Table 4.9: Total Number of Telco Businesses using Third-party KYC/KYB Systems, Split by 8 Key Regions, 2024-2029
- 4.1.8. Total Spend on Third-party KYC/KYB Systems in the Telco Industry
- Figure & Table 4.10: Total Spend on Third-party KYC/KYB Systems in the Telco Industry ($m), Split by 8 Key Regions, 2024-2029
- 4.1.9. Total Number of Healthcare Businesses Using Third-party KYC/KYB Systems
- Figure & Table 4.11: Total number of Healthcare Businesses Using Third-party KYC/KYB Systems, Split by 8 Key Regions, 2024-2029
- 4.1.10. Total Spend on Third-party KYC/KYB Systems in the Healthcare Industry
- Figure & Table 4.12: Total Spend on Third-party KYC/KYB Systems in the Healthcare Industry ($m), Split by 8 Key Regions, 2024-2029
- 4.1.11. Total Number of Real Estate Businesses Using Third-party KYC/KYB Systems
- Figure & Table 4.13: Total Number of Real Estate Businesses Using Third-party KYC/KYB Systems, Split by 8 Key Regions, 2024-2029
- 4.1.12. Total Spend on Third-party KYC/KYB Systems in the Real Estate Industry
- Figure & Table 4.14: Total Spend on Third-party KYC/KYB Systems in the Real Estate Industry ($m), Split by 8 Key Regions, 2024 - 2029

