|
|
市場調査レポート
商品コード
1526419
ペイメントカード技術の世界市場:2024-2029年Global Payment Card Technologies Market: 2024-2029 |
||||||
|
|||||||
|
|||||||

| ペイメントカード技術の世界市場:2024-2029年 |
|
出版日: 2024年08月13日
発行: Juniper Research Ltd
ページ情報: 英文
納期: 即日から翌営業日
|

全表示
- 概要
- 目次
| 主要統計 | |
|---|---|
| 2024年のペイメントカード技術支出額: | 98億米ドル |
| 2029年のペイメントカード技術支出額: | 136億米ドル |
| 2024年から2029年の市場成長率 | 39% |
| 予測期間: | 2024-2029年 |
当レポートでは、世界のペイメントカードの市場を調査し、ペイメントカードの種類と概要、ペイメントカード市場の発展の推移、イノベーションの動向、ペイメントカードの普及率、出荷数、収益の予測、各種区分・地域/主要国別の詳細分析、Juniper Research競合リーダーボードによる競合情勢の分析などをまとめています。
主な特徴
- 市場力学:ベーシックな非接触カードの提供から、より高度なフィジカルカードの提供へのシフト、パーソナライゼーションの台頭、富裕層顧客を惹きつけるためのプレミアム機能の利用など、ペイメントカード技術業界の展開と発展を形成する主な促進要因、課題、イノベーションを戦略的に分析しています。
- 主な要点と戦略的提言:カード製造業者、カードネットワーク、銀行、クレジットカード会社、フィンテック、その他のカード発行会社などのステークホルダーに対する戦略的提言とともに、ペイメントカード技術市場における主な発展機会と知見を詳細に分析しています。
- ベンチマーク業界予測:流通するペイメントカードの総数、年間出荷額、利用額の予測をカードタイプ別に掲載しています。このデータは8つの主要地域と60カ国に分類されています。
サンプルビュー
市場データ・予測 (PDFレポート):
市場動向・戦略レポート:
Juniper Research Interactive Forecast Excelには以下の機能があります:
- 統計分析:データ期間中のすべての地域と国について表示されます。グラフは簡単に修正でき、クリップボードへのエクスポートも可能です。
- 国別データツール:このツールでは、予測期間中のすべての地域と国の指標を見ることができます。検索バーで表示される指標を絞り込むことができます。
- 国別比較ツール:特定の国を選択して比較することができます。このツールには、グラフをエクスポートする機能が含まれています。
- What-if分析:5つのインタラクティブシナリオを通じて、ユーザーは予測の前提条件と比較することができます。
目次
市場動向・戦略
第1章 重要ポイント・戦略的推奨事項
- 重要ポイント
- 戦略的推奨事項
第2章 市場情勢
- 市場の定義と組織
- 非接触ペイメントカード
- 生体認証ペイメントカード
- メタルカード
- 動的CSC/CVV
- LEDカード
- リサイクルカード
- ウッドカード
- 決済ウェアラブル
- ベンダーの種類
- ペイメントカードの歴史
- ペイメントカードのイノベーションを推進する主な動向
- デジタルの台頭
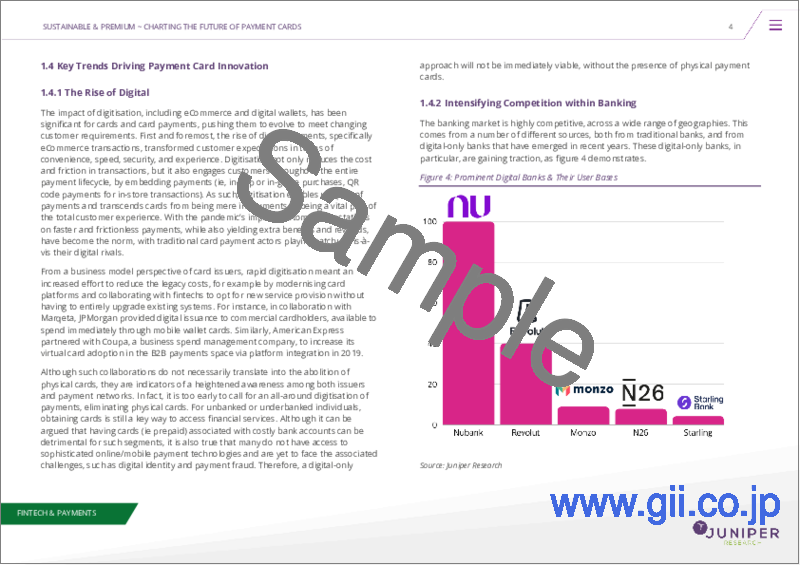
- 銀行業界における競合の激化
第3章 セグメント分析
- イントロダクション
- 非接触カード
- リサイクル/エコカード
- 生体認証カード
- メタルカード
- ダイナミックCVVカード
- LEDカード
- 決済ウェアラブル
- 使用事例と市場における位置づけ
- 技術の利点
- 採用の課題
- 今後の見通し
第4章 国別準備指数・分析
- 重点市場
- 成長市場
- 飽和市場
- 新興国市場
競合リーダーボード
第1章 Juniper Researchの競合リーダーボード
第2章 企業プロファイル
- ペイメントカード技術ベンダープロファイル
- allpay cards
- CompoSecure
- CPI Card Group
- dzcard
- Eastcompeace
- Fingerprints
- Giesecke+Devrient
- Goldpac
- IDEMIA
- KONA I
- Perfect Plastic
- Thales Group
- Toppan Gravity
- Valid
- Watchdata
- Juniper Researchのリーダーボード評価手法
データ・予測
第1章 イントロダクション・調査手法
第2章 予測の概要
- ペイメントカード技術の予測
- 総数
- 出荷数
- 収益
第3章 メタルカード
- メタルカードの予測
- 総数
- 出荷数
- 収益
第4章 生体認証カード
- 生体認証カードの予測
- 総数
- 出荷数
- 収益
第5章 ダイナミックCVVカード
- ダイナミックCVVペイメントカード予測
- 総数
- 出荷数
- 収益
第6章 LEDカード
- LEDペイメントカードの予測
- 総数
- 出荷数
- 収益
第7章 リサイクルカード
- 出荷数
'Payment Card Technology Spend to Reach $13.6 Billion Globally by 2029, as Banks Target Premium Users.'
| KEY STATISTICS | |
|---|---|
| Payment card technology spend in 2024: | $9.8bn |
| Payment card technology spend in 2029: | $13.6bn |
| 2024 to 2029 market growth: | 39% |
| Forecast period: | 2024-2029 |
Overview
Our "Payment Card Technologies" research report provides a detailed evaluation and analysis of the ways in which the payment card is changing; impacting the wider payments industry. This includes the way in which banks and other issues are adjusting their credit card, debit card and prepaid card ranges to use new card types to appeal to different demographics. This includes high net worth individuals with premium offerings, and environmentally minded individuals with sustainably made cards. The suite considers how methods such as contactless technology and metal cards are providing a better customer experience at both payment terminals and for online transactions. The research also considers future trends and challenges within the card technology market, such as the need for greater personalisation, competition from other payment types, and intensifying competition for banks.
In addition, the report contains a Juniper Research Competitor Leaderboard; giving readers a comprehensive understanding of the competitive dynamics in this space. The Competitor Leaderboard positions 15 payment card manufacturers; delivering an invaluable resource for stakeholders seeking to understand the competitive landscape in the payment cards market.
The research suite contains a detailed dataset; providing forecasts for payment card adoption, shipments and revenue across a number of different segments.
Collectively, these elements provide a critical tool for understanding this rapidly emerging market outlook; allowing card manufacturers, banks and fintechs to shape their future strategy. This research suite's unparalleled coverage makes it an incredibly useful resource for projecting the future of this highly uncertain market.
Key Features
- Market Dynamics: A strategic analysis of the major drivers, challenges, and innovations shaping the adoption and development of the payment card technologies industry, including the shift from offering basic contactless cards to more advanced physical card offerings, the rise of personalisation, and the use of premium features to attract high net worth customers.
- Key Takeaways & Strategic Recommendations: In-depth analysis of key development opportunities and findings within the payment card technology market, accompanied by strategic recommendations for stakeholders, such as card manufacturers, card networks, banks, credit card companies, fintechs and other card issuers.
- Benchmark Industry Forecasts: Includes forecasts for the total number of payment cards in circulation, annual shipments and spend, split by different card types. This data is split by 8 key forecast regions and 60 countries.
- Juniper Research Competitor Leaderboard: Key player capability and capacity assessment for 15 card manufacturers, via the Juniper Research Competitor Leaderboard.
SAMPLE VIEW
Market Data & Forecasts PDF Report:
A comprehensive analysis of the current market landscape, alongside strategic recommendations and a walk-through of the forecasts.
Market Trends & Strategies Report:
A comprehensive analysis of the current market landscape, alongside strategic recommendations.
Market Data & Forecasts
The market-leading research suite for the "Payment Card Technologies" includes access to the full set of forecast data of 37 tables and over 15,200 datapoints. Metrics in the research suite include:
- Number of Payment Cards in Service
- Payment Card Shipments
- Payment Card Technology Spend
The data is split by the following types of cards:
- Metal cards
- Biometric cards
- LED-equipped cards
- Dynamic CVV cards
- Standard contactless cards
The forecast also includes the number of cards that will feature sustainable materials.
Juniper Research Interactive Forecast Excel contains the following functionality:
- Statistics Analysis: Users benefit from the ability to search for specific metrics; displayed for all regions and countries across the data period. Graphs are easily modified and can be exported to the clipboard.
- Country Data Tool: This tool lets users look at metrics for all regions and countries in the forecast period. Users can refine the metrics displayed via a search bar.
- Country Comparison Tool: Users can select and compare specific countries. The ability to export graphs is included in this tool.
- What-if Analysis: Here, users can compare forecast metrics against their own assumptions, via 5 interactive scenarios.
Market Trends & Strategies Report
Juniper Research's new report examines the Payment Card Technologies landscape in detail; assessing current trends and factors shaping the market, such as the growing shift to offering varied card types, the need to personalise card offerings, and the impact of competition from other payment mechanisms for card issuers. The report delivers comprehensive analysis of the strategic opportunities for card manufacturers; addressing key verticals, developing challenges, and how stakeholders should navigate these.
Competitor Leaderboard Report
Juniper Research's Competitor Leaderboard provides detailed evaluation and market positioning for 15 leading payment card manufacturers. The vendors in the Competitor Leaderboard are positioned either as established leaders, leading challengers or disruptors and challengers, based on capacity and capability assessments.
The vendors in the Competitor Leaderboard include:
|
|
Backed by a robust and comprehensive scoring methodology, Juniper Research's Competitor Leaderboard allows readers to gain greater insight into leading market players; enabling them to view which companies have the highest market prospects and the strategies being implemented.
Table of Contents
Market Trends & Strategies
1. Key Takeaways & Strategic Recommendations
- 1.1. Key Takeaways
- 1.2. Strategic Recommendations
2. Market Landscape
- 2.1. Introduction
- 2.2. Definitions and Organisation of the Market
- Figure 2.1: Card Technologies Driving Innovation
- 2.2.1. Contactless Payment Cards
- 2.2.2. Biometric Payment Cards
- Figure 2.3: Mastercard Biometric Card
- 2.2.3. Metal Cards
- 2.2.4. Dynamic CSC/CVV
- Figure 2.4: Dynamic CSC/CVC Card Technology
- 2.2.5. LED Cards
- 2.2.6. Recycled Cards
- Figure 2.5: Card Recycling Box in HSBC Branches
- 2.2.7. Wood Cards
- Figure 2.6: Thales Gemalto Wood Card
- 2.2.8. Payment Wearables
- Figure 2.7: CashCuff Shirt in Use
- 2.3. Types of Vendors
- Figure 2.8: Different Roles in Cards Market
- 2.4. The History of Payment Cards
- Figure 2.9: Milestones in Credit Card Development
- 2.5. Key Trends Driving Payment Card Innovation
- 2.5.1. The Rise of Digital
- 2.5.2. Intensifying Competition within Banking
- Figure 2.11: Prominent Digital Banks & Their User Bases
3. Segment Analysis
- 3.1. Introduction
- 3.1.1. Contactless Cards
- i. The Use Case and Its Place in the Market
- ii. The Benefits of the Technology
- iii. The Challenges of Adoption
- iv. Future Outlook
- 3.1.2. Recycled/Eco Cards
- i. The Use Case and Its Place in the Market
- ii. The Benefits of the Technology
- iii. The Challenges of Adoption
- iv. Future Outlook
- 3.1.3. Biometric Cards
- i. The Use Case and its Place in the Market
- Figure 3.1: Components of Biometric Payment Card
- ii. The Benefits of the Technology
- iii. The Challenges of Adoption
- iv. Future Outlook
- i. The Use Case and its Place in the Market
- 3.1.4. Metal Cards
- i. The Use Case and its Place in the Market
- ii. The Benefits of the Technology
- iii. The Challenges of Adoption
- iv. Future Outlook
- 3.1.5. Dynamic CVV Cards
- i. The Use Case and its Place in the Market
- Figure 3.2: Thales Gemalto Dynamic Code Card
- ii. The Benefits of the Technology
- iii. The Challenges of Adoption
- Figure 3.3: BBVA Aqua Dynamic CVV in app
- iv. Future Outlook
- i. The Use Case and its Place in the Market
- 3.1.6. LED Cards
- i. The Use Case and Its Place in the Market
- ii. The Benefits of the Technology
- iii. The Challenges of Adoption
- iv. Future Outlook
- 3.1.7. Payment Wearables
- i. The Use Case and Its Place in the Market
- ii. The Benefits of the Technology
- iii. The Challenges of Adoption
- iv. Future Outlook
- 3.1.1. Contactless Cards
4. Country Readiness Index & Analysis
- 4.1. Introduction
- Figure 4.1: Juniper Research's 8 Key Regions Definition
- Figure 4.2: Juniper Research Country Readiness Index Scoring Criteria: Payment Card Technologies
- Figure 4.3: Juniper Research Country Readiness Index: Payment Card Technologies
- Figure 4.4: Payment Card Technologies Country Readiness Index: Market Segments
- 4.2. Focus Markets
- 4.2.1. Card-heavy Markets Showing Best Prospects
- Figure 4.5: Proportion of Adult Population who Hold a Bank Account (%), Selected Countries, 2024
- 4.2.2. Affluence Important Due To 'Premium' Nature of Card Offerings
- Figure 4.6: GDP per Capita ($), Selected Countries, 2024
- 4.2.3. Country Level Assessment: India
- 4.2.1. Card-heavy Markets Showing Best Prospects
- 4.3. Growth Markets
- 4.3.1. Relatively Low Card Penetration
- Figure 4.7: Average Number of Cards in Service per Adult (Over 15), 2024, Selected Countries
- 4.3.2. Relatively Low Levels of Affluence
- 4.3.1. Relatively Low Card Penetration
- 4.4. Saturated Markets
- 4.4.1. Card Payments Reaching Saturation
- Figure 4.8: Average Number of Cards in Service per Adult (Over 15), 2024, Selected Countries
- 4.4.2. Country Level Assessment: China
- 4.4.1. Card Payments Reaching Saturation
- 4.5. Developing Markets
- Table 4.9: Juniper Research's Country Readiness Index Heatmap: North America
- Table 4.10: Juniper Research's Country Readiness Index Heatmap: Latin America
- Table 4.11: Juniper Research's Country Readiness Index Heatmap: West Europe
- Table 4.12: Juniper Research's Country Readiness Index Heatmap: Central & East Europe
- Table 4.13: Juniper Research's Country Readiness Index Heatmap: Far East & China
- Table 4.14: Juniper Research's Country Readiness Index Heatmap: Indian Subcontinent
- Table 4.15: Juniper Research's Country Readiness Index Heatmap: Rest of Asia Pacific
- Figure 4.16: Juniper Research's Country Readiness Index Heatmap: Africa & Middle East
Competitor Leaderboard
1. Juniper Research Competitor Leaderboard
- 1.1. Why Read This Report
- Table 1.1: Juniper Research Competitor Leaderboard Vendors: Payment Card Technologies
- Figure 1.2: Juniper Research Competitor Leaderboard - Payment Card Technologies
- Table 1.3: Juniper Research Competitor Leaderboard: Payment Card Technologies Vendor Ranking
- Table 1.4: Juniper Research Competitor Leaderboard Payment Card Technologies - Heatmap
2. Company Profiles
- 2.1. Payment Card Technologies Vendor Profiles
- 2.1.1. allpay cards
- i. Corporate
- ii. Geographical Spread
- iii. Key Clients & Strategic Partnerships
- iv. High-level View of Offering
- v. Juniper Research's View: Key Strengths & Strategic Opportunities
- 2.1.2. CompoSecure
- i. Corporate
- Table 2.1: CompoSecure Financial Snapshot ($m), FY 2021-2023
- ii. Geographical Spread
- iii. Key Clients & Strategic Partnerships
- iv. High-level View of Offering
- v. Juniper Research's View: Key Strengths & Strategic Opportunities
- i. Corporate
- 2.1.3. CPI Card Group
- i. Corporate
- Table 2.2: CPI Financial Snapshot ($m), FY 2022-2023
- ii. Geographical Spread
- iii. Key Clients & Strategic Partnerships
- iv. High-level View of Offering
- v. Juniper Research's View: Key Strengths & Strategic Opportunities
- i. Corporate
- 2.1.4. dzcard
- i. Corporate
- ii. Geographical Spread
- iii. Key Clients & Strategic Partnerships
- iv. High-level View of Offering
- v. Juniper Research's View: Key Strengths & Strategic Opportunities
- 2.1.5. Eastcompeace
- i. Corporate
- Table 2.3: Eastcompeace Financial Snapshot ($m), FY 2021-2023
- ii. Geographical Spread
- iii. Key Clients & Strategic Partnerships
- iv. High-level View of Offering
- v. Juniper Research's View: Key Strengths & Strategic Opportunities
- i. Corporate
- 2.1.6. Fingerprints
- i. Corporate
- Table 2.4: Fingerprints Financial Snapshot ($m), FY 2021-2023
- ii. Geographical Spread
- iii. Key Clients & Strategic Partnerships
- iv. High-level View of Offering
- Figure 2.5: Fingerprints Biometric Card
- v. Juniper Research's View: Key Strengths & Strategic Opportunities
- i. Corporate
- 2.1.7. Giesecke+Devrient
- i. Corporate
- Table 2.6: G&D Financial Information Snapshot (Euro-m), 2020-2023
- ii. Geographical Spread
- iii. Key Clients & Strategic Partnerships
- iv. High-level View of Offering
- v. Juniper Research's View: Key Strengths & Strategic Opportunities
- i. Corporate
- 2.1.8. Goldpac
- i. Corporate
- Table 2.7: Goldpac Financial Information Snapshot ($m), 2021-2023
- ii. Geographical Spread
- iii. Key Clients & Strategic Partnerships
- iv. High-level View of Offering
- v. Juniper Research's View: Key Strengths & Strategic Opportunities
- i. Corporate
- 2.1.9. IDEMIA
- i. Corporate
- ii. Geographical Spread
- iii. Key Clients & Strategic Partnerships
- iv. High-level View of Offerings
- v. Juniper Research's View: Key Strengths & Strategic Opportunities
- 2.1.10. KONA I
- i. Corporate
- Table 2.8: KONA I Financial Information Snapshot ($m), 2022-2023
- ii. Geographical Spread
- iii. Key Clients & Strategic Partnerships
- iv. High-level View of Offering
- v. Juniper Research's View: Key Strengths & Strategic Opportunities
- i. Corporate
- 2.1.11. Perfect Plastic
- i. Corporate
- ii. Geographical Spread
- iii. Key Clients & Strategic Partnerships
- iv. High-level View of Offering
- v. Juniper Research's View: Key Strengths & Strategic Opportunities
- 2.1.12. Thales Group
- i. Corporate
- Table 2.9: Thales' Financial Information Snapshot, (Euro-bn), 2020-2023
- ii. Geographical Spread
- iii. Key Clients & Strategic Partnerships
- iv. High-level View of Offering
- Figure 2.10: Gemalto Voice Payment Card Pairing
- v. Juniper Research's View: Key Strengths & Strategic Opportunities
- i. Corporate
- 2.1.13. Toppan Gravity
- i. Corporate
- Figure 2.11: Toppan Holdings Inc Financial Results, FY 23 & 24, USD $m
- ii. Geographical Spread
- iii. Key Clients & Strategic Partnerships
- iv. High-level View of Offering
- v. Juniper Research's View: Key Strengths & Strategic Opportunities
- i. Corporate
- 2.1.14. Valid
- i. Corporate
- Figure 2.12: Valid Financial Results, 2021 to 2023, USD $m
- ii. Geographical Spread
- iii. Key Clients & Strategic Partnerships
- iv. High-level View of Offering
- v. Juniper Research's View: Key Strengths & Strategic Opportunities
- i. Corporate
- 2.1.15. Watchdata
- i. Corporate
- ii. Geographical Spread
- iii. Key Clients & Strategic Partnerships
- iv. High-level View of Offering
- v. Juniper Research's View: Key Strengths & Strategic Opportunities
- 2.1.1. allpay cards
- 2.2. Juniper Research Leaderboard Assessment Methodology
- 2.2.1. Limitations & Interpretation
- Table 2: Juniper Research Leaderboard Assessment Criteria: Payment Card Technologies
- 2.2.1. Limitations & Interpretation
Data & Forecasting
1. Introduction & Methodology
- 1.1. Introduction
- Figure 1.1: Card Technologies Driving Innovation
- 1.2. Forecast Introduction
- 1.2.1. Methodology & Assumptions
- Figure 1.2: Metal Cards Forecast Methodology
- Figure 1.3: Biometric Cards Forecast Methodology
- Figure 1.4: Dynamic CVV Cards Forecast Methodology
- Figure 1.5: Basic Contactless Cards Forecast Methodology
- 1.2.1. Methodology & Assumptions
2. Forecast Summary
- 2.1. Payment Card Technologies Forecasts
- 2.1.1. Payments Cards In Service
- Figure & Table 2.1: Total Number of Payment Cards in Issue (Including Debit, Credit & ATM Cards), Year End (m), Split by 8 Key Regions, 2024-2029
- 2.1.2. Payments Cards Shipments
- Figure & Table 2.2: Total Payment Card Shipments (m), Split by 8 Key Regions, 2024-2029
- Table 2.3: Total Payment Card Shipments, Split by Technology (m), 2024-2029
- 2.1.3. Payments Cards Revenue
- Figure & Table 2.4: Card Technology Revenue ($m), Split by 8 Key Regions, 2024-2029
- Table 2.5: Card Technology Revenue, Split by Technology ($m), 2024-2029
- 2.1.1. Payments Cards In Service
3. Metal Cards
- 3.1. Metal Cards Forecasts
- 3.1.1. Metal Cards in Service
- Figure & Table 3.1: Number of Payment Cards in Service which are Metal (m), Split by 8 Key Regions, 2024-2029
- 3.1.2. Metal Cards Shipments
- Figure & Table 3.2: Total Metal Card Shipments per annum (m), Split by 8 Key Regions, 2024-2029
- 3.1.3. Metal Cards Revenue
- Figure & Table 3.3: Total Metal Card Revenue ($m), Split by 8 Key Regions, 2024-2029
- 3.1.1. Metal Cards in Service
4. Biometric Cards
- 4.1. Biometric Cards Forecasts
- 4.1.1. Biometric Payment Cards in Service
- Figure & Table 4.1: Number of Payment Cards in Service which Feature Biometrics (m), Split by 8 Key Regions, 2024-2029
- 4.1.2. Biometric Payment Cards Shipments
- Figure & Table 4.2: Total Biometric Payment Card Shipments per annum (m), Split by 8 Key Regions, 2024-2029
- 4.1.3. Biometric Payment Cards Revenue
- Figure & Table 4.3: Total Biometric Payment Card Revenue ($m), Split by 8 Key Regions, 2024-2029
- 4.1.1. Biometric Payment Cards in Service
5. Dynamic CVV Cards
- 5.1. Dynamic CVV Payment Cards Forecasts
- 5.1.1. Dynamic CVV Payment Cards in Service
- Figure & Table 5.1: Number of Payment Cards in Service which Feature Dynamic CVV Codes (m), Split by 8 Key Regions, 2024-2029
- 5.1.2. Dynamic CVV Payment Cards Shipments
- Figure & Table 5.2: Total Dynamic CVV Payment Card Shipments per annum (m), Split by 8 Key Regions, 2024-2029
- 5.1.3. Dynamic CVV Payment Cards Revenue
- Figure & Table 5.3: Total Dynamic CVV Payment Card Revenue ($m), Split by 8 Key Regions, 2024-2029
- 5.1.1. Dynamic CVV Payment Cards in Service
6. LED Cards
- 6.1. LED Payment Cards Forecasts
- 6.1.1. LED Payment Cards in Service
- Figure & Table 6.1: Number of Payment Cards in Service which Feature Built in LED (m), Split by 8 Key Regions, 2024-2029
- 6.1.2. LED Payment Cards Shipments
- Figure & Table 6.2: LED Payment Card Shipments (m), Split by 8 Key Regions, 2024-2029
- 6.1.3. LED Payment Cards Revenue
- Figure & Table 6.3: Total LED Payment Card Revenue ($m), Split by 8 Key Regions, 2024-2029
- 6.1.1. LED Payment Cards in Service
7. Recycled Cards
- 7.1. Recycled Payment Cards Shipped
- Figure & Table 7.1: Number of Payment Cards Shipped Featuring Sustainable Materials (m), Split by 8 Key Regions, 2024-2029

