|
|
市場調査レポート
商品コード
1788492
スマートビルディング市場:2025-2030年Smart Buildings Market: 2025-2030 |
||||||
|
|||||||
|
|||||||


| スマートビルディング市場:2025-2030年 |
|
出版日: 2025年08月12日
発行: Juniper Research Ltd
ページ情報: 英文
納期: 即日から翌営業日
|

全表示
- 概要
- 目次
産業用スマートビルディング:エネルギー浪費削減と特化型バーティカルソリューションが2030年までに導入件数を525%押し上げる
| 主要統計 | |
|---|---|
| 2030年までに導入されるスマートビルディングの総数: | 4万8,670 |
| 2030年までに導入されるスマートビル用センサーの総数: | 147億 |
| 2030年までのスマートビル総収益: | 1,706億米ドル |
| 予測期間: | 2025-2030年 |
当調査スイートは、IoTとAIを利用して、ハードウェアとソフトウェアのサービスプロバイダーがスマートビルディングソリューションをリビングエコシステムとしてどのように再構築しているかについての詳細な分析と評価を提供します。
当スイートには、61カ国の商業用・産業用・住宅用の3つの市場セグメントにおける市場規模・予測が含まれています。さらに、市場動向と戦略に関する文書も含まれており、主要な動向、課題、関係者への提言を包括的に評価しています。
本レポートの内容はすべて英語で記載されています。
主な特徴
- 主な要点と戦略的提言:スマートビルディング市場における主要な開発機会と知見を詳細に分析し、ステークホルダーに対する主要な戦略的提言を掲載しています。
- 市場力学:市場内の主要動向と市場拡大の課題についての洞察、スマートビルシステムの高度な技術的性質がもたらす課題、セキュリティ、プライバシー、インダストリー5.0の将来的な影響に関する消費者やビル管理者の継続的な懸念、市場内の経済促進要因 (エネルギー消費と二酸化炭素排出量の追跡別エネルギーコスト、エネルギー効率を促進するネットゼロ目標) と技術促進要因 (IoT技術やデジタルトランスフォーメーションなどのスマート技術) を分析しています。また、61カ国の市場成長分析も含まれており、将来の展望を提供します。
- ベンチマーク業界予測:スマートビルサービスプロバイダーの事業概要には、スマートビルディング技術の総収益予測を商業、産業、住宅分野別に掲載しています。
- Juniper Researchの競合リーダーボード:ネットワーク事業者主要18社の能力を評価します。
サンプルビュー
市場データ・予測PDFレポート
サンプル
市場動向・戦略レポート
市場データ・予測
当調査スイートには、48の表と33,000を超えるデータポイントの予測データ一式へのアクセスが含まれています。調査スイートには以下の指標が含まれます:
- スマートビル展開数
- スマートビルセンサ導入数
- スマートビルセンサハードウェア収益
- スマートビルディングのプラットフォーム収益
- スマートビルディング市場価値
これらの指標は、以下の主要市場について提供されています:
- 商業用
- 産業用
- 住宅用
Juniper Research Interactive Forecast Excelには以下の機能があります:
- 統計分析:データ期間中のすべての地域と国について表示されます。グラフは簡単に修正でき、クリップボードへのエクスポートも可能です。
- 国別データツール:このツールでは、予測期間中のすべての地域と国の指標を見ることができます。検索バーで表示する指標を絞り込むことができます。
- 国別比較ツール:国を選択して比較することができます。このツールには、グラフをエクスポートする機能が含まれています。
- What-if分析:5つのインタラクティブなシナリオを通じて、ユーザーは予測の前提条件と比較することができます。
競合リーダーボードレポート
競合リーダーボードには、以下の主要企業が含まれています:
|
|
目次
市場動向と戦略
第1章 重要ポイントと戦略的提言
- 重要ポイント
- 戦略的提言
第2章 市場概要と将来情勢
- 市場概要
- 従来型ビルディング vs スマートビルディング
- 市場促進要因
- 技術の加速
- MBSaaS (Building Management Systems-as-a-Service)
- 政府の規制と取り組み
- スマートワーキング環境の需要動向
- 課題
- セキュリティとサイバーセキュリティの脅威
- プライバシー
- 技術およびインフラの導入コストの高さ
- 信頼性の高いネットワーク接続
- 複雑性と技術統合
第3章 市場動向とビジネスモデル分析
- スマートビルディング市場の動向
- 5G
- 高いデータスループットと低いレイテンシ
- 信頼性
- セキュリティ
- 6Gがスマートビルディングに与える影響
- インダストリー4.0と5.0
- 安全
- 物理的なセキュリティ
- サイバーセキュリティ
- その他の技術分野
- ビジネスモデル分析
競合リーダーボード
第1章 Juniper Researchの競合のリーダーボード
- スマートビルディング-ベンダープロファイル
- ABB
- Avnet
- Bosch
- Carrier Global Corporation
- Cisco
- Delta Controls
- Hitachi
- Honeywell
- Huawei
- IBM
- Intel
- Johnson Controls
- Legrand
- Schneider Electric
- Siemens
- Telit Cinterion
- Verdigris Technologies
- Boldyn Networks
- 評価手法
- 制限と解釈
- 関連調査
データ・予測
第1章 市場データ・予測
- スマートビルディング市場概要
- スマートビルディング予測
- スマートビル総数
- スマートビルディング総収益
- 商業用スマートビルディング総数
- 産業用スマートビルディング総数
- 住宅用スマートビルディング総数
'Industrial Smart Buildings: Energy Wastage and Bespoke Vertical Solutions to Drive 525% Surge in Deployments by 2030'
| KEY STATISTICS | |
|---|---|
| Total smart building deployments by 2030: | 486.7m |
| Total smart building sensor deployments by 2030: | 14.7bn |
| Total smart building revenue by 2030: | $170.6bn |
| Forecast period: | 2025-2030 |
Overview
Our "Smart Buildings" research suite provides in-depth analysis and evaluation of how hardware and software service providers are reimagining smart building solutions as living ecosystems, using Internet of Things (IoT) and AI.
The suite includes a data deliverable; sizing the market and providing key forecast data across 61 countries and three market segments - Commercial, Industrial, and Residential. It also includes a Market Trends and Strategies document, which gives a complete assessment of the key trends, challenges, and recommendations for stakeholders. Collectively, they provide a critical tool for understanding this rapidly emerging market; allowing building automation vendors, IoT vendors, energy consumption management vendors, and smart building vendors to shape their future strategy.
All report content is delivered in the English language.
Key Features
- Key Takeaways & Strategic Recommendations: In-depth analysis of key development opportunities and findings within the smart buildings market; accompanied by key strategic recommendations for stakeholders.
- Market Dynamics: Insights into key trends and market expansion challenges within the market; addressing challenges posed by the highly technical nature of smart building systems, as well as ongoing consumer and building manager fears regarding security, privacy and the future impacts of industry 5.0. It analyses economical drivers (energy costs from energy consumption and carbon emission tracking, and net zero goals driving energy efficiency) as well as technological drivers (smart technology such as IoT technologies and digital transformation) within the market. Our Smart Buildings market research also includes a regional market growth analysis on the current development and segment growth of the smart building market in 61 countries; providing a future outlook.
- Benchmark Industry Forecasts: The business overview of smart building service providers includes forecasts for total revenue for smart building technologies, split by commercial, industrial, and residential sectors.
- Juniper Research Competitor Leaderboard: Key player capability and capacity assessment for 18 network operators, via the Juniper Research Competitor Leaderboard.
SAMPLE VIEW
Market Data & Forecasts PDF Report
The numbers tell you what's happening, but our written report details why, alongside the methodologies.
SAMPLE VIEW
Market Trends & Strategies Report
A comprehensive analysis of the current market landscape, alongside strategic recommendations.
Market Data & Forecasts
The market-leading research suite for the "Smart Buildings" market includes access to the full set of forecast data of 48 tables and over 33,000 datapoints. Metrics in the research suite include:
- Smart Building Deployments
- Smart Building Sensors Deployed
- Smart Building Sensor Hardware Revenue
- Smart Building Platform Revenue
- Smart Building Market Value
These metrics are provided for the following key market verticals:
- Commercial
- Industrial
- Residential
Juniper Research Interactive Forecast Excel contains the following functionality:
- Statistics Analysis: Users benefit from the ability to search for specific metrics; displayed for all regions and countries across the data period. Graphs are easily modified and can be exported to the clipboard.
- Country Data Tool: This tool allows users to look at metrics for all regions and countries in the forecast period. Users can refine the metrics displayed via a search bar.
- Country Comparison Tool: Users can select and compare countries. The ability to export graphs is included in this tool.
- What-if Analysis: Here, users can compare forecast metrics against their own assumptions, via five interactive scenarios.
Market Trends & Strategies Report
This report evaluates the global market for smart buildings. It considers the key technical differences between legacy and smart technology, and the challenges in bridging the gap between them going forwards. It also analyses different business models for deploying smart buildings and their pros and cons. Furthermore, it includes Juniper Research's ultimate Key Takeaways and Strategic Recommendations for the smart buildings market; summarising all its analysis.
Competitor Leaderboard Report
This market study includes a Competitor Leaderboard report, which provides detailed evaluation and market positioning of 18 smart buildings vendors. The vendors are positioned as established leaders, leading challengers, or disruptors and challengers, based on product and capability assessments.
Juniper Research's Competitor Leaderboard for Smart Buildings includes the following key players:
|
|
This report is centred around the Juniper Research Competitor Leaderboard; a vendor positioning tool that provides an at-a-glance view of the competitive landscape in a market, backed by a robust methodology.
Table of Contents
Market Trends & Strategies
1. Key Takeaways & Strategic Recommendations
- 1.1. Key Takeaways
- 1.2. Strategic Recommendations
2. Market Overview & Future Landscape
- 2.1.1. Market Overview
- Figure 2.1: Smart Building Technology
- 2.1.2. Traditional vs Smart
- i. Smart Building Sectors
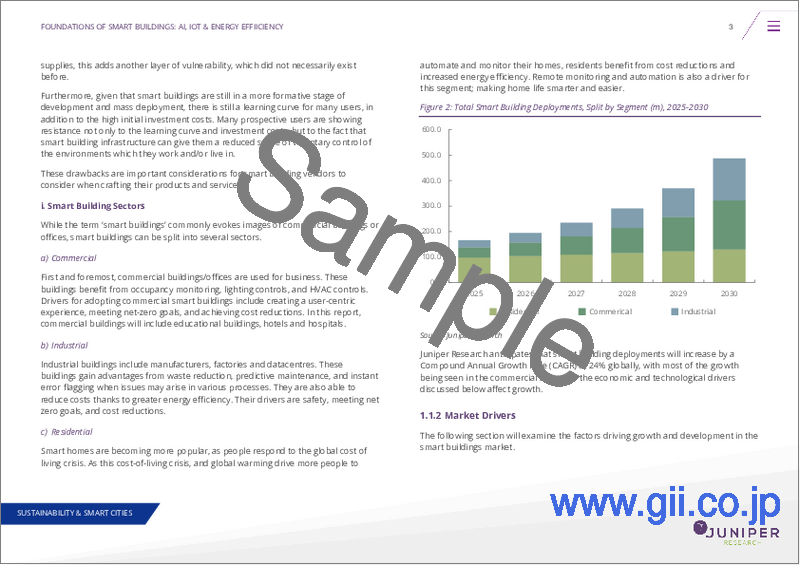
- Figure 2.2: Total Smart Building Deployments, Split by Segment (m), 2025-2030
- i. Smart Building Sectors
- 2.1.3. Market Drivers
- i. Technological Acceleration
- ii. Building Management Systems-as-a-Service (MBSaaS)
- iii. Government Regulation and Initiatives
- iv. Demand Trends for Smart Working Environments
- 2.1.4. Challenges
- i. Security and Cyber Security Threats
- ii. Privacy
- iii. High Cost of Technological and Infrastructural Implementation
- iv. Reliable Network Connection
- v. Complexity and Technological Integration
3. Market Trends & Business Model Analysis
- 3.1. Smart Buildings Market Trends
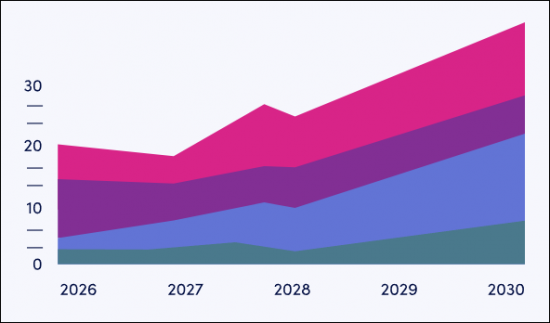
- Figure 3.1: Smart Buildings Market Revenue ($m) Split by 8 Key Regions, 2021-2030
- 3.1.1 5G
- i. High Data Throughput and Lower Latency
- ii. Reliability
- iii. Security
- Figure 3.1: Proportion of SIMs That Are 5G, Split by 8 Key Regions, 2025-2030
- iv. How 6G Will Impact Smart Buildings
- Figure 3.2: Average Number of Sensors per Residential Smart Building Deployment (m), Split by 8 Key Regions, 2025-2030
- 3.1.2. Industry 4.0 and 5.0
- 3.1.3. Security
- i. Physical Security
- ii. Cyber Security
- 3.1.4. Other Technical Areas
- 3.2. Business Model Analysis
- i. Buying
- ii. Leasing
- iii. Smart Financing
- iv. As-a-Service
- v. Summary
Competitor Leaderboard
1. Juniper Research Competitor Leaderboard
- 1.1. Why Read this Report
- Table 1.1: Juniper Research Competitor Leaderboard: Smart Buildings Market - Vendors Products & Portfolio
- Figure 1.2: Juniper Research Competitor Leaderboard: Smart Buildings Vendors
- Source: Juniper ResearchTable 1.3: Juniper Research Competitor Leaderboard: Smart Buildings Market -18 Vendors
- Table 1.4: Juniper Research Competitor Leaderboard Heatmap - Smart Buildings Vendors (1 of 2)
- Table 1.5: Juniper Research Competitor Leaderboard Heatmap - Smart Buildings Vendors (2 of 2)
- 1.2. Smart Buildings - Vendor Profiles
- 1.2.1. ABB
- i. Corporate
- Table 1.6: ABB's Financial Snapshot ($m), 2022-2025
- ii. Geographical Spread
- iii. Key Clients & Strategic Partnerships
- iv. High-level View of Offerings
- v. Juniper Research's View: Key Strengths & Strategic Opportunities
- i. Corporate
- 1.2.2. Avnet
- i. Corporate
- Table 1.7: Avnet's Financial Snapshot ($m), 2022-2024
- ii. Geographical Spread
- iii. Key Clients & Strategic Partnerships
- iv. High-level View of Offerings
- v. Juniper Research's View: Key Strengths & Strategic Development Opportunities
- i. Corporate
- 1.2.3. Bosch
- i. Corporate
- Table 1.8: Bosch's Financial Snapshot ($m), 2021-2024
- ii. Geographical Spread
- iii. Key Clients & Strategic Partnerships
- iv. High-level View of Offerings
- v. Juniper Research's View: Key Strengths & Strategic Development Opportunities
- i. Corporate
- 1.2.4. Carrier Global Corporation
- i. Corporate
- Table 1.9: Carrier's Financial Snapshot ($m), 2022-2024
- ii. Geographical Spread
- iii. Key Clients & Strategic Partnerships
- iv. High-level View of Offerings
- v. Juniper Research's View: Key Strengths & Strategic Development Opportunities
- i. Corporate
- 1.2.5. Cisco
- i. Corporate
- Table 1.10: Cisco's Financial Snapshot ($m), 2022-2024
- ii. Geographical Spread
- iii. Key Clients & Strategic Partnerships
- iv. High-level View of Offerings
- v. Juniper Research's View: Key Strengths & Strategic Development Opportunities
- i. Corporate
- 1.2.6. Delta Controls
- i. Corporate
- ii. Geographical Spread
- iii. Key Clients & Strategic Partnerships
- iv. High-level View of Offerings
- v. Juniper Research's View: Key Strengths & Strategic Development Opportunities
- 1.2.7. Hitachi
- i. Corporate
- Table 1.11: Hitachi's Financial Snapshot ($m), 2021-2024
- ii. Geographical Spread
- iii. Key Clients & Strategic Partnerships
- iv. High-level View of Offerings
- v. Juniper Research's View: Key Strengths & Strategic Development Opportunities
- i. Corporate
- 1.2.8. Honeywell
- i. Corporate
- Table 1.12: Honeywell's Financial Snapshot ($m), 2021-2024
- ii. Geographical Spread
- iii. Key Clients & Strategic Partnerships
- iv. High-level View of Offerings
- v. Juniper Research's View: Key Strengths & Strategic Development Opportunities
- i. Corporate
- 1.2.9. Huawei
- i. Corporate
- Table 1.13: Huawei's Financial Summary ($m), 2021-2024
- ii. Geographical Spread
- iii. Key Clients & Strategic Partnerships
- iv. High-level View of Offerings
- v. Juniper Research's View: Key Strengths & Strategic Development Opportunities
- i. Corporate
- 1.2.10. IBM
- i. Corporate
- Table 1.14: IBM's Financial Summary ($m), 2022-2024
- ii. Geographical Spread
- iii. Key Clients & Strategic Partnerships
- iv. High-level View of Offerings
- v. Juniper Research's View: Key Strengths & Strategic Development Opportunities
- i. Corporate
- 1.2.11. Intel
- i. Corporate
- Table 1.15: Intel's Financial Summary ($m), 2022-2024
- ii. Geographical Spread
- iii. Key Clients & Strategic Partnerships
- iv. High-level View of Offerings
- v. Juniper Research's View: Key Strengths & Strategic Development Opportunities
- i. Corporate
- 1.2.12. Johnson Controls
- i. Corporate
- Table 1.16: Johnson Controls' Financial Summary ($m), 2022-2024
- ii. Geographical Spread
- iii. Key Clients & Strategic Partnerships
- iv. High-level View of Offerings
- v. Juniper Research's View: Key Strengths & Strategic Development Opportunities
- i. Corporate
- 1.2.13. Legrand
- i. Corporate
- Table 1.17: Legrand's Financial Summary ($m) 2022-2024
- ii. Geographical Spread
- iii. Key Clients & Strategic Partnerships
- iv. High-level View of Offerings
- v. Juniper Research's View: Key Strengths & Strategic Development Opportunities
- i. Corporate
- 1.2.14. Schneider Electric
- i. Corporate
- Table 1.18: Schneider Electric's Financial Summary, 2022-2024
- ii. Geographical Spread
- iii. Key Clients & Strategic Partnerships
- iv. High-level View of Offerings
- v. Juniper Research's View: Key Strengths & Strategic Development Opportunities
- i. Corporate
- 1.2.15. Siemens
- i. Corporate
- Table 1.19: Siemens' Financial Summary 2022-2024
- ii. Geographical Spread
- iii. Key Clients & Strategic Partnerships
- iv. High-level View of Offerings
- v. Juniper Research's View: Key Strengths & Strategic Development Opportunities
- i. Corporate
- 1.2.16. Telit Cinterion
- i. Corporate
- ii. Geographical Spread
- iii. Key Clients & Strategic Partnerships
- iv. High-level View of Offerings
- v. Juniper Research's View: Key Strengths & Strategic Development Opportunities
- 1.2.17. Verdigris Technologies
- i. Corporate
- ii. Geographical Spread
- iii. Key Clients & Strategic Partnerships
- iv. High-level View of Offerings
- v. Juniper Research's View: Key Strengths & Strategic Development Opportunities
- 1.2.18. Boldyn Networks
- i. Corporate
- ii. Geographical Spread
- iii. Key Clients & Strategic Partnerships
- iv. High-level View of Offerings
- v. Juniper Research's View: Key Strengths & Strategic Development Opportunities
- 1.2.1. ABB
- 1.3. Juniper Research Leaderboard Assessment Methodology
- 1.4. Limitation & Interpretations
- Table 1.20: Juniper Research Competitor Leaderboard Scoring Criteria
- 1.5. Related Research
Data & Forecasting
1. Market Data & Forecasting
- 1.1. Smart Buildings Market Overview
- 1.1.1. Methodology
- Figure 1.1: Smart Buildings Forecast Methodology: Commercial Buildings
- Figure 1.2: Smart Buildings Forecast Methodology: Industrial Buildings
- Figure 1.3: Smart Buildings Forecast Methodology: Residential Buildings
- 1.1.1. Methodology
- 1.2. Smart Building Forecasts
- 1.2.1. Total Number of Smart Buildings
- Figure & Table 1.4: Number of Buildings Deploying Smart Building Technologies (m), Split by 8 Key Regions, 2025-2030
- Table 1.5: Number of Buildings Deploying Smart Features, Split by Segment, 2025-2030
- 1.2.2. Total Smart Buildings Revenue
- Figure & Table 1.6: Smart Buildings Revenue ($m), Split by 8 Key Regions, 2025-2030
- Table 1.7: Smart Buildings Revenue, Split by Segment, 2025-2030
- 1.2.3. Total Commercial Smart Buildings
- Figure & Table 1.8: Number of Commercial Buildings Deploying Smart Building Technologies (m), Split by 8 Key Regions, 2025-2030
- 1.2.4. Total Industrial Smart Buildings
- Figure & Table 1.9: Number of Industrial Buildings Deploying Smart Building Technologies (m), Split by 8 Key Regions, 2025-2030
- 1.2.5. Total Residential Smart Buildings
- Figure & Table 1.10: Number of Industrial Buildings Deploying Smart Building Technologies (m), Split by 8 Key Regions, 2025-2030
- 1.2.1. Total Number of Smart Buildings
