|
|
市場調査レポート
商品コード
1415810
バイオメトリクス店舗決済の世界市場 (2024~2028年)Biometric In-store Payments Market: 2024-2028 |
||||||
|
|||||||
|
|||||||


| バイオメトリクス店舗決済の世界市場 (2024~2028年) |
|
出版日: 2024年01月29日
発行: Juniper Research Ltd
ページ情報: 英文
納期: 即日から翌営業日
|

全表示
- 概要
- 目次
| 主要統計 | |
|---|---|
| 総決済額 (2024年) | 4,291億米ドル |
| 総決済額 (2028年) | 1兆2,000億米ドル |
| 市場成長率 (2024~2028年) | 113.6% |
| 予測期間 | 2024~2028年 |
概要
当レポートでは、世界のバイオメトリクス (生体認証) 店舗決済の市場について分析し、主なバイオメトリクス決済手段 (手のひら静脈、指紋認証、顔認証、虹彩認証など) の特徴や加盟店・消費者双方への利点、市場の基本構造と近年の発展動向、市場規模の動向見通し、主要企業のプロファイルと競合情勢などを調査しております。
サンプルビュー
市場動向と予測
市場データと予測
当レポートには、21枚の図表と9,570点以上のデータポイントからなるの予測データ一式へのアクセスが含まれています。分析指標には以下の項目が含まれます:
- バイオメトリクス対応POSデバイスの総台数
- バイオメトリック決済の総件数
- バイオメトリック対応POSシステムの総決済額
以上の指標は、以下のセグメント別に提供されています:
- mPOS
- 専用POS
Juniper Research InteractiveのExcel予測シートには以下の機能があります:
- 統計分析:分析期間中の全ての地域・国を対象に、特定の指標を検索できます。また、グラフを簡単に生成して、クリップボードに貼り付けられます。
- 国別データツール:予測期間中のすべての地域と国の指標を見ることができます。また検索バーで、表示される指標を絞り込むことができます。
- 国別比較ツール:国を選択して、特定の国と相互比較することができます。このツールには、グラフのエクスポート機能が含まれています。
- What-if分析:5つのインタラクティブなシナリオを用いて、設定条件ごとに予測指標を比較することができます。
目次
第1章 主要な要点と戦略的提言
第2章 市場情勢
- イントロダクション
- 定義と範囲
- 小売市場
- 小売市場におけるバイオメトリクスの進化
- バイオメトリクスによる店舗内決済が小売業界をどのように変革するか
- バイオメトリクスの情勢
- 既に生活の大きな領域を占めているバイオメトリクス技術
- バイオメトリクスの主な用途
- オンライン決済
- 店舗内決済
- ATM決済
- 送金
- 暗号通貨
- アクセス制御
- 金融包摂
- マーケティングシステム
- バイオメトリクスシステムの限界
- バイオメトリクス決済の規制状況
- 主要な動向と推進力
- プライバシー
- バイオメトリクスに関連するその他の課題
第3章 支払いフォームの要素とセグメント分析
- バイオメトリクス端末
- 手のひら静脈
- 指紋
- 顔
- 虹彩・網膜
- その他のバイオメトリクス端末
- バイオメトリクス決済カード
- モバイル決済用バイオメトリクス
- スーパーマーケットとハイパーマーケット
- コンビニエンスストア
- QSR (クイックサービスレストラン)
- ブティック
第4章 競合企業のリーダーボードとベンダープロファイル
- このレポートを読む理由
- バイオメトリクス店舗決済:ベンダープロファイル
- Alipay/Ant Group
- 企業
- 進出地域
- 主要顧客と事業提携
- 製品/サービスの概要
- JuniperResearchの見解:主な強みと戦略展開の機会
- Amazon
- Fingerprints
- G+D
- IDEMIA
- IDEX
- Ingenico
- J.P Morgan
- Mastercard
- OVE Touch & Go
- PayByFace
- PayEye
- PopID
- Telpo
- Tencent
- Thales
- 制限と解釈
- Alipay/Ant Group
第5章 市場予測
- イントロダクション
- 市場予測:概要
- バイオメトリクスPOSの総決済額
- バイオメトリクス対応POS端末を介した決済の総件数
- 世界のバイオメトリクス対応POS端末の台数
- mPOSの予測:概要
- バイオメトリクス技術を搭載したmPOS端末の利用台数
- バイオメトリクスmPOSの総決済額
- 専用POSの予測:概要
- バイオメトリクス技術を搭載した専用POS端末の利用台数
- バイオメトリクス専用POSの総決済額
- 文末脚注
| KEY STATISTICS | |
|---|---|
| Total transaction value in 2024: | $429.1 billion |
| Total transaction value in 2028: | $1.2 trillion |
| 2024 to 2028 market growth: | 113.6% |
| Forecast period: | 2024-2028 |
Overview
Our “Biometric In-store Payments ” research suite provides in-depth analysis and evaluation of how the in-store payments ecosystem is adapting to include biometric payment solutions. Focusing on palm vein, fingerprint recognition, facial recognition and iris recognition, which can provide greater ease for merchants and consumers.
SAMPLE VIEW
A comprehensive analysis of the current market landscape, alongside strategic recommendations and a walk-through of the forecasts.
Market Trends & Forecasts
The suite includes both a data deliverable, sizing the market and providing key forecast data across 60 countries and several different segments, and a Strategy & Forecasts document which gives a complete assessment of the key trends, challenges and recommendations for stakeholders. Collectively, they provide a critical tool for understanding this rapidly emerging market; allowing payment companies, biometric card manufacturers and biometric in-store terminal vendors to shape their future business model.
Key Features
- Market Dynamics: Insights into key trends and market expansion challenges within the biometric in-store payments market; addressing challenges posed by the technical and costly nature of biometric in-store payments and ongoing consumer fears regarding level of security. It will also analyse the potential benefits it will be able to provide in the challenging in-store retail market.
- Key Takeaways & Strategic Recommendations: In-depth analysis of key development opportunities and key findings within the biometric in-store payments market, accompanied by key strategic recommendations for stakeholders.
- Benchmark Industry Forecasts: Overview into biometric in-store payments, including forecasts for total number of biometric-enabled POS terminals, transactions and spend via biometric in-store payments, split by mPOS and dedicated POS.
- Juniper Research Competitor Leaderboard: Key player capability and capacity assessment for 16 biometric in-store payments vendors, featuring market size for major players in the biometric-in store payments industry. Delivered via the Juniper Research Competitor Leaderboard.
- Alipay
- Amazon
- Fingerprints
- G+D
- IDEMIA
- IDEX
- Ingenico
- JPMorgan
- Mastercard
- OVE Touch&Go
- PayByFace
- PayEye
- Pop ID
- Telpo
- Tencent
- Thales
Market Data & Forecasts
The market-leading research suite for the biometric in-store payments market includes access to the full set of forecast data of 21 tables and over 9,570 datapoints. Metrics in the research suite include:
- Total Number of Biometric-enabled POS Devices
- Total Number of Biometric Transactions
- Total Spend over Biometric-enabled POS Systems
These metrics are provided for the following key market verticals:
- mPOS
- Dedicated POS
Juniper Research Interactive Forecast Excel contains the following functionality:
- Statistics Analysis: Users benefit from the ability to search for specific metrics, displayed for all regions and countries across the data period. Graphs are easily modified and can be exported to the clipboard.
- Country Data Tool: This tool lets users look at metrics for all regions and countries in the forecast period. Users can refine the metrics displayed via a search bar.
- Country Comparison Tool: Users can select countries and compare each of them for specific countries. The ability to export graphs is included in this tool.
- What-if Analysis: Here, users can compare forecast metrics against their own assumptions, via five interactive scenarios
Table of Contents
1. Key Takeaways & Strategic Recommendations
- 1.1. Key Takeaways
- 1.2. Strategic Recommendations
2. Market Landscape
- 2.1. Introduction
- 2.2. Definitions and Scope
- 2.2.1. Definitions
- i. Biometric Verification
- Figure 2.1: Main Biometric Verification Methods
- ii. Biometric Authentication
- iii. Biometric In-store
- i. Biometric Verification
- 2.2.2. Using Biometric for In-store Payments
- i. The Biometric In-store Payment Process
- ii. Reason to Authenticate Payments Using Biometrics
- 2.2.1. Definitions
- 2.3. The Retail Market
- 2.3.1. Evolution of Biometrics in the Retail Market
- 2.3.2. How Biometric In-store Payments are Transforming the Retail Industry
- i. Heightened Transaction Security
- ii. Seamless Customer Experience
- iii. Personalised Shopping Experiences
- iv. Enhanced Loyalty Programmes with Seamless Enrolment
- v. Rapid Customer Onboarding
- vi. Diverse Authentication Options
- vii. Competitive Edge
- viii. Customer Service Improvement with Efficient Returns/Exchanges
- 2.4. Biometric Landscape
- 2.4.1. Biometric Technology Is Already a Big Part of People's Lives
- 2.4.2. Main Applications of Biometrics
- i. Online Transactions
- ii. In-store Payments
- iii. ATM Transactions
- iv. Remittances
- v. Cryptocurrency
- vi. Access Control
- vii. Financial Inclusion
- viii. Marketing Systems
- 2.4.3. Limitations of Biometric Systems
- i. Failure to Enrol
- ii. False Acceptance and Rejection Rates
- iii. Spoofing
- iv. Compromised Biometrics
- 2.4.4. Regulatory Landscape for Biometric Payments
- 2.5 Key Trends & Drivers
- 2.6. Privacy
- 2.6.1. Privacy Challenges
- i. Function Creep
- ii. Covert Collection
- iii. Secondary Information
- iv. Other Challenges
- 2.6.2. Biometric and Privacy Laws
- 2.6.1. Privacy Challenges
- 2.7. Other Challenges Related to Biometrics
- 2.7.1. Technical Challenges
- 2.7.2. Legal Concerns
- 2.7.3. High Cost
- 2.7.4. Ethical Issues
3. Payment Form Factors & Segment Analysis
- 3.1. Biometric Terminals
- 3.1.1. Palm Vein
- i. Definitions
- ii. Deployments
- Figure 3.1: Palm scanning payment model
- iii. Challenges
- iv. Future Outlook
- 3.1.2. Fingerprint
- i. Definitions
- Figure 3.2: Biometric Terminals' Accuracy and Cost Comparison
- ii. Deployments
- iii. Challenges
- iv. Future Outlook
- i. Definitions
- 3.1.3. Face
- i. Definitions
- ii. Deployments
- iii. Challenges
- iv. Future Outlook
- 3.1.4. Iris and Retina
- i. Definition
- ii. Deployments
- iii. Challenges
- iv. Future Outlook
- 3.1.5. Other Biometric Terminals
- i. Voice Waveform Recognition
- ii. Earlobe and Hand Geometry Identification
- 3.1.1. Palm Vein
- 3.2. Biometric Payment Cards
- 3.2.1. Definition
- 3.2.2. The Functioning of Biometric Cards
- 3.2.3. Current Status
- Figure 3.3: SCA Authentication
- 3.2.4 Key Deployments
- 3.2.5. Challenges
- 3.2.6. Future Outlook
- 3.3. Mobile Payment Biometric
- 3.3.1. Current Status
- 3.3.2 Key Developments
- 3.3.3. Future Outlook
- 3.4. Supermarkets & Hypermarkets
- i. Current Status
- ii. Key Deployments
- 3.5. Convenience Stores
- i. Current Status
- ii. Key Deployment
- 3.6. QSRs (Quick Service Restaurants)
- i. Current Status
- ii. Key Development
- 3.7. Boutiques
4. Competitor Leaderboard & Vendor Profiles
- 4.1. Why Read This Report
- Table 4.1: Juniper Research Competitor Leaderboard Vendors: Biometric In-store Payments
- Figure 4.2: Juniper Research Competitor Leaderboard - Biometric In-store Payments
- Table 4.3: Juniper Research Competitor Leaderboard: Biometric In-Store Payments Vendor Ranking
- Table 4.4: Juniper Research Competitor Leaderboard Biometric In-Store Payments - Heatmap
- 4.2. Biometric In-store Payments Vendor Profiles
- 4.2.1. Alipay/Ant Group
- i. Corporate
- ii. Geographical Spread
- iii. Key Clients & Strategic Partnerships
- iv. High-level View of Offerings
- v. Juniper Research's View: Key Strengths & Strategic Development Opportunities
- 4.2.2. Amazon
- i. Corporate
- ii. Geographical Spread
- iii. Key Clients & Strategic Partnerships
- iv. High-level View of Offerings
- Figure 4.5: Amazon One, Pay by Palm Technology
- v. Juniper Research's View: Key Strengths & Strategic Development Opportunities
- 4.2.3. Fingerprints
- i. Corporate
- ii. Geographic Spread
- iii. Key Clients & Strategic Partnerships
- iv. High-level View of Offerings
- Figure 4.6: Fingerprints' Biometric Card
- v. Juniper Research's View: Key Strengths & Strategic Development Opportunities
- 4.2.4. G+D
- i. Corporate
- ii. Geographical Spread
- iii. Key Clients & Strategic Partnerships
- iv. High-level Views of Offerings
- Figure 4.7: G+D Convego YOU Card
- v. Juniper Research's View: Key Strengths & Strategic Development Opportunities
- 4.2.5. IDEMIA
- i. Corporate
- ii. Geographic Spread
- iii. Key Clients & Strategic Partnerships
- iv. High-level View of Offerings
- Figure 4.8: IDEMIA's FCODE Intuitive Enrolment
- v. Juniper Research's View: Key Strengths & Strategic Development Opportunities
- 4.2.6. IDEX
- i. Corporate
- Table 4.9: IDEX's Funding Rounds
- ii. Geographic Spread
- iii. Key Clients & Strategic Partnerships
- iv. High-Level View of Offerings
- v. Juniper Research's View: Key Strengths & Strategic Development Opportunities
- i. Corporate
- 4.2.7. Ingenico
- i. Corporate
- ii. Geographic Spread
- iii. Key Clients & Strategic Partnerships
- iv. High-level View of Offerings
- v. Juniper Research's View: Key Strengths & Strategic Development Opportunities
- 4.2.8. J.P Morgan
- i. Corporate
- ii. Geographic Spread
- iii. Key Clients & Strategic Partnerships
- iv. High-level View of Offering
- v. Juniper Research's View: Key Strengths & Strategic Development Opportunities
- 4.2.9. Mastercard
- i. Corporate
- ii. Geographic Spread
- iii. Key Clients & Strategic Partnerships
- iv. High-level View of Offerings
- Figure 4.10: Facial Recognition-based 'Pay by Selfie' by Mastercard
- v. Juniper Research's View: Key Strengths & Strategic Development Opportunities
- 4.2.10. OVE Touch & Go
- i. Corporate
- ii. Geographic Spread
- iii. Key Clients & Strategic Partnerships
- iv. High-level View of Offerings
- v. Juniper Research's View: Key Strengths & Strategic Development Opportunities
- 4.2.11. PayByFace
- i. Corporate
- ii. Geographic Spread
- iii. Key Clients & Strategic Partnerships
- iv. High-level View of Offerings
- v. Juniper Research's View: Key Strengths & Strategic Development Opportunities
- 4.2.12. PayEye
- i. Corporate
- Table 4.11: PayEye's Funding Rounds (€m), 2020-2022
- ii. Geographic Spread
- iii. Key Clients & Strategic Partnerships
- iv. High-level View of Offerings
- v. Juniper Research's View: Key Strengths & Strategic Development Opportunities
- i. Corporate
- 4.2.13. PopID
- i. Corporate
- Table 4.12: PopID's Funding Rounds ($m), 2019-2021
- ii. Geographic Spread
- iii. Key Clients & Strategic Partnerships
- iv. High-level View of Offerings
- v. Juniper Research's View: Key Strengths & Strategic Development Opportunities
- i. Corporate
- 4.2.14. Telpo
- i. Corporate
- ii. Geographic Spread
- iii. Key Clients & Strategic Partnerships
- iv. High-level View of Offerings
- Figure 4.13: Telpo's Face Payment Solution
- Figure 4.14: Telpo's Retail Solution Overview
- v. Juniper Research's View: Key Strengths & Strategic Development Opportunities
- 4.2.15. Tencent
- i. Corporate
- Table 4.15: Tencent's Funding Rounds ($bn), 1999-2020
- ii. Geographic Spread
- iii. Key Clients & Strategic Partnerships
- iv. High-level View of Offerings
- v. Juniper Research's View: Key Strengths & Strategic Development Opportunities
- i. Corporate
- 4.2.16. Thales
- i. Corporate
- ii. Geographic Spread
- iii. Key Clients & Strategic Partnerships
- iv. High-level View of Offerings
- Figure 4.16: Thales IDPrime FIDO Bio Smart Card
- Figure 4.17: Thales Biometric Card Enrolment
- v. Juniper Research's View: Key Strengths & Strategic Development Opportunities
- 4.2.1. Alipay/Ant Group
- 4.1. Juniper Research Leaderboard Assessment Methodology
- 4.1.1. Limitations & Interpretations
- Table 4.18: Juniper Research Leaderboard Assessment Criteria
- 4.1.1. Limitations & Interpretations
5. Market Forecasts
- 5.1. Introduction
- 5.1.1. Biometric In-store mPOS Forecast Methodology
- 5.1.2. Biometric In-store Dedicated POS Forecast Methodology
- Figure 5.1: Biometric In-store Payments Methodology
- 5.2. Market Forecast Summary
- 5.2.1. Total Value of Biometric POS Transactions
- Figure & Table 5.2: Total Value of Biometric POS Transactions ($m), Split by 8 Key Regions, 2023-2028
- 5.2.2. Total Number of Transactions via Biometric-enabled POS Terminals
- Figure & Table 5.3: Total Number of Transactions via Biometric-enabled POS Terminals (m), Split by 8 Key Regions, 2023-2028
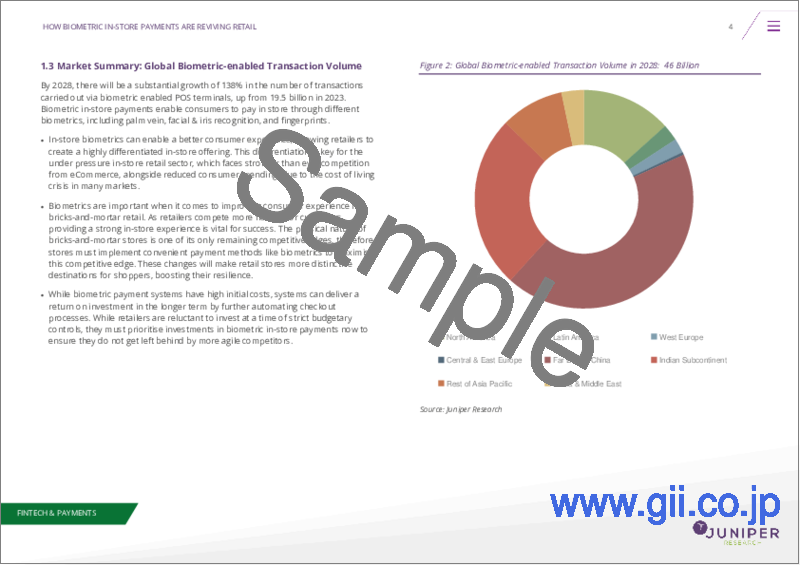
- 5.2.3. Global Number of Biometric-enabled POS Terminals
- Figure & Table 5.4: Total Number of Biometric-enabled POS Terminals (m), Split by 8 Key Regions, 2023-2028
- 5.2.1. Total Value of Biometric POS Transactions
- 5.3. mPOS Forecast Summary
- 5.3.1. Number of mPOS Terminals in Use Featuring Biometric Technology
- Figure & Table 5.5: Total Number of mPOS Terminals in Use Featuring Biometric Technology (m), Split by 8 Key Regions, 2023-2028
- 5.3.2. Total Value of Biometric mPOS Transactions
- Figure & Table 5.6: Total Value of Biometric mPOS Transactions ($m), Split by 8 Key Regions 2023-2028
- 5.3.1. Number of mPOS Terminals in Use Featuring Biometric Technology
- 5.4. Dedicated POS Forecast Summary
- 5.4.1. Number of Dedicated POS Terminals in Use Featuring Biometric Technology
- Figure & Table 5.7: Total Number of Dedicated Terminals in Use Featuring Biometric Technology (m), Split by 8 Key Regions, 2023-2028
- 5.4.2. Total Value of Biometric Dedicated POS Transactions
- Figure & Table 5.8: Total Value of Biometric Dedicated POS Transactions ($m), Split by 8 Key Regions, 2023-2028
- 5.4.1. Number of Dedicated POS Terminals in Use Featuring Biometric Technology
- 5.5. Endnotes
