|
|
市場調査レポート
商品コード
1186909
遠隔患者モニタリング:主要動向、地域別分析、市場予測 (2023年~2027年)Remote Patient Monitoring: Key Trends, Regional Analysis and Market Forecasts 2023-2027 |
||||||
|
|
|||||||


| 遠隔患者モニタリング:主要動向、地域別分析、市場予測 (2023年~2027年) |
|
出版日: 2023年01月16日
発行: Juniper Research Ltd
ページ情報: 英文
納期: 即日から翌営業日
|
- 全表示
- 概要
- 目次
遠隔患者モニタリング (RPM) ソリューションを利用する患者の総数は、2027年までに全世界で1億1,550万人に達しており、これは世界の総人口の1.4%に相当します。2023年のわずか7,500万人から、67%もの成長を遂げました。現在、臨床スタッフの不足や病院内の限られたスペースなど、医療システムに対する圧力の高まりがあり、代替医療ソリューションの必要性を高めています。RPMは、過剰なストレスを受けている医療施設の外で治療を行うことを可能にし、医療従事者の効率を高めます。
当レポートでは、世界の遠隔患者モニタリングの市場について分析し、システムの概略や主な活用領域、全体的な市場規模の動向見通し (今後5年間分)、部門別・地域別・業種別の詳細動向、市場の競争構造、今後の成長可能性と課題、主要企業のプロファイル (全15社) などを調査しております。
回答された主な質問
- 1. 主要な市場動向は、遠隔患者モニタリングの導入予測にどのような影響を与えるか?
- 2. 遠隔患者モニタリングを加速させるのはどのような技術か?
- 3. 遠隔患者モニタリング市場の主要ベンダーはどこか?
- 4. 遠隔患者モニタリングの障害となっている制限は何か?
- 5. 遠隔患者モニタリングが最も成功するのはどの地域か?
主な市場統計
| 2023年の市場規模 | 720億米ドル |
| 2027年の市場規模 | 1,100億米ドル |
| 2023年から2027年の成長率 | 54% |
主な特徴
- ベンチマーク業界予測: 地域別 (全8地域)、国別 (全60ヶ国)
- 北米
- カナダ、米国
- ラテンアメリカ
- アルゼンチン、ブラジル、チリ、コロンビア、エクアドル、メキシコ、ペルー、ウルグアイ
- 西欧
- オーストリア、ベルギー、デンマーク、フィンランド、フランス、ドイツ、ギリシャ、アイルランド、イタリア、オランダ、ノルウェー、ポルトガル、スペイン、スウェーデン、スイス、英国
- 中東欧
- クロアチア、チェコ、ハンガリー、ポーランド、ルーマニア、ロシア、トルコ、ウクライナ
- 極東・中国
- 中国、香港、日本、韓国
- インド亜大陸
- バングラデシュ、インド、ネパール、パキスタン
- 他のアジア太平洋諸国
- オーストラリア、インドネシア、マレーシア、ニュージーランド、フィリピン、シンガポール、タイ、ベトナム
- アフリカ・中東
- アルジェリア、エジプト、イスラエル、ケニア、クウェート、ナイジェリア、カタール、サウジアラビア、南アフリカ、アラブ首長国連邦
- 北米
分析対象企業
- Juniper Research Competitor Leaderboardの対象企業: Abbott Laboratories、AMC Health、Biotronik、Boston Scientific、Dräger、GE HealthCare、Masimo、MedM、Medtronic、Omron Corporation、Orion Health、Philips、Qure4u、Roche、Vivalink
- 言及された企業: Acutronic、AFVD、AliveCor、Ascom、AWS、BiolntelliSense、Bionet、Bow Medical、Brainlab、Community Wellness、Doctor Anywhere、Dystonia Europe、EPDA、Luscii、Mazzetti、Partners HealthCare、Phoenix、Qualcomm、Samsung、Triton、University Hospitals、Verustat
目次
第1部 市場動向と戦略
第1章 重要ポイントと戦略提言
第2章 市場の将来展望
- イントロダクション
- 定義
- 沿革患者モニタリングで使用されるデバイス
- 遠隔患者モニタリングを推進する技術
- 遠隔患者モニタリングにおける人工知能
- 遠隔患者モニタリングの利点
- 遠隔患者モニタリングの欠点
- 遠隔患者モニタリングの促進要因
- 遠隔患者モニタリングの抑制要因
第3章 市場区分
- イントロダクション
- 心臓血管
- 心血管モニタリングに使用されるデバイスの種類
- 心血管疾患で使用される遠隔医療のその他の側面
- 心血管疾患におけるスマートウォッチの使用
- 求められる技術の変化と発展
- 現在までの導入
- 糖尿病
- 肥満症
- がん
- 妊婦
- 血圧計
- 胎児・新生児
第4章 地域分析
- イントロダクション
- 北米
- 米国
- カナダ
- ラテンアメリカ
- アルゼンチン
- ブラジル
- 西欧
- デンマーク
- フランス
- ドイツ
- 英国
- 中東欧
- ポーランド
- 極東・中国
- 中国
- 日本
- インド亜大陸
- インド
- 他のアジア太平洋諸国
- オーストラリア
- シンガポール
- アフリカ・中東
- サウジアラビア
- 南アフリカ
- 北米
第2部 競合リーダーボード
第1章 競合リーダーボードとベンダープロファイル
- 遠隔患者モニタリングベンダーのプロファイル
- Abbott Laboratories
- 企業
- 進出地域
- 主要なクライアントとパートナーシップ
- 主要製品/サービス
- JuniperResearchの見解:主な強みと戦略展開の機会
- AMC Health
- Biotronik
- Boston Scientific Corporation
- Drager
- Ge HealthCare
- Masimo
- MedM
- Medtronic
- Omron Corporation
- Orion Health
- Philips
- Qure4u
- Roche
- Vivalink
- Abbott Laboratories
- Juniper Research Leaderboardの分析手法
第3部 データと予測
第1章 イントロダクション・市場概要
第2章 予測の概要
- イントロダクション
- ユーザーと収益
- RPMユーザーの総数
- 使用中のRPMデバイスの総数
- RPMの総収益
- 各種デバイスからのRPMの収益
- RPMデバイスからの総収益
第3章 心臓モニタリング市場の予測
- イントロダクション
- 予測手法
- ユーザーと収益
- RPMを使用した心臓病患者の総数
- 心臓モニタリングに使用されるRPMデバイスの総数
第4章 糖尿病モニタリング市場の予測
- イントロダクション
- 予測手法
- ユーザーと収益
- RPMを使用している糖尿病患者の総数
- 糖尿病モニタリングに使用されるRPMデバイスの総数
第5章 腫瘍モニタリング市場の予測
- イントロダクション
- 予測手法
- ユーザーと収益
- RPMを使用したがん患者の総数
- 腫瘍モニタリングに使用されるRPMデバイスの総数
第6章 肥満モニタリング市場の予測
- イントロダクション
- 予測手法
- ユーザーと収益
- RPMを使用した肥満患者の総数
- 肥満モニタリングに使用されるRPMデバイスの総数
REPORT OVERVIEW
Juniper Research's “Remote Patient Monitoring” report provides a detailed evaluation of the market, including the adoption of remote patient monitoring within both developing markets and established markets. In addition, this report covers market opportunities; providing strategic insights into the technologies and key drivers that are pushing the space forward. This report analyses the role of 15 leading remote patient monitoring vendors across the market, evaluating them through a competitor leaderboard.
The research suite also contains a detailed dataset; providing forecasts for 60 countries across a number of different metrics, including the number of remote patient monitoring patients, number of remote patient monitoring devices split by device type, including ECG (Electrocardiogram), blood pressure INR (International Normalised Ratio) test, pulse oximeter, glucose monitor, Bluetooth scale and smartwatches, total spend on remote patient monitoring hardware and software and total remote patient monitoring revenue.
Key Market Statistics
| Market size in 2023: | $72bn |
| Market size in 2027: | $110bn |
| 2023 to 2027 growth: | 54% |
This research suite comprises of:
- Market Trends & Strategies (PDF)
- Competitor Leaderboard (PDF)
- Data & Forecasts (PDF & Excel)
- 12 Months' Access to harvest Online Data Platform
KEY FEATURES
- Market Dynamics: A strategic analysis of the major drivers, challenges, and innovations shaping the adoption and development of remote patient monitoring, including the following:
- COVID-19's impact on the remote patient monitoring market.
- Future strategic direction and market outlook for remote patient monitoring.
- Key drivers for remote patient monitoring vendors, including nurse shortages and healthcare system struggles.
- Regional Analysis: A regional-level analysis of 16 countries, spanning 8 key regions; covering the current deployment level and future outlook of remote patient monitoring. Giving readers insight into the markets with the best opportunities for remote patient monitoring.
- Benchmark Industry Forecasts: Includes forecasts for the total number of remote patient monitoring patients, number of remote patient monitoring devices, total spend on remote patient monitoring hardware and software and total remote patient monitoring revenue. This data is split by device type and our 8 key forecast regions and 60 countries:
- North America:
- Canada, US
- Latin America:
- Argentina, Brazil, Chile, Colombia, Ecuador, Mexico, Peru, Uruguay
- West Europe:
- Austria, Belgium, Denmark, Finland, France, Germany, Greece, Ireland, Italy, Netherlands, Norway, Portugal, Spain, Sweden, Switzerland, UK
- Central & East Europe:
- Croatia, Czech Republic, Hungary, Poland, Romania, Russia, Turkey, Ukraine
- Far East & China:
- China, Hong Kong, Japan, South Korea
- Indian Subcontinent:
- Bangladesh, India, Nepal, Pakistan
- Rest of Asia Pacific:
- Australia, Indonesia, Malaysia, New Zealand, Philippines, Singapore, Thailand, Vietnam
- Africa & Middle East:
- Algeria, Egypt, Israel, Kenya, Kuwait, Nigeria, Qatar, Saudi Arabia, South Africa, United Arab Emirates
- Juniper Research Competitor Leaderboard: Key player capability and capacity assessment for 15 remote patient monitoring vendors:
- Abbott Laboratories
- AMC Health
- Biotronik
- Boston Scientific Corporation
- Drager
- GE Healthcare
- Masimo
- MedM
- Medtronic
- Omron Corporation
- Orion Health
- Philips
- Qure4u
- Roche
- Vivalink
KEY QUESTIONS ANSWERED
- 1. How will key market trends affect projected remote patient monitoring adoption?
- 2. What technologies will accelerate remote patient monitoring?
- 3. Who are the leading vendors in the remote patient monitoring market?
- 4. What limitations are there holding back remote patient monitoring?
- 5. What regions will remote patient monitoring be most successful in?
COMPANIES REFERENCED
- Included in Juniper Research Competitor Leaderboard: Abbott Laboratories, AMC Health, Biotronik, Boston Scientific, Dräger, GE HealthCare, Masimo, MedM, Medtronic, Omron Corporation, Orion Health, Philips, Qure4u, Roche, Vivalink.
- Mentioned: Acutronic, AFVD, AliveCor, Ascom, AWS, BiolntelliSense, Bionet, Bow Medical, Brainlab, Community Wellness, Doctor Anywhere, Dystonia Europe, EPDA, Luscii, Mazzetti, Partners HealthCare, Phoenix, Qualcomm, Samsung, Triton, University Hospitals, Verustat.
DATA & INTERACTIVE FORECAST
Key Market Forecast Splits
- Device Type:
- ECG
- Blood Pressure INR Test
- Pulse Oximeter
- Glucose Monitor
- Bluetooth Scale
- Smartwatches
- Condition:
- Cardiac
- Diabetes
- Cancer
- Obesity
Metrics include the number of users leveraging remote patient monitoring, the number of devices in use for remote patient monitoring, total spend on remote patient monitoring software and hardware and total remote patient monitoring revenue.
- Geographical splits: 60 countries
- Number of tables: Over 205 tables
- Number of datapoints: Over 140,000 datapoints
harvest: Our online data platform, harvest, contains the very latest market data and is updated throughout the year. This is a fully featured platform enabling clients to better understand key data trends and manipulate charts and tables; overlaying different forecasts within the one chart - using the comparison tool. Empower your business with our market intelligence centre, and receive alerts whenever your data is updated.
Interactive Excels (IFxl): Our IFxl tool enables clients to manipulate both forecast data and charts, within an Excel environment, to test their own assumptions using the interactive scenario tool and compare selected markets side by side in customised charts and tables. IFxls greatly increase a client's ability to both understand a particular market and to integrate their own views into the model.
FORECAST SUMMARY
The total number of patients using RPM solutions will reach 115.5 million globally by 2027; equating to 1.4% of the total population. This is an increase from only 75 million in 2023. This growth of 67% is driven by greater pressure on healthcare systems, including clinical staff shortages and limited space within hospitals, driving the need for alternative healthcare solutions. RPM enables care to be moved outside of overstressed healthcare facilities; boosting healthcare providers' efficiency.
- By 2027, there will be 90 million cardiac patients using RPM solutions. Given the high global prevalence of cardiac conditions, the report recommended that healthcare providers use RPM solutions to monitor the heart rate and blood pressure of cardiac patients at home to lower the number of patients in hospital. RPM solutions will also indirectly decrease disease transmission rates and alleviate pressure on healthcare systems by reducing the demand for hospital beds.
- Healthcare service providers should fully leverage the data generated by the increase in adoption of RPM devices. To maximise the benefits, it recommended that RPM services fully incorporate AI within their solutions to enable healthcare professionals to improve the efficiency of medical triage processes through a predictive proactive healthcare provision model.
Table of Contents
1. Market Trends & Strategies
1. Key Takeaways & Strategic Recommendations
- 1.1. Key Takeaways & Strategic Recommendations
- 1.2. Strategic Recommendations
2. Future Market Outlook
- 2.1. Introduction
- Figure 2.1: Visualisation of Elements in eHealth
- 2.1.1. Definitions
- Figure 2.2: Diagram Displaying How Remote Patient Monitoring Works
- 2.1.2. Devices Used in Remote Patient Monitoring
- i. Blood Pressure Cuff
- ii. Glucose Monitoring
- Figure 2.3: Visualisation of Continuous Glucose Monitor
- iii. Electrocardiography Devices
- iv. Heart Rate Monitors
- v. Fall Detection
- vi. Smart Scales
- Figure 2.4: Visualisation of RPM Process Containing Devices Used
- 2.1.3. Technology Driving Remote Patient Monitoring
- i. Cellular RPM devices
- ii. Bluetooth Remote Patient Monitoring Devices
- 2.1.4. Artificial Intelligence in Remote Patient Monitoring
- 2.2. Benefits of Remote Patient Monitoring
- 2.2.1. Patient Benefits
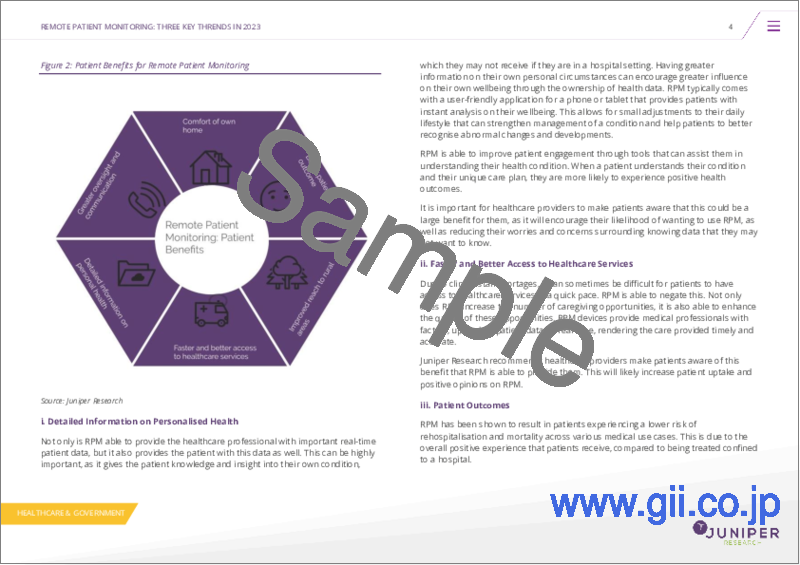
- Figure 2.5: Patient Benefits for Remote Patient Monitoring
- i. Detailed Information on Personalised Health
- ii. Faster and Better Access to Healthcare Services
- iii. Patient Outcomes
- iv. Comfort in Patients' Own Home
- v. Better Healthcare Opportunities in Rural Communities
- vi. Greater Oversight and Communications
- 2.2.2. Healthcare Professional and Provider Benefits
- Figure 2.6: Provider Benefits for Remote Patient Monitoring
- i. Improved Patient Outcomes
- ii. Lower Costs
- iii. Free Up Spaces in Hospitals
- iv. Reduced Risk of Disease Transmission
- v. Combats Clinical Staff Shortages and Optimises Operations
- vi. Improves Clinical Decision Making
- 2.2.1. Patient Benefits
- 2.3. Disadvantages within Remote Patient Monitoring
- 2.3.1. Disadvantages of Remote Patient Monitoring for Patients
- Figure 2.7: Patient Disadvantages for Remote Patient Monitoring
- i. Patient Isolation
- ii. Privacy
- iii. Requires Some Knowledge Surrounding Technology
- 2.3.2. Disadvantages of Remote Patient Monitoring for Healthcare Providers
- Figure 2.8: Provider Disadvantages for Remote Patient Monitoring
- i. Over-reliance on Data
- ii. Not Consistent Real-Time Monitoring
- iii. Error Rates of Existing RPM
- 2.3.1. Disadvantages of Remote Patient Monitoring for Patients
- 2.4. Drivers of Remote Patient Monitoring
- 2.5. Barriers to Remote Patient Monitoring
3. Market Segments
- 3.1. Introduction
- 3.2. Cardiovascular
- 3.2.1. Types of Devices Used for Cardiovascular Monitoring
- i. Blood Pressure Monitor
- ii. Anticoagulation Testing Devices
- Figure 3.1: Image Displaying a INR Testing Device
- iii. ECG devices
- Figure 3.2: Visualisation of the Kardia Mobile 6L App and Electrode
- iv. Pulse Oximetry
- 3.2.2. Other Aspects of Telemedicine Used in Cardiovascular Diseases
- 3.2.3. The Use of Smartwatches in Cardiovascular Diseases
- 3.2.4. Changes and Developments in Technology Required
- 3.2.5. Deployments to Date
- Figure 3.3: Total Number of Cardiac Patients Using Remote Patient Monitoring (m), Split by 8 Key Regions, 2022-2027
- 3.2.1. Types of Devices Used for Cardiovascular Monitoring
- 3.3. Diabetes
- 3.3.1. Types of Devices Used for Diabetes Monitoring
- i. Continuous Glucose Monitor
- Figure 3.4: Visualisation of Continuous Glucose Monitor
- ii. Smart Insulin Pen
- Figure 3.5: Visualisation of Smart Insulin Pen
- iii. Ketone Monitors
- i. Continuous Glucose Monitor
- 3.3.2. Other Aspects of Telemedicine Used in Diabetes
- Figure 3.6: Visualisation of Dexcom Clarity
- 3.3.3. The Use of Smartwatches in Diabetes
- 3.3.4. Changes and Developments in Technology Required
- 3.3.5. Deployments to Date
- Figure 3.7: Total Number of Diabetic Patients Using Remote Patient Monitoring (m), Split by 8 Key Regions, 2022-2027
- 3.3.1. Types of Devices Used for Diabetes Monitoring
- 3.4. Obesity
- 3.4.1. Types of Devices Used for Obesity Management
- i. Smart Scales
- Figure 3.8: Visualisation of Smart Scales
- ii. Blood Pressure Monitors
- i. Smart Scales
- 3.4.2. Other Aspects of Telemedicine in Obesity Monitoring
- 3.4.3. The Use of Smartwatches in Obesity Monitoring
- 3.4.4. Changes and Developments Required in Technology
- 3.4.5. Deployments to Date
- Figure 3.9: Total Number of Obesity Patients Using Remote Patient Monitoring (m), Split by 8 Key Regions, 2022-2027
- 3.4.1. Types of Devices Used for Obesity Management
- 3.5. Cancer
- 3.5.1. Types of Devices Used for Cancer Management
- i. Digital Thermometer
- Figure 3.10: Visualisation of TempTraq in Remote Patient Monitoring
- i. Digital Thermometer
- 3.5.2. Other Aspects of Telemedicine in Cancer Management
- 3.5.3. The Use of Smartwatches in Cancer Management
- 3.5.4. Changes and Developments Required in Technology
- 3.5.5. Deployments to Date
- Figure 3.11: Total Number of Cancer Patients Using Remote Patient Monitoring (m), Split by 8 Key Regions, 2022-2027
- 3.5.1. Types of Devices Used for Cancer Management
- 3.6. Maternity
- Table 3.12: Vital Sign Uses in Tracking Maternity Clinical Implications
- 3.6.1. Types of Devices Used for Maternity Management
- i. Blood Pressure Monitors
- 3.6.2. Other Aspects of Telemedicine in Maternity Management
- Figure 3.13: Telemedicine Uses Within Pregnancy
- 3.6.3. Use of Smartwatches in Maternity Management
- 3.6.4. Changes and Developments Required in Technology
- 3.6.5. Deployments to Date
- 3.7. Foetal and Neonatal
- 3.7.1. Types of Devices Used for Foetal and Neonatal Management
- 3.7.2. Other Aspects of Telemedicine in Foetal and Neonatal Management
- 3.7.3. The Use of Smartwatches in Foetal and Neonatal Management
- 3.7.4. Changes and Developments Required in Technology
- 3.7.5. Deployments to Date
4. Regional Analysis
- 4.1. Introduction
- 4.1.1. North America
- i. US
- Table 4.1: Key Health Metrics, 2020-2022 US
- ii. Canada
- Table 4.2: Key Health Metrics, 2020-2022 Canada
- i. US
- 4.1.2. Latin America
- i. Argentina
- Table 4.3: Key Health Metrics, Argentina, 2020-2022
- ii. Brazil
- Table 4.4: Key Health Metrics, 2020-2022, Brazil
- i. Argentina
- 4.1.3. West Europe
- i. Denmark
- Table 4.5: Key Health Metrics, 2020-2022, Denmark
- ii. France
- Table 4.6: Key Health Metrics, 2020-2022, France
- iii. Germany
- Table 4.7: Key Health Metrics, 2020-2022, Germany
- iv. UK
- Table 4.8: Key Health Metrics, 2020-2022, UK
- i. Denmark
- 4.1.4. Central & East Europe
- i. Poland
- Table 4.9: Key Health Metrics, 2020-2022, Poland
- i. Poland
- 4.1.5. Far East & China
- i. China
- Table 4.10: Key Health Metrics, 2020-2022, China
- ii. Japan
- Table 4.11: Key Health Metrics, 2020-2022, Japan
- i. China
- 4.1.6. Indian Subcontinent
- i. India
- Table 4.12: Key Health Metrics, 2020-2022, India
- i. India
- 4.1.7. Rest of Asia Pacific
- i. Australia
- Table 4.13: Key Health Metrics, 2020-2022, Australia
- ii. Singapore
- Table 4.14: Key Health Metrics, 2020-2022, Singapore
- i. Australia
- 4.1.8. Africa & Middle East
- i. Saudi Arabia
- Table 4.15: Key Health Metrics, 2020-2022, Saudi Arabia
- ii. South Africa
- Table 4.16: Key Health Metrics, 2020-2022, South Africa
- i. Saudi Arabia
- 4.1.1. North America
2. Competitor Leaderboard
1. Competitor Leaderboard & Vendor Profiles
- Table 1.1: Juniper Research Competitor Leaderboard: Remote Patient Monitoring Vendors Included & Product Portfolio
- Figure 1.2: Juniper Research Leaderboard: Remote Patient Monitoring Vendors
- Table 1.3: Juniper Research Leaderboard: Remote Patient Monitoring Vendors Positioning
- Table 1.4: Juniper Research Leaderboard Heatmap: Remote Patient Monitoring
- 1.1. Remote Patient Monitoring Vendor Profiles
- 1.1.1. Abbott Laboratories
- i. Corporate
- Table 1.5: Abbott Laboratories' Financial Snapshot ($b), FY 2019-2021 (FYE 31st December)
- ii. Geographic Spread
- iii. Key Clients & Strategic Partnerships
- iv. High-level View of Offerings
- Figure 1.6: Visualisation of the Abbott Laboratories' RPM Solution
- Figure 1.7: Visualisation of the LibreView Process
- v. Juniper Research's View: Key Strengths & Strategic Opportunities
- i. Corporate
- 1.1.2. AMC Health
- i. Corporate
- ii. Geographic Spread
- iii. Key Clients & Strategic Partnerships
- iv. High-level View of Offerings
- v. Juniper Research's View: Key Strengths & Strategic Opportunities
- 1.1.3. Biotronik
- i. Corporate
- ii. Geographic Spread
- iii. Key Clients & Strategic Partnerships
- iv. High-level View of Offerings
- Figure 1.8: Biotronik's Remote Patient Monitoring Solution
- v. Juniper Research's View: Key Strengths & Strategic Opportunities
- 1.1.4. Boston Scientific Corporation
- i. Corporate
- Table 1.9: Boston Scientific's Financial Snapshot ($b), FY 2019-2021
- ii. Geographic Spread
- iii. Key Clients & Strategic Partnerships
- iv. High-level View of Offerings
- Figure 1.10: Visualisation Showing Boston Scientific's Heart Connect System
- Figure 1.11: Visualisation of Boston Scientific's Latitude Programming System
- v. Juniper Research's View: Key Strengths & Strategic Opportunities
- i. Corporate
- 1.1.5. Drager
- i. Corporate
- Table 1.12: Dräger's Financial Snapshot ($b), FY 2020-2021
- ii. Geographic Spread
- iii. Key Clients & Strategic Partnerships
- iv. High-level View of Offerings
- Figure 1.13: Visualisation of Dräger's Infinity Gateway Suite
- v. Juniper Research's View: Key Strengths & Strategic Opportunities
- i. Corporate
- 1.1.6. Ge HealthCare
- i. Corporate
- Table 1.14: GE HealthCare's Financial Snapshot ($b), FY 2019-2021 (FYE 31st December)
- ii. Geographic Spread
- iii. Key Clients & Strategic Partnerships
- iv. High-level View of Offerings
- Figure 1.15: Visualisation of GE HealthCare's Mural Virtual Clinical Viewer
- v. Juniper Research's View: Key Strengths & Strategic Opportunities
- i. Corporate
- 1.1.7. Masimo
- i. Corporate
- Table 1.16: Masimo's Financial Snapshot ($m), FY2021-2022 (FYE 1st January)
- ii. Geographic Spread
- iii. Key Clients & Strategic Partnerships
- iv. High-level View of Offerings
- Figure 1.17: Visualisation of Replica Smart Patient Data Management
- v. Juniper Research's View: Key Strengths & Strategic Opportunities
- i. Corporate
- 1.1.8. MedM
- i. Corporate
- ii. Geographic Spread
- iii. Key Clients & Strategic Partnerships
- iv. High-level View of Offerings
- Figure 1.18: Visualisation of MedM RPM Software
- v. Juniper Research's View: Key Strengths & Strategic Opportunities
- 1.1.9. Medtronic
- i. Corporate
- ii. Geographic Spread
- iii. Key Clients & Strategic Partnerships
- iv. High-level View of Offerings
- Figure 1.19: Visualisation of Medtronic Remote Patient Monitoring
- v. Juniper Research's View: Key Strengths & Strategic Opportunities
- 1.1.10. Omron Corporation
- i. Corporate
- Table 1.20: Omron's Financial Snapshot ($m), FY2021-2022 (FYE 1st January)
- iii. Geographic Spread
- iii. Key Clients & Strategic Partnerships
- iv. High-level View of Offerings
- Figure 1.21: Visualisation of Omron VitalSight
- v. Juniper Research's View: Key Strengths & Strategic Opportunities
- i. Corporate
- 1.1.11. Orion Health
- i. Corporate
- Table 1.22: Orion Health's Financial Snapshot ($m), FY2020-2021 (FYE 31st December)
- ii. Geographic Spread
- iii. Key Clients & Strategic Partnerships
- iv. High-level View of Offerings
- v. Juniper Research's View: Key Strengths & Strategic Opportunities
- i. Corporate
- 1.1.12. Philips
- i. Corporate
- Table 1.23: Philips' Financial Snapshot ($b), FY 2019-2021 (FYE 31st December)
- ii. Geographic Spread
- iii. Key Clients & Strategic Partnerships
- iv. High-level View of Offerings
- Figure 1.24: Visualisation of Philip's Enterprise Telehealth Solutions
- v. Juniper Research's View: Key Strengths & Strategic Opportunities
- i. Corporate
- 1.1.13. Qure4u
- i. Corporate
- ii. Geographic Spread
- iii. Key Clients & Strategic Partnerships
- iv. High-level View of Offerings
- Figure 1.25: Visualisation of Qure4u's Remote Patient Monitoring Solution
- v. Juniper Research's View: Key Strengths & Strategic Opportunities
- 1.1.14. Roche
- i. Corporate
- Table 1.26: Roche's Financial Snapshot ($b), FY 2020-2021 (FYE 31st December)
- ii. Geographic Spread
- iii. Key Clients & Strategic Partnerships
- iv. High-level View of Offerings
- v. Juniper Research's View: Key Strengths & Strategic Opportunities
- i. Corporate
- 1.1.15. Vivalink
- i. Corporate
- ii. Geographic Spread
- iii. Key Clients & Strategic Partnerships
- iv. High-level View of Offerings
- Figure 1.27: Visualisation of Vivalink Wearable SP02 Sensor
- v. Juniper Research's View: Key Strengths & Strategic Opportunities
- 1.1.1. Abbott Laboratories
- 1.2. Juniper Research Leaderboard Assessment Methodology
- 1.2.1. Limitations & Interpretations
- Table 1.28: Juniper Research Competitor Leaderboard Scoring Criteria
- 1.2.1. Limitations & Interpretations
3. Data & Forecasting
1. Introduction & Market Summary
- 1.1. Introduction
- Figure 1.1: Visualisation of Elements in eHealth
- 1.1.1. Definitions
- Figure 1.2: Diagram Displaying how Remote Patient Monitoring Works
2. Forecast Summary
- 2.1. Introduction
- 2.2. Users & Revenue
- 2.2.1. Total Number of RPM Users
- Figure & Table 2.1: Total Number of RPM Users (m), Split by 8 Key Regions, 2022-2027
- 2.2.2. Total Number of RPM Devices in Use
- Figure & Table 2.2: Total Number of RPM Devices (m), Split by 8 Key Regions, 2022-2027
- 2.2.3. Total RPM Revenue
- Figure & Table 2.3: Total RPM Revenue ($m), Split by 8 Key Regions, 2022-2027
- 2.2.1. Total Number of RPM Users
- 2.3. RPM Revenue from Each Device
- 2.3.1. Total Revenue from RPM Devices
- We expect the total annual revenue from people using RPM to reach $110.3 billion in 2027, up from $71.7 billion in 2023; a CAGR of 13.18% across the forecast period.
- Figure & Table 2.4: Total Number of RPM devices, Split by 7 Devices, 2022-2027
- 2.3.1. Total Revenue from RPM Devices
3. Cardiac Monitoring Market Forecasts
- 3.1. Introduction
- 3.2. Forecast Methodology
- 3.2.1. Users & Revenue Forecast Methodology
- Figure 3.1: Cardiac Patient RPM Users & Devices Forecast Methodology
- 3.2.1. Users & Revenue Forecast Methodology
- 3.3. Users & Revenue
- 3.3.1. Total Number of Cardiac Patients using RPM
- Figure & Table 3.2: Total Number of Cardiac Patients using RPM (m), Split by 8 Key Regions, 2022-2027
- 3.3.2. Total Number of RPM Devices Used for Cardiac Monitoring
- Figure & Table 3.3: Total Number of RPM Devices Used for Cardiac Monitoring (m), Split by 8 Key Regions, 2022-2027
- 3.3.1. Total Number of Cardiac Patients using RPM
4. Diabetes Monitoring Market Forecasts
- 4.1. Introduction
- 4.2. Forecast Methodology
- 4.2.1. Users & Revenue Forecast Methodology
- Figure 4.1: Diabetic Patient RPM Users & Devices Forecast Methodology
- 4.2.1. Users & Revenue Forecast Methodology
- 4.3. Users & Revenue
- 4.3.1. Total Number of Diabetic Patients Using RPM
- Figure & Table 4.2: Total Number of Cardiac Patients Using RPM (m), Split by 8 Key Regions, 2022-2027
- 4.3.2. Total Number of RPM Devices Used for Diabetic Monitoring
- Figure & Table 4.3: Total Number of RPM Devices Used for Cardiac Monitoring (m), Split by 8 Key Regions, 2022-2027
- 4.3.1. Total Number of Diabetic Patients Using RPM
5. Oncology Monitoring Market Forecasts
- 5.1. Introduction
- 5.2. Forecast Methodology
- 5.2.1. Users & Revenue Forecast Methodology
- Figure 5.1: Cancer Patient RPM Users & Devices Forecast Methodology
- 5.2.1. Users & Revenue Forecast Methodology
- 5.3. Users & Revenue
- 5.3.1. Total Number of Cancer Patients Using RPM
- Figure & Table 5.2: Total Number of Cardiac Patients Using RPM (m), Split by 8 Key Regions, 2022-2027
- 5.3.2. Total Number of RPM Devices Used for Cancer Monitoring
- Figure & Table 5.3: Total Number of RPM Devices Used for Cardiac Monitoring (m), Split by 8 Key Regions, 2022-2027
- 5.3.1. Total Number of Cancer Patients Using RPM
6. Obesity Monitoring Market Forecasts
- 6.1. Introduction
- 6.2. Forecast Methodology
- 6.2.1. Users & Revenue Forecast Methodology
- Figure 6.1: Obesity Patient RPM Users & Devices Forecast Methodology
- 6.2.1. Users & Revenue Forecast Methodology
- 6.3. Users & Revenue
- 6.3.1. Total Number of Obesity Patients Using RPM
- Figure & Table 6.2: Total Number of Cardiac Patients Using RPM (m), Split by 8 Key Regions, 2022-2027
- 6.3.2. Total Number of RPM Devices Used for Obesity Monitoring
- Figure & Table 6.3: Total Number of RPM Devices Used for Cardiac Monitoring (m), Split by 8 Key Regions, 2022-2027
- 6.3.1. Total Number of Obesity Patients Using RPM