|
|
市場調査レポート
商品コード
1181123
コネクテッドカー:オペレーターの市場機会、競合リーダーボード、市場予測 (2023年~2027年)Connected Vehicles: Operator Opportunities, Competitor Leaderboard and Market Forecasts 2023-2027 |
||||||
|
|
|||||||


| コネクテッドカー:オペレーターの市場機会、競合リーダーボード、市場予測 (2023年~2027年) |
|
出版日: 2023年01月09日
発行: Juniper Research Ltd
ページ情報: 英文
納期: 即日から翌営業日
|
- 全表示
- 概要
- 目次
世界のコネクテッドカーの普及台数は、2023年の1億9,200万台から、2027年には3億6,700万台に達する見通しです。この成長の91%は、ADASと車載インフォテインメント・システムの両方で機能向上が進展することによってもたらされます。5Gの高速・低遅延の機能は、これらの目標に変革をもたらしますが、その実現には自動車メーカーと通信事業者の効果的なコラボレーションが必要となります。
当レポートでは、世界のコネクテッドカーの市場について分析し、システムの概略や普及状況、全体的な市場規模の動向見通し (今後5年間分)、部門別・地域別・業種別の詳細動向、市場の競争構造、今後の成長可能性と課題、主要企業のプロファイル (全20社) などを調査しております。
回答した主な質問
- 1. 車載用コネクティビティ市場の、今後5年間の市場規模の見通しは?
- 2. 車載用コネクティビティは、民生用と業務用でどのように使い分けられるのか?
- 3. 5Gは、コネクテッドカーの新たな使用事例 (自動運転など) をどのように開拓するのか?
- 4. この分野における主要なディスラプターは誰か?ベンダーはどのような戦略を取っているか?
- 5. 今後5年間に、この業界はどのように発展していくのか?
主な特徴
- ベンチマーク業界予測: 地域別 (全8地域)、国別 (全60ヶ国)
- 北米
- カナダ、米国
- ラテンアメリカ
- アルゼンチン、ブラジル、チリ、コロンビア、エクアドル、メキシコ、ペルー、ウルグアイ
- 西欧
- オーストリア、ベルギー、デンマーク、フィンランド、フランス、ドイツ、ギリシャ、アイルランド、イタリア、オランダ、ノルウェー、ポルトガル、スペイン、スウェーデン、スイス、英国
- 中東欧
- クロアチア、チェコ、ハンガリー、ポーランド、ルーマニア、ロシア、トルコ、ウクライナ
- 極東・中国
- 中国、香港、日本、韓国
- インド亜大陸
- バングラデシュ、インド、ネパール、パキスタン
- 他のアジア太平洋諸国
- オーストラリア、インドネシア、マレーシア、ニュージーランド、フィリピン、シンガポール、タイ、ベトナム
- アフリカ・中東
- アルジェリア、エジプト、イスラエル、ケニア、クウェート、ナイジェリア、カタール、サウジアラビア、南アフリカ、アラブ首長国連邦
- 北米
分析対象企業
- ケーススタディの対象企業: BMW、Deutsche Telekom、Honda、Orange、SoftBank Group
- Juniper Research Competitor Leaderboardの対象企業: ADLINK、Airbiquity、AT&T、Cisco、Ericsson、Giesecke+Devrient、Gosuncn、Hopechart IoT、Huawei、IBM、IDEMIA、KORE Wireless、KPIT Technologies、Mojio、Octo Telematics、Qualcomm、Thales、Verizon、Vodafone、WirelessCar
- 言及された企業: 500 Global、Accenture、Acorn Ventures、Admiral Insurance、Adobe、Alpine、ANSCENTER、Anthem、Apple、Arity、Assurant、Aston Martin、AT&T、Atos、Audi、AutoCore、AWS (Amazon Web Services)、Baidu、BBVA、BDC IT Venture Fund、Beiben Truck、Bell Telephone Company、Bentley、BlackRock、Blues Wireless、Bosch、BT、Cadillac、CAMC、Capgemini、China Telecom、ClearBlade、Cloudera、Cognizant、Continental、CVS、Cyngy、DB Schenker、Delphi、Denso、dSpace、Einride、Entrust Datacard、Esri、EVUM Motors、Ferrari、FirstNet、Ford、Fortinet、Foton Motor Group、Geely、Generation Ventures、GM、Google、Grab、Groupama、Hazelcast、HDI、Hitachi、Honeywell、Housecall Pro、HP、HSBC、Hyundai、Ignition Partners、Infiniti、InfluxDB、Innogy Ventures、Integron、Intel、Iris Capital、ITRI、JAC Motors、Jaguar、JCB、KasperskyOS、Kepware、Korea Telecom、LaFarge、Lamborghini、Land Rover、Lexus、LG、Lynk & CO、Maserati、MediaTek、Mercedes、Microsoft Azure、Motorola、MySQL、Napa Transport、National Grid、Nebula Systems、Nissan、Nokia、NVIDIA、NXP、O2、OnStar、ORIX Ventures、Palo Alto Networks、Pamplona Capital Management、PAS Groupe、Pepsi、Costco、Ping Identity、Pod Group、Porsche、PrismTech、PUMA、Qantas、Quortus、RacoWireless、Red Hat、Relay Ventures、Renault、Renesans、Renova Group、RoboSense LIDAR、SAFERIDE Technologies、Samsung、Sany、SAS、Scania、Scania、Seat、Shaanxi Automobile Tianjian、Shell、Shell Internet Ventures B.V.、Sichuan Hyundai、Siemens、SIMON IoT、SinoTruck、Skoda、Société Générale、SOMIT Solutions、Sprint、ST (STMicroelectronics)、Stellantis、Subaru、Technica Engineering、Telecom Consulting Group、Telefónica、Telia、Telstra、Telus Ventures、Tencent Cloud、Teraki、Tesla、The National Gallery、Three、Tier IV、T-Mobile、Toyota、Trend Forward Capital、TrendMicro、Uptane、Vivint、VMware、Volkswagen Group、Volta Trucks、Volvo、WeRide、WEY、Wind River、Wipro、WTG、Wyless、YESWAY、ZEV Auto Group
目次
第1章 重要ポイントと戦略提言
第2章 コネクテッドビークル-市場情勢
- イントロダクション
- さまざまな接続技術
- 5G
- エッジコンピューティング
- eSIM (組み込みSIM) /iSIM (統合SIM)
- V2X
- 採用の主な要因
- コネクテッドカーソリューションの採用に伴う課題
第3章 コネクテッドビークル- オペレーターの視点
- イントロダクション
- コネクテッドカー市場におけるオペレーターの役割
- オペレーターの将来の機会
- 5Gの展開
- コネクティビティ管理とOTT (Over-the-Top) サービスの開発のためのMNO-OEMパートナーシップ
- IoTおよびエッジコンピューティングのプロビジョニングとデータ管理
- コネクテッドエコノミーにおける新たな機会
第4章 コネクテッドカーベンダージュニパー調査競合のリーダーボードとベンダープロファイル
- このレポートを読む理由
- ベンダープロファイル
- ADLINK
- 企業
- 進出地域
- 主要顧客と戦略的パートナーシップ
- 主要製品/サービス
- JuniperResearchの見解:戦略的提言と主要な機会
- Airbiquity
- AT&T
- Cisco
- Ericsson
- Giesecke+Devrient
- Gosuncn
- Hopechart IoT
- Huawei
- IBM
- IDEMIA
- KORE Wireless
- KPIT Technologies
- Mojio
- OCTO Telematics
- Qualcomm
- Thales
- Verizon
- Vodafone
- WirelessCar
- ADLINK
- Juniper Research Leaderboardの分析手法
- 制限と解釈
第5章 コネクテッドカー市場の予測
- 予測手法:概要
- 価格モデルの前提
- コネクテッドカー市場の予測
- コネクテッドカーの総数
- 自動車コネクティビティの請求収益総額
- 5Gコネクテッドカー市場の予測
- 5Gコネクテッドカーの総数
- 5G自動車コネクティビティの請求収益総額
Juniper Research's new “Connected Vehicles” research report provides an independent analysis of the future evolution of this fast-paced market and advanced connectivity solutions within the automotive industry. It provides a comprehensive study of the increase in constant connectivity technology features in cars being adopted by automotive original equipment manufacturers, how the rise of 5G is impacting the connected cars market expansion, and the key role mobile network operators have in driving the market forward in order to offer advanced connectivity and an enhanced driving experience.
The connected car technologies research also analyses a wide range of other new developments and technological advancements and key trends in this highly important market. The connected vehicle services report presents comprehensive market forecasts; with major factors that include extensive insights into how many connected vehicles are in service, how many of them use 5G, which are consumer and commercial vehicles, data usage by these vehicles, and the revenue associated with providing this connectivity for operators.
The connected services market size report positions 20 key market players in the Juniper Research Competitor Leaderboard; providing an invaluable resource for stakeholders seeking to understand the demand for advanced features and connectivity solutions, the increase in demand, and the competitive landscape in the market.
This connected car market growth research suite comprises:
- Strategy & Forecasts (PDF)
- 5-year Market Sizing & Forecast Spreadsheet (Excel)
- 12 Months' Access to harvest Online Data Platform
Key Market Statistics
| Market size in 2023: | 367 million vehicles in service |
| Market size in 2027: | 367 million vehicles in service |
| 2023 - 2027 Market Growth: | 91% |
KEY FEATURES
- Market Dynamics: Provides a detailed assessment of market drivers and the key market trends within the connected vehicles' market share, as well as an in-depth evaluation of the economic growth of its future development and readiness for further disruption.
- Mobile Network Operators Opportunity Market Analysis: Analysis of how the operators will gain from the growth and improvement of advanced in-vehicle connectivity and real-time data, presenting their key opportunities in the connected car industry.
- Juniper Research Competitor Leaderboard: Key player capability and capacity assessment for 20 connected vehicle management platform providers; positioning them as either established leaders, leading challengers, or disruptors and challengers. Our Competitor Leaderboard scores these companies on their size of operations in the connected vehicles space, their extent and breadth of market partnerships, the sophistication of their platforms and Juniper Research's view on each company's innovation and future business prospects. The company profiles included in Juniper Research's Connected Vehicles Competitor Leaderboard are the following major players:
- ADLINK
- Airbiquity
- AT&T
- Cisco
- Ericsson
- Giesecke+Devrient
- Gosuncn
- Hopechart
- Huawei
- IBM
- IDEMIA
- KORE Wireless
- KPIT Technologies
- Mojio
- Octo Telematics
- Qualcomm
- Thales
- Verizon
- Vodafone
- WirelessCar
- Benchmark Industry Forecasts: 5-year forecasts for the connected vehicles market, including the number of vehicles with embedded connectivity, revenue for operators and data usage, split by total and 5G, as well as by consumer vehicles versus commercial vehicles. Data is also split by our 8 key regions and the 60 countries listed below:
- North America:
- Canada, US
- Latin America:
- Argentina, Brazil, Chile, Colombia, Ecuador, Mexico, Peru, Uruguay
- West Europe:
- Austria, Belgium, Denmark, Finland, France, Germany, Greece, Ireland, Italy, Netherlands, Norway, Portugal, Spain, Sweden, Switzerland, UK
- Central & East Europe:
- Croatia, Czech Republic, Hungary, Poland, Romania, Russia, Turkey, Ukraine
- Far East & China:
- China, Hong Kong, Japan, South Korea
- Indian Subcontinent:
- Bangladesh, India, Nepal, Pakistan
- Rest of Asia Pacific:
- Australia, Indonesia, Malaysia, New Zealand, Philippines, Singapore, Thailand, Vietnam
- Africa & Middle East:
- Algeria, Egypt, Israel, Kenya, Kuwait, Nigeria, Qatar, Saudi Arabia, South Africa, United Arab Emirates
KEY QUESTIONS ANSWERED
- 1. What is the anticipated market size for in-vehicle connectivity over the next 5 years?
- 2. How will in-vehicle connectivity use differ between consumer and commercial applications?
- 3. How will 5G unlock new use cases within connected vehicles, including autonomous driving?
- 4. Who are the key disruptors in this space, and what strategies are vendors employing?
- 5. How is the industry expected to develop over the next 5 years?
COMPANIES REFERENCED
- Case Studied: BMW, Deutsche Telekom, Honda, Orange, SoftBank Group.
- Included in the Juniper Research Competitor Leaderboard: ADLINK, Airbiquity, AT&T, Cisco, Ericsson, Giesecke+Devrient, Gosuncn, Hopechart IoT, Huawei, IBM, IDEMIA, KORE Wireless, KPIT Technologies, Mojio, Octo Telematics, Qualcomm, Thales, Verizon, Vodafone, WirelessCar.
- Mentioned: 500 Global, Accenture, Acorn Ventures, Admiral Insurance, Adobe, Alpine, ANSCENTER, Anthem, Apple, Arity, Assurant, Aston Martin, AT&T, Atos, Audi, AutoCore, AWS (Amazon Web Services), Baidu, BBVA, BDC IT Venture Fund, Beiben Truck, Bell Telephone Company, Bentley, BlackRock, Blues Wireless, Bosch, BT, Cadillac, CAMC, Capgemini, China Telecom, ClearBlade, Cloudera, Cognizant, Continental, CVS, Cyngy, DB Schenker, Delphi, Denso, dSpace, Einride, Entrust Datacard, Esri, EVUM Motors, Ferrari, FirstNet, Ford, Fortinet, Foton Motor Group, Geely, Generation Ventures, GM, Google, Grab, Groupama, Hazelcast, HDI, Hitachi, Honeywell, Housecall Pro, HP, HSBC, Hyundai, Ignition Partners, Infiniti, InfluxDB, Innogy Ventures, Integron, Intel, Iris Capital, ITRI, JAC Motors, Jaguar, JCB, KasperskyOS, Kepware, Korea Telecom, LaFarge, Lamborghini, Land Rover, Lexus, LG, Lynk & CO, Maserati, MediaTek, Mercedes, Microsoft Azure, Motorola, MySQL, Napa Transport, National Grid, Nebula Systems, Nissan, Nokia, NVIDIA, NXP, O2, OnStar, ORIX Ventures, Palo Alto Networks, Pamplona Capital Management, PAS Groupe, Pepsi, Costco, Ping Identity, Pod Group, Porsche, PrismTech, PUMA, Qantas, Quortus, RacoWireless, Red Hat, Relay Ventures, Renault, Renesans, Renova Group, RoboSense LIDAR, SAFERIDE Technologies, Samsung, Sany, SAS, Scania, Scania, Seat, Shaanxi Automobile Tianjian, Shell, Shell Internet Ventures B.V., Sichuan Hyundai, Siemens, SIMON IoT, SinoTruck, Skoda, Société Générale, SOMIT Solutions, Sprint, ST (STMicroelectronics), Stellantis, Subaru, Technica Engineering, Telecom Consulting Group, Telefónica, Telia, Telstra, Telus Ventures, Tencent Cloud, Teraki, Tesla, The National Gallery, Three, Tier IV, T-Mobile, Toyota, Trend Forward Capital, TrendMicro, Uptane, Vivint, VMware, Volkswagen Group, Volta Trucks, Volvo, WeRide, WEY, Wind River, Wipro, WTG, Wyless, YESWAY, ZEV Auto Group.
DATA & INTERACTIVE FORECAST
The “Connected Vehicles” data includes 5-year forecasts for the connected vehicles market, including the number of vehicles with embedded connectivity, revenue for operators and data usage, split by total and 5G, as well as by consumer vehicles versus commercial vehicles.
- Geographical splits: 60 countries
- Number of tables: 47 tables
- Number of datapoints: Over 19,600 datapoints
harvest: Our online data platform, harvest, contains the very latest market data and is updated throughout the year. This is a fully featured platform; enabling clients to better understand key data trends and manipulate charts and tables; overlaying different forecasts within the one chart - using the comparison tool. Empower your business with our market intelligence centre, and get alerted whenever your data is updated.
Interactive Excels (IFxl): Our IFxl tool enables clients to manipulate both forecast data and charts, within an Excel environment, to test their own assumptions using the interactive scenario tool and compare selected markets side by side in customised charts and tables. IFxls greatly increase a clients' ability to both understand a particular market and to integrate their own views into the model.
FORECAST SUMMARY
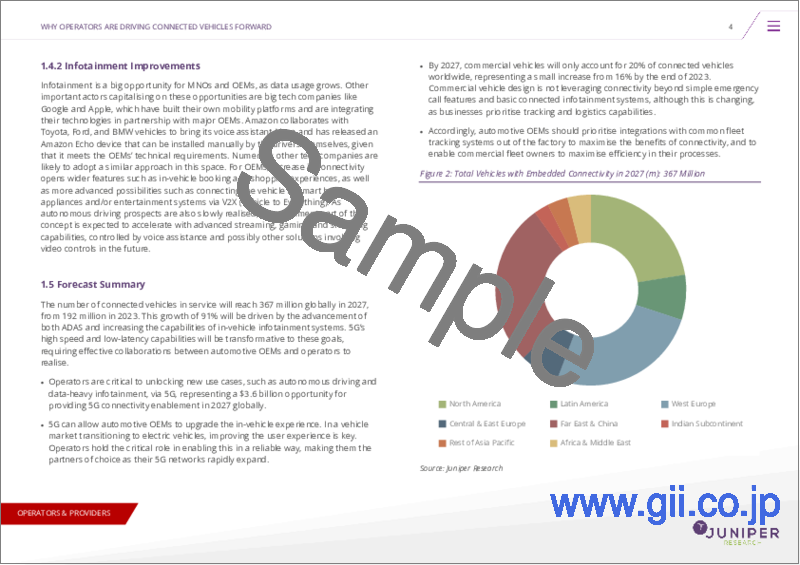
The number of connected vehicles in service will reach 367 million globally in 2027, from 192 million in 2023. This growth of 91% will be driven by the advancement of both ADAS and increasing the capabilities of in-vehicle infotainment systems. 5G's high speed and low-latency capabilities will be transformative to these goals, requiring effective collaborations between automotive OEMs and operators to realise.
- Operators are critical to unlocking new use cases, such as autonomous driving and data-heavy infotainment, via 5G, representing a $3.6 billion opportunity for providing 5G connectivity enablement in 2027 globally.
- 5G can allow automotive OEMs to upgrade the in-vehicle experience. In a vehicle market transitioning to electric vehicles, improving the user experience is key. Operators hold the critical role in enabling this in a reliable way, making them the partners of choice as their 5G networks rapidly expand.
- By 2027, commercial vehicles will only account for 20% of connected vehicles worldwide, representing a small increase from 16% by the end of 2023. Commercial vehicle design is not leveraging connectivity beyond simple emergency call features and basic connected infotainment systems, although this is changing, as businesses prioritise tracking and logistics capabilities.
- Accordingly, automotive OEMs should prioritise integrations with common fleet tracking systems out of the factory to maximise the benefits of connectivity, and to enable commercial fleet owners to maximise efficiency in their processes.
Table of Contents
1. Key Takeaways & Strategic Recommendations
- 1.1. Key Takeaways
- 1.2. Strategic Recommendations
2. Connected Vehicles - Market Landscape
- 2.1. Introduction
- 2.2. Different Connectivity Technologies
- 2.2.1. 5G
- Figure 2.1: 4G-5G Comparison
- 2.2.2. Edge Computing
- 2.2.3. eSIMs (Embedded SIMs)/iSIMs (Integrated SIMs)
- Figure 2.2: IDEMIA Connectivity Manager
- 2.2.4. V2X
- Figure 2.3: V2X Elements
- 2.2.1. 5G
- 2.3. Key Drivers for Adoption
- 2.4. Challenges with Adopting Connected Vehicle Solutions
3. Connected Vehicles - The Operator's View
- 3.1. Introduction
- 3.2. Operator Roles within the Connected Vehicles Market
- 3.3. Future Opportunities for Operators
- 3.3.1. 5G Roll-outs
- Figure 3.1: Reducing Collisions Involving Pedestrians by Sharing Information About Areas Not Visible to Vehicles
- 3.3.2. MNO-OEM Partnership for Connectivity Management and Developing OTT (Over-the-Top) Services
- 3.3.3. IoT and Edge Computing Provisioning and Data Management
- 3.3.4. New Opportunities in the Connected Economy
- 3.3.1. 5G Roll-outs
4. Connected Vehicle Vendors Juniper Research Competitor Leaderboard & Vendor Profiles
- 4.1. Why Read This Report?
- Table 4.1: Juniper Research Competitor Leaderboard: Connected Vehicles Vendors Included & Product Portfolio
- Figure 4.2: Juniper Research Competitor Leaderboard for Connected Vehicles Vendors
- Table 4.3: Juniper Research Competitor Leaderboard: Connected Vehicles Vendors & Positioning
- Table 4.4: Juniper Research Competitive Leaderboard Heatmap: Connected Vehicles Vendors
- Table 4.5: Juniper Research Competitive Leaderboard Heatmap: Connected Vehicles Vendors - Continued
- 4.2. Vendor Profiles
- 4.2.1. ADLINK
- i. Corporate
- Table 4.6: ADLINK's Financial Performance Snapshot (USD $m), 2018-2021
- ii. Geographical Spread
- iii. Key Clients and Strategic Partnerships
- iv. High-level View of Offerings
- v. Juniper Research's View: Strategic Recommendations & Key Opportunities
- i. Corporate
- 4.2.2. Airbiquity
- i. Corporate
- ii. Geographical Spread
- iii. Key Clients & Strategic Partnerships
- iv. High-level View of Offerings
- v. Juniper Research's Strategic Recommendations and Key Opportunities
- 4.2.3. AT&T
- i. Corporate
- Table 4.7: AT&T's Financial Performance Snapshot (USD $bn), 2018-2021
- ii. Geographical Spread
- iii. Key Clients & Strategic Partnerships
- iv. High-level View of Offerings
- v. Juniper Research's View: Strategic Recommendations & Key Opportunities
- i. Corporate
- 4.2.4. Cisco
- i. Corporate
- Table 4.8: Cisco's Financial Performance Snapshot (USD $bn), 2019-2022 (FYE, 30 July)
- ii. Geographical Spread
- iii. Key Clients & Strategic Partnerships
- iv. High-level View of Offerings
- Figure 4.9: Cisco Crosswork Network Automation
- v. Juniper Research's View: Strategic Recommendations & Key Opportunities
- i. Corporate
- 4.2.5. Ericsson
- i. Corporate
- Table 4.10: Ericsson's Financial Performance Snapshot (USD $bn), 2018-2021
- ii. Geographical Spread
- iii. Key Clients & Strategic Partnerships
- iv. High-level View of Offerings
- v. Juniper Research's View: Strategic Recommendations & Key Opportunities
- i. Corporate
- 4.2.6. Giesecke+Devrient
- i. Corporate
- Table 4.11: G+D's Financial Performance Snapshot (€m), 2018-2021, FYE December 31st
- ii. Geographical Spread
- iii. Key Clients & Strategic Partnerships
- iv. High-level View of Offerings
- Figure 4.12: DSDA and eSIMs
- v. Juniper Research's View: Strategic Recommendations & Key Opportunities
- i. Corporate
- 4.2.7. Gosuncn
- i. Corporate
- Table 4.13: Gosuncn's Financial Performance Snapshot ($m), 2018-2021
- ii. Geographical Spread
- iii. Key Clients & Strategic Partnerships
- iv. High-level View of Offerings
- v. Juniper Research's View: Strategic Recommendations & Key Opportunities
- i. Corporate
- 4.2.8. Hopechart IoT
- i. Corporate
- Table 4.14: Hopechart IoT's Financial Performance Snapshot ($m), 2018-2021
- ii. Geographical Spread
- iii. Key Clients & Strategic Partnerships
- iv. High-level View of Offerings
- Figure 4.15: Hopechart's New Energy Solution Monitoring Dashboard
- v. Juniper Research's View: Strategic Recommendations & Key Opportunities
- i. Corporate
- 4.2.9. Huawei
- i. Corporate
- Table 4.16: Huawei's Financial Performance Snapshot ($bn) 2018-2021
- ii. Geographical Spread
- iii. Key Clients & Strategic Partnerships
- iv. High-level View of Offerings
- Figure 4.17: Huawei's Connected Car Platform
- v. Juniper Research's View: Strategic Recommendations & Key Opportunities
- i. Corporate
- 4.2.10. IBM
- i. Corporate
- Table 4.18: IBM's Financial Performance Snapshot ($bn), 2018-2021
- ii. Geographical Spread
- iii. Key Clients & Strategic Partnerships
- iv. High-Level View of Offerings
- v. Juniper Research's View: Strategic Recommendations & Key Opportunities
- i. Corporate
- 4.2.11. IDEMIA
- i. Corporate
- ii. Geographical Spread
- iii. Key Clients & Strategic Partnerships
- iv. High-level View of Offerings
- Figure 4.19: IDEMIA DAKOTA Auto Consumer
- v. Juniper Research's View: Strategic Recommendations & Key Opportunities
- 4.2.12. KORE Wireless
- i. Corporate
- Table 4.20: KORE's Financial Performance Snapshot ($m), 2020-2021
- ii. Geographical Spread
- iii. Key Clients & Strategic Partnerships
- iv. High-level View of Offerings
- v. Juniper Research's View: Strategic Recommendations & Key Opportunities
- i. Corporate
- 4.2.13. KPIT Technologies
- i. Corporate
- Table 4.21: KPIT's Financial Performance Snapshot ($m), 2019-2022
- ii. Geographical Spread
- iii. Key Clients & Strategic Partnerships
- iv. High-level View of Offerings
- v. Juniper Research's View: Strategic Recommendations & Key Opportunities
- i. Corporate
- 4.2.14. Mojio
- i. Corporate
- ii. Geographical Spread
- iii. Key Clients & Strategic Partnerships
- iv. High-level View of Offerings
- v. Juniper Research's View: Strategic Recommendations & Key Opportunities
- 4.2.15. OCTO Telematics
- i. Corporate
- ii. Geographical Spread
- iii. Key Clients and Strategic Partnerships
- iv. High-level View of Offerings
- v. Juniper Research's View: Strategic Recommendations & Key Opportunities
- 4.2.16. Qualcomm
- i. Corporate
- Table 4.22: Qualcomm's Financial Performance Snapshot ($bn), 2019-2022
- ii. Geographical Spread
- iii. Key Clients & Strategic Partnerships
- iv. High-level View of Offerings
- v. Juniper Research's View: Strategic Recommendations & Key Opportunities
- i. Corporate
- 4.2.17. Thales
- i. Corporate
- Table 4.23: Thales' Financial Performance Snapshot (€m), 2018-2021
- ii. Geographical Spread
- iii. Key Clients & Strategic Partnerships
- iv. High-level View of Offerings
- v. Juniper Research's View: Strategic Recommendations & Key Opportunities
- i. Corporate
- 4.2.18. Verizon
- i. Corporate
- Table 4.24: Verizon Financial Performance Snapshot ($bn), 2018-2021
- ii. Geographical Spread
- iii. Key Clients & Strategic Partnerships
- iv. High-Level View of Offerings
- v. Juniper Research's View: Strategic Recommendations & Key Opportunities
- i. Corporate
- 4.2.19. Vodafone
- i. Corporate
- Table 4.25: Vodafone;s Financial Performance Snapshot (€bn), 2019-2022
- ii. Geographical Spread
- iii. Key Clients & Strategic Partnerships
- iv. High-level View of Offerings
- v. Juniper Research's View: Strategic Recommendations & Key Opportunities
- i. Corporate
- 4.2.20. WirelessCar
- i. Corporate
- ii. Geographical Spread
- iii. Key Clients & Strategic Partnerships
- iv. High-level View of Offerings
- Figure 4.26: Connected Car Essentials Data Flow
- v. Juniper Research's View: Strategic Recommendations & Key Opportunities
- 4.2.1. ADLINK
- 4.3. Juniper Research Competitor Leaderboard Assessment Methodology
- 4.4. Limitations & Interpretation
- Table 4.27: Juniper Research Competitor Leaderboard Scoring Criteria - Connected Vehicles
5. Connected Vehicles Market Forecasts
- 5.1. Forecast Methodology Overview
- 5.1.1. Pricing Model Assumptions
- Figure 5.1: Operator 5G Automotive Market Forecast Methodology
- 5.1.1. Pricing Model Assumptions
- 5.2. Connected Vehicle Forecasts
- 5.2.1. Total Connected Vehicles
- Figure & Table 5.2: Total Connected Vehicles (m), Year End, Split by 8 Key Regions, 2022-2027
- Table 5.3: Total Connected Vehicles (m), Year End, Split by Segment, 2022-2027
- 5.2.2. Total Operator-billed Automotive Connectivity Revenue
- Figure & Table 5.4: Total Operator-billed Revenue for Automotive Connectivity Enablement ($m), Split by 8 Key Regions, 2022-2027
- Table 5.5: Total Operator-billed Revenue for Automotive Connectivity Enablement ($m), Split by Segment, 2022-2027
- 5.2.1. Total Connected Vehicles
- 5.3. 5G Connected Vehicle Forecasts
- 5.3.1. Total 5G Connected Vehicles
- Figure & Table 5.6: Total Consumer Vehicles That Are Connected by 5G (m), Year End, Split by 8 Key Regions, 2022-2027
- Table 5.7: Total Consumer Vehicles that are Connected by 5G (m), Year End, Split by Segment, 2022-2027
- 5.3.2. Total Operator-billed 5G Automotive Connectivity Revenue
- Figure & Table 5.8: Total Operator-billed Revenue for 5G Automotive Connectivity Enablement ($m), Split by 8 Key Regions, 2022-2027
- Table 5.9: Total Operator-billed Revenue for 5G Automotive Connectivity Enablement ($m), Split by Segment, 2022-2027
- 5.3.1. Total 5G Connected Vehicles