|
|
市場調査レポート
商品コード
1864152
太陽光封止材市場:材料タイプ別、技術別、設置タイプ別、最終用途別- 世界予測2025-2032年Solar Encapsulation Market by Material Type, Technology, Installation Type, End-Use - Global Forecast 2025-2032 |
||||||
|
|||||||
カスタマイズ可能
適宜更新あり
|
|||||||

| 太陽光封止材市場:材料タイプ別、技術別、設置タイプ別、最終用途別- 世界予測2025-2032年 |
|
出版日: 2025年09月30日
発行: 360iResearch
ページ情報: 英文 196 Pages
納期: 即日から翌営業日
|

概要
太陽電池封止材市場は、2032年までにCAGR8.05%で108億2,000万米ドル規模に成長すると予測されております。
| 主な市場の統計 | |
|---|---|
| 基準年2024 | 58億2,000万米ドル |
| 推定年2025 | 62億6,000万米ドル |
| 予測年2032 | 108億2,000万米ドル |
| CAGR(%) | 8.05% |
材料科学、製造技術、そして太陽光発電システムの長期性能を結びつける戦略的接点としての太陽電池封止材の重要性を示す説得力のある導入部
太陽光発電システムの耐久性、信頼性、およびライフサイクル全体の性能を決定づける重要な要素として、太陽電池封止技術が台頭してまいりました。過去10年間で、高分子化学、積層技術、診断試験の進歩により、封止材は単なる二次的な構成要素から、システムの保証期間と金融適格性を支える戦略的基盤へと格上げされました。封止材は光学特性、機械的特性、耐環境性の境界領域で機能し、セルを湿気侵入、機械的ストレス、紫外線放射、温度による劣化から保護すると同時に、光学透明度と屈折率マッチングを通じてモジュールの発電出力に影響を与えます。
有効素子の保護に加え、封止材の選択は現在、製造性、サプライチェーンの回復力、および廃棄時の考慮事項に直接影響を及ぼします。スループット、歩留まり、長期信頼性のバランスを取るメーカーは、材料コスト、加工の複雑さ、実証済みの現場性能の間のトレードオフをますます評価しています。同時に、システム所有者や資金提供者は保証性能と劣化経路を精査し、より耐久性の高い化学組成や検証済みの加速試験プロトコルの需要を促進しています。このように、封止材はもはや受動的な商品投入物ではなく、工場現場から大規模発電所運用、リサイクル工程に至る製品ライフサイクル全体に測定可能な影響を及ぼす設計変数なのです。
本イントロダクションは、後続の分析における中核的前提を確立します:封止技術は技術的実現手段であると同時に戦略的レバレッジでもあるということです。機械的・熱的・光化学的ストレスの複合環境下における材料挙動の理解、それらの知見と製造制約の統合、設置形態や最終用途に応じた選択の整合性は、健全な意思決定に不可欠です。本エグゼクティブサマリーの残りの部分では、急速に進化する情勢に対応するリーダー向けに、新たな構造的変化、規制の影響、セグメンテーションに基づく洞察、地域的考慮事項、サプライヤーの動向、実践的な提言を明確に示します。
太陽光発電バリューチェーン全体における封止システムへの要求を再定義する、変革的な技術・サプライチェーン・持続可能性の変遷に関する権威ある総合分析
太陽光封止の情勢は、技術的・規制的・商業的要因が相まって変革的な変化を経験しています。次世代ポリマーや多層システムによる黄変、剥離、酢酸生成といった劣化メカニズムの低減など、材料革新が加速しています。これらの革新は単独ではなく、非破壊イメージングや分析といったインライン品質管理技術の進歩と連動しており、メーカーは接合問題を早期に検知し、現場での故障を削減できます。その結果、従来コストと信頼性の間で生じていたトレードオフが、コストの直線的な上昇を伴わずに高い信頼性を実現する技術によって再定義されつつあります。
同時に、システムレベルの圧力により製品要件も変化しています。大型化・高出力化モジュール、両面受光設計、フレキシブルや建築物一体型太陽光発電を含む非標準形状は、封止材システムに新たな機械的・光学的制約を課しています。封止材は現在、より高い機械的負荷、広範な温度範囲、より厳しい光学性能基準のもとで機能することが求められています。こうした最終用途の圧力により、サプライヤーは弾性率プロファイルの改善、紫外線安定性の強化、特注屈折率特性を備えた化学組成の開発を迫られています。
サプライチェーンのレジリエンスは戦略的優先事項となりました。原材料供給の多様化、重要ラミネート生産能力の国内回帰、主要ポリマー前駆体サプライヤーの厳格な選定基準が調達戦略を変容させています。さらに、リサイクル可能性、低炭素化、有害分解生成物の回避といった持続可能性への配慮が、材料選定と研究開発投資に影響を与えています。規制当局や大規模バイヤーはライフサイクル属性を重視する傾向が強まっており、長寿命設計と責任ある廃棄物処理を前提とした封止システムを評価する購買基準が生まれています。これらの変化が相まって、バリューチェーン全体で製品ロードマップや商業交渉の在り方が再構築されつつあります。
米国における最近の関税措置が、封止サプライチェーン全体でサプライヤー戦略、調達リスク管理、垂直統合の意思決定をどのように再構築したかについての詳細な考察
2025年に米国で導入された高水準の関税措置は、部品調達、サプライヤー戦略、契約上のリスク配分において顕著な波及効果を生み出しました。関税措置により、モジュール組立業者や統合業者は調達地域の再評価を迫られ、代替サプライヤーの認定を加速させています。この再評価は、サプライヤーの集中化が脆弱性の単一化点を生み出していた上流材料や中間製品において特に顕著です。その結果、多くのバイヤーは、性能保証や供給条件に紐づく品質欠陥に対するより明確な責任を盛り込んだ、デュアルソーシング戦略と長期購入契約を優先するようになりました。
金融関係者や大規模プロジェクト開発者は、封止材の原料調達先と関連加工基準に関するデューデリジェンスを強化することで対応しています。関税はベンダーのコスト構造に影響するため、一部のサプライヤーはマージン圧力を緩和すべく、業務効率化、垂直統合、地域別製造拠点の拡大を追求しています。こうした業務対応は、リードタイム、試験の一貫性、材料のトレーサビリティに影響を及ぼします。プロジェクトの利害関係者は現在、材料代替に伴う劣化加速から保護するため、拡張された適格性データ、独立試験証明書、契約上の救済措置をより頻繁に要求しています。
政策転換により、国内回帰とグローバル分業化の議論も活発化しています。国内回帰は関税リスクの低減や供給可視性の向上に寄与する一方、短期的なコストトレードオフも伴います。開発者や製造業者は、高リスクな投入材料には地域生産を、汎用原料にはグローバル調達を組み合わせたハイブリッドアプローチを追求することで、これらの要素のバランスを取っています。したがって、関税の影響を受ける環境下では、透明性と強固なサプライチェーンマッピングが調達の前提条件となり、今後も利害関係者が規制面および商業面での不確実性を管理する上で中核的な要素であり続けるでしょう。
材料化学、太陽光発電技術、設置形態、最終用途の優先順位が、どのように封入材の選定と認定プロセスを共同で形成しているかを明らかにする、セグメント別の知見
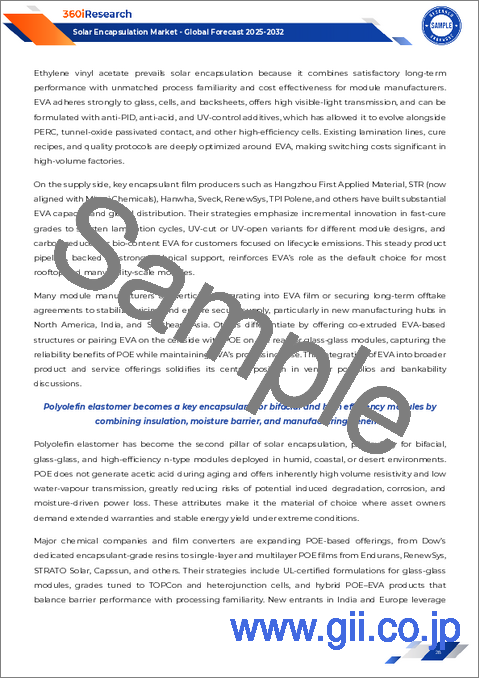
セグメント固有の動向は、封止技術が異なる技術的・商業的要件にどのように適合されているかを明らかにします。材料タイプに基づき、エチレン酢酸ビニル(EVA)、イオンマー、ポリビニルブチラール(PVB)、ポリオレフィン(PO)、熱可塑性ポリウレタン(TPU)の各情勢を調査します。それぞれが光学透明性、接着性、機械的減衰性、長期安定性の異なるバランスを提供します。エチレン酢酸ビニル樹脂は、実績ある現場履歴と加工の慣れ親しんだ特性から広く使用され続けております。一方、イオンマー樹脂や熱可塑性樹脂の代替品は、優れた防湿性能や高い熱安定性が追加コストを正当化する場合に採用が進んでおります。ポリビニルブチラールは特定の接着特性が求められる分野で引き続き役割を果たし、ポリオレフィン系樹脂はリサイクル性や低密度材料を優先する用途で検討が進められております。
よくあるご質問
目次
第1章 序文
第2章 調査手法
第3章 エグゼクティブサマリー
第4章 市場の概要
第5章 市場洞察
- 極限温度下におけるモジュール耐久性向上のための先進シリコーン系封止材の採用
- 両面モジュールのエネルギー収量向上のための積層工程における透明導電性フィルム層の統合
- デバイス寿命と効率を延長するための紫外線安定性ペロブスカイトタンデム封止技術の開発
- 一貫した封止材品質のための自動化ラミネーションおよび架橋プロセスの導入
- 循環型経済の要求に応えるため、再生可能かつバイオベースのポリマー封止材への移行
- 封止材内に組み込まれたセンサーネットワークの導入によるリアルタイム性能監視と予知保全
第6章 米国の関税の累積的な影響, 2025
第7章 AIの累積的影響, 2025
第8章 太陽光封止材市場:素材タイプ別
- エチレン酢酸ビニル
- イオンマー
- ポリビニルブチラール
- ポリオレフィン(PO)
- 熱可塑性ポリウレタン
第9章 太陽光封止材市場:技術別
- 結晶シリコン太陽電池
- 薄膜太陽電池
第10章 太陽光封止材市場:設置タイプ別
- 建築物一体型太陽光発電
- 浮体式太陽光発電
- 地上設置型
第11章 太陽光封止材市場:最終用途別
- 農業用
- 商業用
- 産業用
- 住宅用
- 公益事業
第12章 太陽光封止材市場:地域別
- 南北アメリカ
- 北米
- ラテンアメリカ
- 欧州・中東・アフリカ
- 欧州
- 中東
- アフリカ
- アジア太平洋地域
第13章 太陽光封止材市場:グループ別
- ASEAN
- GCC
- EU
- BRICS
- G7
- NATO
第14章 太陽光封止材市場:国別
- 米国
- カナダ
- メキシコ
- ブラジル
- 英国
- ドイツ
- フランス
- ロシア
- イタリア
- スペイン
- 中国
- インド
- 日本
- オーストラリア
- 韓国
第15章 競合情勢
- 市場シェア分析, 2024
- FPNVポジショニングマトリックス, 2024
- 競合分析
- 3M Company
- Alishan Green Energy Pvt. Ltd.
- Astenik Solar Inc.
- Borealis AG
- BREYER Maschinenfabrik GmbH
- China JWELL Intelligent Machinery Co.,Ltd.
- Cybrid Technologies Inc.
- Dai Nippon Printing Co., Ltd.
- Dunmore Corporation
- ENERLITE SOLAR FILMS INDIA PVT LTD
- Enrich Encap Pvt Ltd.
- Hangzhou First Applied Materials Co., Ltd.
- Heliatek GmbH
- JA Solar Technology Co., Ltd.
- Lucent CleanEnergy
- Mitsubishi Chemical Corporation
- Mitsui Chemicals Group
- Navitas Alpha Renewables Private Limited
- RenewSys India Pvt. Ltd.
- Saint-Gobain S.A.
- Shenzhen Gaoren Electronic New Material Co. Ltd.
- Targray Technology International Inc.
- The Dow Chemical Company
- USEON Technology Limited
- Vishakha Renewables Pvt. Ltd.

