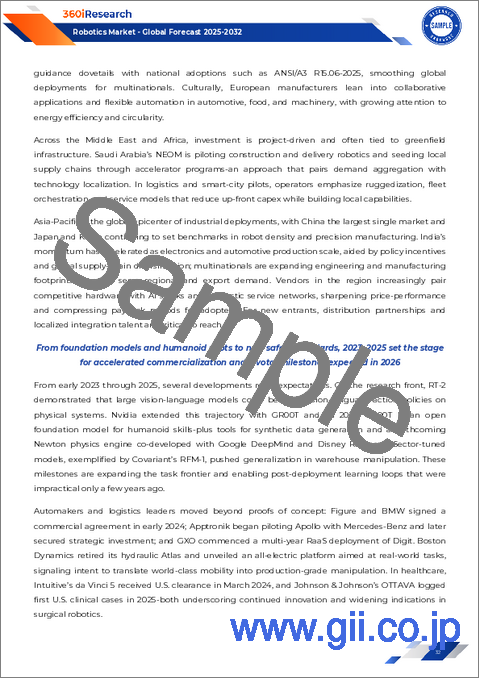
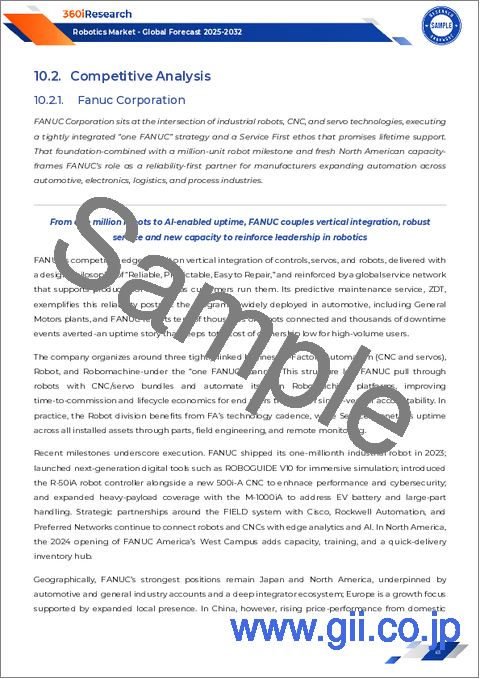
デフォルト表紙
市場調査レポート
商品コード
1714648

ロボティクス市場:ペイロード容量、ロボットタイプ、モビリティ、用途、最終用途産業別- 世界予測2025-2030年

Robotics Market by Payload Capacity, Robot Type, Mobility, Application, End-Use Industry - Global Forecast 2025-2030


出版日
発行
360iResearch
ページ情報
英文 189 Pages
納期
即日から翌営業日
カスタマイズ可能
適宜更新あり
価格
価格表記: USDを日本円(税抜)に換算
本日の銀行送金レート: 1USD=143.57円
ロボティクス市場:ペイロード容量、ロボットタイプ、モビリティ、用途、最終用途産業別- 世界予測2025-2030年
出版日: 2025年04月01日
発行: 360iResearch
ページ情報: 英文 189 Pages
納期: 即日から翌営業日
GIIご利用のメリット
  • 全表示
  • 概要
  • 図表
  • 目次
概要

ロボティクス市場は、2024年に969億米ドルと評価され、2025年にはCAGR 17.62%で1,133億4,000万米ドルに成長し、2030年には2,566億1,000万米ドルに達すると予測されています。

主な市場の統計
基準年 2024 969億米ドル
推定年 2025 1,133億4,000万米ドル
予測年 2030 2,566億1,000万米ドル
CAGR(%) 17.62%

ロボット産業は、急速な技術進歩と進化する市場ニーズによって、かつてない革新と拡大の時期を迎えています。近年、ロボット工学は自動化のニッチ分野から、世界の製造業、ヘルスケア、サービス部門に不可欠な要素へと移行しています。この変革は、人工知能や機械学習から高度なセンサーネットワークに至るまで、収束しつつある技術に支えられています。

国際市場は現在、イノベーションと実装のダイナミックな相互作用によって特徴付けられています。各社は既存のロボットソリューションを改良するだけでなく、運用の常識を塗り替えるまったく新しい枠組みを開拓しています。この複雑な競合環境では、持続可能な成長と業務効率を求める意思決定者にとって、変化の主要因を理解することが重要です。この包括的な概要では、市場の進化、戦略的セグメンテーション、地域ダイナミックス、競合情勢といった核となる要素を探ることで舞台を整え、利害関係者にロボティクスの変革期を乗り切るための実用的な考察を提供します。

ロボティクス市場の変革

近年、ロボット産業は従来のオートメーションからインテリジェントで適応性の高いシステムへの移行を示す、変革的なシフトが起きています。こうしたシフトの主な要因は、相互に関連するいくつかの開発にあります。

第一に、急速な技術の進歩により、以前は達成できなかったレベルの精度と効率が可能になりました。最新のロボットには、高精度のアクチュエーターだけでなく、複雑な環境でもシームレスな動作を保証するスマートセンサーや高度な制御システムが組み込まれています。第二に、デジタルデータ分析の統合により、業務パフォーマンスに関するかつてない洞察がもたらされ、リアルタイムでのプロセスの最適化が可能になりました。デジタル・ツインやリアルタイム・モニタリング・システムの登場は、デジタル技術を駆使したロボティクス・ソリューションへの移行をさらに加速させています。

もうひとつの大きな変化は、AI、機械学習、モノのインターネット(IoT)といった新たなテクノロジーとロボティクスの融合です。例えば、予知保全や自律的な意思決定は、もはや未来的な概念ではなく、最新のロボットシステムの具体的なメリットとなっています。さらに、ハードウェアのコスト削減とソフトウェア・ソリューションの拡張性の向上により、アクセスが民主化され、中堅企業でもロボット工学を大規模に導入できるようになりました。

こうした変革的な動向は、単なる技術的な衝動ではなく、部門を問わず生産性、柔軟性、安全性の向上を推進する戦略的な必須事項です。企業が業務の青写真を見直すにつれ、ロボティクスをより広範なデジタル戦略と統合することが重視されるようになっています。全体として、技術プロバイダー、エンドユーザー、規制機関の間で協力体制が強化され、技術革新が実用的で市場主導のニーズに合致し続けることが、市場情勢の特徴となっています。

ロボティクスの主なセグメンテーション洞察

ロボティクス市場をより深く理解するには、主要なセグメンテーション要因を総合的に検討することが最も効果的です。業界は可搬重量に基づいてセグメント化されており、50キログラム以上の荷物を扱う大可搬重量ロボット、10~50キログラムの荷物を扱う中可搬重量ロボット、10キログラム未満の荷物を扱う小可搬重量ロボットが区別されています。それぞれのペイロードカテゴリーには独自の利点と課題があり、設計、アプリケーション、エネルギー要件に影響を与えます。

ロボットのタイプから見ると、市場は多種多様なシステムを包含しています。詳細な調査では、柔軟な関節で知られる多関節ロボット、決められた経路のナビゲーションに優れる無人搬送車、自己主導的な動きを提供する自律移動ロボット、直線的な動きをする直交ロボット、人間と機械の安全な相互作用のために設計された協働作用ロボット、高速性能が認められているデルタロボット、人間のような動きを模倣するヒューマノイドロボット、組立ラインでの精密さが好まれているスカラロボットなどが検討されています。このような幅広い種類のロボットは、様々な用途における多様な業務ニーズを反映しています。

また、機動性も重要なセグメンテーション基準となっています。一箇所に固定された固定型ロボットは、反復的な作業において安定性と一貫性を提供します。一方、移動型ロボットは、様々な場所を移動することで汎用性と適応性を提供し、ダイナミックな作業環境のニーズに対応します。

さらに用途別にセグメント化すると、最終用途のシナリオに大きな多様性があることがわかる。組立・分解作業における精度の確認、総合的な検査と品質テストの確保、マテリアルハンドリング作業の合理化、包装・ラベリング工程の自動化、均一な塗装・コーティングの実行、正確な溶接・はんだ付けの実行など、各用途は特定の技術的要件に支配されています。

最後に、最終用途産業別にセグメンテーションを行うことで、市場浸透度をより明確に把握することができます。ロボティクス市場は、研究や双方向学習にロボットが使用される学術・教育分野、性能と信頼性の基準が厳しい航空宇宙・防衛分野、自動化によって生産性を向上させる農業分野、大量生産と組み立てを特徴とする自動車分野、堅牢で特殊なソリューションを必要とする化学・建設分野、効率と精度が最優先されるエレクトロニクス、食品・飲食品、ヘルスケア、物流・サプライチェーン分野、さらにカスタマイズされたロボット介入を必要とする金属・機械、小売業など、幅広い産業に対応しています。このような多様な要件に対応する能力は、最新のロボットソリューションの奥深さと適応性を明らかにしています。

目次

第1章 序文

第2章 調査手法

第3章 エグゼクティブサマリー

第4章 市場の概要

第5章 市場洞察

  • 市場力学
    • 促進要因
      • 製造業および産業用アプリケーションにおけるロボティクスの採用増加
      • ヘルスケアとライフサイエンスにおける自動化の需要の高まり
      • eコマースと倉庫の急増がロボティクスの展開増加に貢献
    • 抑制要因
      • 初期投資と導入コストが高い
    • 機会
      • 産業アプリケーション向けAI駆動型ロボティクスソリューションの統合
      • 中小企業における協働ロボットの出現
    • 課題
      • ロボティクスにおける複雑な規制環境と多様な国際コンプライアンス基準
  • 市場セグメンテーション分析
  • ポーターのファイブフォース分析
  • PESTEL分析
    • 政治的
    • 経済
    • 社会
    • 技術的
    • 法律上
    • 環境

第6章 ロボティクス市場積載量別

  • 大型ペイロードロボット(50kg以上)
  • 中型ペイロードロボット(10~50kg)
  • 小型ペイロードロボット(10kg未満)

第7章 ロボティクス市場ロボットの種類別

  • 多関節ロボット
  • 無人搬送車
  • 自律移動ロボット
  • 直交ロボット
  • 協働ロボット
  • デルタロボット
  • ヒューマノイドロボット
  • スカラロボット

第8章 ロボティクス市場モビリティ

  • 固定ロボット
  • 移動ロボット

第9章 ロボティクス市場:用途別

  • 組み立てと分解
  • 検査と品質試験
  • マテリアルハンドリング
  • 包装とラベル
  • 塗装・コーティング
  • 溶接とはんだ付け

第10章 ロボティクス市場:最終用途産業別

  • 学術・教育
  • 航空宇宙および防衛
  • 農業
  • 自動車
  • 化学薬品
  • 工事
  • エレクトロニクス
  • 飲食品
  • ヘルスケア
  • 物流とサプライチェーン
  • 金属・機械
  • 小売り

第11章 南北アメリカのロボティクス市場

  • アルゼンチン
  • ブラジル
  • カナダ
  • メキシコ
  • 米国

第12章 アジア太平洋地域のロボティクス市場

  • オーストラリア
  • 中国
  • インド
  • インドネシア
  • 日本
  • マレーシア
  • フィリピン
  • シンガポール
  • 韓国
  • 台湾
  • タイ
  • ベトナム

第13章 欧州・中東・アフリカのロボティクス市場

  • デンマーク
  • エジプト
  • フィンランド
  • フランス
  • ドイツ
  • イスラエル
  • イタリア
  • オランダ
  • ナイジェリア
  • ノルウェー
  • ポーランド
  • カタール
  • ロシア
  • サウジアラビア
  • 南アフリカ
  • スペイン
  • スウェーデン
  • スイス
  • トルコ
  • アラブ首長国連邦
  • 英国

第14章 競合情勢

  • 市場シェア分析, 2024
  • FPNVポジショニングマトリックス, 2024
  • 競合シナリオ分析
  • 戦略分析と提言

企業一覧

  • ABB Ltd.
  • Autonomous Solutions, Inc.
  • Boston Dynamics, Inc.
  • Clearpath Robotics, Inc.
  • Comau S.p.A.
  • Denso Corporation
  • Fanuc Corporation
  • iRobot Corporation
  • Kawasaki Heavy Industries, Ltd.
  • KUKA AG
  • Mabi Robotics AG
  • Mitsubishi Electric Corporation
  • NVIDIA Corporation
  • Omron Corporation
  • Panasonic Holdings Corporation
  • Rethink Robotics GmbH
  • Robert Bosch GmbH
  • Seiko Epson Corporation
  • Staubli International AG
  • Stryker Corporation
  • Teradyne, Inc.
  • Toshiba Corporation
  • Universal Robots A/S
  • Yamaha Motor Co. Ltd
  • Yaskawa Electric Corporation
  • Zebra Technologies Corporation
図表

LIST OF FIGURES

  • FIGURE 1. ROBOTICS MARKET MULTI-CURRENCY
  • FIGURE 2. ROBOTICS MARKET MULTI-LANGUAGE
  • FIGURE 3. ROBOTICS MARKET RESEARCH PROCESS
  • FIGURE 4. ROBOTICS MARKET SIZE, 2024 VS 2030
  • FIGURE 5. GLOBAL ROBOTICS MARKET SIZE, 2018-2030 (USD MILLION)
  • FIGURE 6. GLOBAL ROBOTICS MARKET SIZE, BY REGION, 2024 VS 2025 VS 2030 (USD MILLION)
  • FIGURE 7. GLOBAL ROBOTICS MARKET SIZE, BY COUNTRY, 2024 VS 2025 VS 2030 (USD MILLION)
  • FIGURE 8. GLOBAL ROBOTICS MARKET SIZE, BY PAYLOAD CAPACITY, 2024 VS 2030 (%)
  • FIGURE 9. GLOBAL ROBOTICS MARKET SIZE, BY PAYLOAD CAPACITY, 2024 VS 2025 VS 2030 (USD MILLION)
  • FIGURE 10. GLOBAL ROBOTICS MARKET SIZE, BY ROBOT TYPE, 2024 VS 2030 (%)
  • FIGURE 11. GLOBAL ROBOTICS MARKET SIZE, BY ROBOT TYPE, 2024 VS 2025 VS 2030 (USD MILLION)
  • FIGURE 12. GLOBAL ROBOTICS MARKET SIZE, BY MOBILITY, 2024 VS 2030 (%)
  • FIGURE 13. GLOBAL ROBOTICS MARKET SIZE, BY MOBILITY, 2024 VS 2025 VS 2030 (USD MILLION)
  • FIGURE 14. GLOBAL ROBOTICS MARKET SIZE, BY APPLICATION, 2024 VS 2030 (%)
  • FIGURE 15. GLOBAL ROBOTICS MARKET SIZE, BY APPLICATION, 2024 VS 2025 VS 2030 (USD MILLION)
  • FIGURE 16. GLOBAL ROBOTICS MARKET SIZE, BY END-USE INDUSTRY, 2024 VS 2030 (%)
  • FIGURE 17. GLOBAL ROBOTICS MARKET SIZE, BY END-USE INDUSTRY, 2024 VS 2025 VS 2030 (USD MILLION)
  • FIGURE 18. AMERICAS ROBOTICS MARKET SIZE, BY COUNTRY, 2024 VS 2030 (%)
  • FIGURE 19. AMERICAS ROBOTICS MARKET SIZE, BY COUNTRY, 2024 VS 2025 VS 2030 (USD MILLION)
  • FIGURE 20. UNITED STATES ROBOTICS MARKET SIZE, BY STATE, 2024 VS 2030 (%)
  • FIGURE 21. UNITED STATES ROBOTICS MARKET SIZE, BY STATE, 2024 VS 2025 VS 2030 (USD MILLION)
  • FIGURE 22. ASIA-PACIFIC ROBOTICS MARKET SIZE, BY COUNTRY, 2024 VS 2030 (%)
  • FIGURE 23. ASIA-PACIFIC ROBOTICS MARKET SIZE, BY COUNTRY, 2024 VS 2025 VS 2030 (USD MILLION)
  • FIGURE 24. EUROPE, MIDDLE EAST & AFRICA ROBOTICS MARKET SIZE, BY COUNTRY, 2024 VS 2030 (%)
  • FIGURE 25. EUROPE, MIDDLE EAST & AFRICA ROBOTICS MARKET SIZE, BY COUNTRY, 2024 VS 2025 VS 2030 (USD MILLION)
  • FIGURE 26. ROBOTICS MARKET SHARE, BY KEY PLAYER, 2024
  • FIGURE 27. ROBOTICS MARKET, FPNV POSITIONING MATRIX, 2024

LIST OF TABLES

  • TABLE 1. ROBOTICS MARKET SEGMENTATION & COVERAGE
  • TABLE 2. UNITED STATES DOLLAR EXCHANGE RATE, 2018-2024
  • TABLE 3. GLOBAL ROBOTICS MARKET SIZE, 2018-2030 (USD MILLION)
  • TABLE 4. GLOBAL ROBOTICS MARKET SIZE, BY REGION, 2018-2030 (USD MILLION)
  • TABLE 5. GLOBAL ROBOTICS MARKET SIZE, BY COUNTRY, 2018-2030 (USD MILLION)
  • TABLE 6. ROBOTICS MARKET DYNAMICS
  • TABLE 7. GLOBAL ROBOTICS MARKET SIZE, BY PAYLOAD CAPACITY, 2018-2030 (USD MILLION)
  • TABLE 8. GLOBAL ROBOTICS MARKET SIZE, BY LARGE PAYLOAD ROBOTS (ABOVE 50 KG), BY REGION, 2018-2030 (USD MILLION)
  • TABLE 9. GLOBAL ROBOTICS MARKET SIZE, BY MEDIUM PAYLOAD ROBOTS (10-50 KG), BY REGION, 2018-2030 (USD MILLION)
  • TABLE 10. GLOBAL ROBOTICS MARKET SIZE, BY SMALL PAYLOAD ROBOTS (BELOW 10 KG), BY REGION, 2018-2030 (USD MILLION)
  • TABLE 11. GLOBAL ROBOTICS MARKET SIZE, BY ROBOT TYPE, 2018-2030 (USD MILLION)
  • TABLE 12. GLOBAL ROBOTICS MARKET SIZE, BY ARTICULATED ROBOTS, BY REGION, 2018-2030 (USD MILLION)
  • TABLE 13. GLOBAL ROBOTICS MARKET SIZE, BY AUTOMATED GUIDED VEHICLES, BY REGION, 2018-2030 (USD MILLION)
  • TABLE 14. GLOBAL ROBOTICS MARKET SIZE, BY AUTONOMOUS MOBILE ROBOTS, BY REGION, 2018-2030 (USD MILLION)
  • TABLE 15. GLOBAL ROBOTICS MARKET SIZE, BY CARTESIAN ROBOTS, BY REGION, 2018-2030 (USD MILLION)
  • TABLE 16. GLOBAL ROBOTICS MARKET SIZE, BY COLLABORATIVE ROBOTS, BY REGION, 2018-2030 (USD MILLION)
  • TABLE 17. GLOBAL ROBOTICS MARKET SIZE, BY DELTA ROBOTS, BY REGION, 2018-2030 (USD MILLION)
  • TABLE 18. GLOBAL ROBOTICS MARKET SIZE, BY HUMANOID ROBOTS, BY REGION, 2018-2030 (USD MILLION)
  • TABLE 19. GLOBAL ROBOTICS MARKET SIZE, BY SCARA ROBOTS, BY REGION, 2018-2030 (USD MILLION)
  • TABLE 20. GLOBAL ROBOTICS MARKET SIZE, BY MOBILITY, 2018-2030 (USD MILLION)
  • TABLE 21. GLOBAL ROBOTICS MARKET SIZE, BY FIXED ROBOTS, BY REGION, 2018-2030 (USD MILLION)
  • TABLE 22. GLOBAL ROBOTICS MARKET SIZE, BY MOBILE ROBOTS, BY REGION, 2018-2030 (USD MILLION)
  • TABLE 23. GLOBAL ROBOTICS MARKET SIZE, BY APPLICATION, 2018-2030 (USD MILLION)
  • TABLE 24. GLOBAL ROBOTICS MARKET SIZE, BY ASSEMBLING & DISASSEMBLING, BY REGION, 2018-2030 (USD MILLION)
  • TABLE 25. GLOBAL ROBOTICS MARKET SIZE, BY INSPECTION & QUALITY TESTING, BY REGION, 2018-2030 (USD MILLION)
  • TABLE 26. GLOBAL ROBOTICS MARKET SIZE, BY MATERIAL HANDLING, BY REGION, 2018-2030 (USD MILLION)
  • TABLE 27. GLOBAL ROBOTICS MARKET SIZE, BY PACKAGING & LABELING, BY REGION, 2018-2030 (USD MILLION)
  • TABLE 28. GLOBAL ROBOTICS MARKET SIZE, BY PAINTING & COATING, BY REGION, 2018-2030 (USD MILLION)
  • TABLE 29. GLOBAL ROBOTICS MARKET SIZE, BY WELDING & SOLDERING, BY REGION, 2018-2030 (USD MILLION)
  • TABLE 30. GLOBAL ROBOTICS MARKET SIZE, BY END-USE INDUSTRY, 2018-2030 (USD MILLION)
  • TABLE 31. GLOBAL ROBOTICS MARKET SIZE, BY ACADEMICS & EDUCATION, BY REGION, 2018-2030 (USD MILLION)
  • TABLE 32. GLOBAL ROBOTICS MARKET SIZE, BY AEROSPACE & DEFENSE, BY REGION, 2018-2030 (USD MILLION)
  • TABLE 33. GLOBAL ROBOTICS MARKET SIZE, BY AGRICULTURE, BY REGION, 2018-2030 (USD MILLION)
  • TABLE 34. GLOBAL ROBOTICS MARKET SIZE, BY AUTOMOTIVE, BY REGION, 2018-2030 (USD MILLION)
  • TABLE 35. GLOBAL ROBOTICS MARKET SIZE, BY CHEMICAL, BY REGION, 2018-2030 (USD MILLION)
  • TABLE 36. GLOBAL ROBOTICS MARKET SIZE, BY CONSTRUCTION, BY REGION, 2018-2030 (USD MILLION)
  • TABLE 37. GLOBAL ROBOTICS MARKET SIZE, BY ELECTRONICS, BY REGION, 2018-2030 (USD MILLION)
  • TABLE 38. GLOBAL ROBOTICS MARKET SIZE, BY FOOD & BEVERAGE, BY REGION, 2018-2030 (USD MILLION)
  • TABLE 39. GLOBAL ROBOTICS MARKET SIZE, BY HEALTHCARE, BY REGION, 2018-2030 (USD MILLION)
  • TABLE 40. GLOBAL ROBOTICS MARKET SIZE, BY LOGISTICS & SUPPLY CHAIN, BY REGION, 2018-2030 (USD MILLION)
  • TABLE 41. GLOBAL ROBOTICS MARKET SIZE, BY METAL & MACHINERY, BY REGION, 2018-2030 (USD MILLION)
  • TABLE 42. GLOBAL ROBOTICS MARKET SIZE, BY RETAIL, BY REGION, 2018-2030 (USD MILLION)
  • TABLE 43. AMERICAS ROBOTICS MARKET SIZE, BY PAYLOAD CAPACITY, 2018-2030 (USD MILLION)
  • TABLE 44. AMERICAS ROBOTICS MARKET SIZE, BY ROBOT TYPE, 2018-2030 (USD MILLION)
  • TABLE 45. AMERICAS ROBOTICS MARKET SIZE, BY MOBILITY, 2018-2030 (USD MILLION)
  • TABLE 46. AMERICAS ROBOTICS MARKET SIZE, BY APPLICATION, 2018-2030 (USD MILLION)
  • TABLE 47. AMERICAS ROBOTICS MARKET SIZE, BY END-USE INDUSTRY, 2018-2030 (USD MILLION)
  • TABLE 48. AMERICAS ROBOTICS MARKET SIZE, BY COUNTRY, 2018-2030 (USD MILLION)
  • TABLE 49. ARGENTINA ROBOTICS MARKET SIZE, BY PAYLOAD CAPACITY, 2018-2030 (USD MILLION)
  • TABLE 50. ARGENTINA ROBOTICS MARKET SIZE, BY ROBOT TYPE, 2018-2030 (USD MILLION)
  • TABLE 51. ARGENTINA ROBOTICS MARKET SIZE, BY MOBILITY, 2018-2030 (USD MILLION)
  • TABLE 52. ARGENTINA ROBOTICS MARKET SIZE, BY APPLICATION, 2018-2030 (USD MILLION)
  • TABLE 53. ARGENTINA ROBOTICS MARKET SIZE, BY END-USE INDUSTRY, 2018-2030 (USD MILLION)
  • TABLE 54. BRAZIL ROBOTICS MARKET SIZE, BY PAYLOAD CAPACITY, 2018-2030 (USD MILLION)
  • TABLE 55. BRAZIL ROBOTICS MARKET SIZE, BY ROBOT TYPE, 2018-2030 (USD MILLION)
  • TABLE 56. BRAZIL ROBOTICS MARKET SIZE, BY MOBILITY, 2018-2030 (USD MILLION)
  • TABLE 57. BRAZIL ROBOTICS MARKET SIZE, BY APPLICATION, 2018-2030 (USD MILLION)
  • TABLE 58. BRAZIL ROBOTICS MARKET SIZE, BY END-USE INDUSTRY, 2018-2030 (USD MILLION)
  • TABLE 59. CANADA ROBOTICS MARKET SIZE, BY PAYLOAD CAPACITY, 2018-2030 (USD MILLION)
  • TABLE 60. CANADA ROBOTICS MARKET SIZE, BY ROBOT TYPE, 2018-2030 (USD MILLION)
  • TABLE 61. CANADA ROBOTICS MARKET SIZE, BY MOBILITY, 2018-2030 (USD MILLION)
  • TABLE 62. CANADA ROBOTICS MARKET SIZE, BY APPLICATION, 2018-2030 (USD MILLION)
  • TABLE 63. CANADA ROBOTICS MARKET SIZE, BY END-USE INDUSTRY, 2018-2030 (USD MILLION)
  • TABLE 64. MEXICO ROBOTICS MARKET SIZE, BY PAYLOAD CAPACITY, 2018-2030 (USD MILLION)
  • TABLE 65. MEXICO ROBOTICS MARKET SIZE, BY ROBOT TYPE, 2018-2030 (USD MILLION)
  • TABLE 66. MEXICO ROBOTICS MARKET SIZE, BY MOBILITY, 2018-2030 (USD MILLION)
  • TABLE 67. MEXICO ROBOTICS MARKET SIZE, BY APPLICATION, 2018-2030 (USD MILLION)
  • TABLE 68. MEXICO ROBOTICS MARKET SIZE, BY END-USE INDUSTRY, 2018-2030 (USD MILLION)
  • TABLE 69. UNITED STATES ROBOTICS MARKET SIZE, BY PAYLOAD CAPACITY, 2018-2030 (USD MILLION)
  • TABLE 70. UNITED STATES ROBOTICS MARKET SIZE, BY ROBOT TYPE, 2018-2030 (USD MILLION)
  • TABLE 71. UNITED STATES ROBOTICS MARKET SIZE, BY MOBILITY, 2018-2030 (USD MILLION)
  • TABLE 72. UNITED STATES ROBOTICS MARKET SIZE, BY APPLICATION, 2018-2030 (USD MILLION)
  • TABLE 73. UNITED STATES ROBOTICS MARKET SIZE, BY END-USE INDUSTRY, 2018-2030 (USD MILLION)
  • TABLE 74. UNITED STATES ROBOTICS MARKET SIZE, BY STATE, 2018-2030 (USD MILLION)
  • TABLE 75. ASIA-PACIFIC ROBOTICS MARKET SIZE, BY PAYLOAD CAPACITY, 2018-2030 (USD MILLION)
  • TABLE 76. ASIA-PACIFIC ROBOTICS MARKET SIZE, BY ROBOT TYPE, 2018-2030 (USD MILLION)
  • TABLE 77. ASIA-PACIFIC ROBOTICS MARKET SIZE, BY MOBILITY, 2018-2030 (USD MILLION)
  • TABLE 78. ASIA-PACIFIC ROBOTICS MARKET SIZE, BY APPLICATION, 2018-2030 (USD MILLION)
  • TABLE 79. ASIA-PACIFIC ROBOTICS MARKET SIZE, BY END-USE INDUSTRY, 2018-2030 (USD MILLION)
  • TABLE 80. ASIA-PACIFIC ROBOTICS MARKET SIZE, BY COUNTRY, 2018-2030 (USD MILLION)
  • TABLE 81. AUSTRALIA ROBOTICS MARKET SIZE, BY PAYLOAD CAPACITY, 2018-2030 (USD MILLION)
  • TABLE 82. AUSTRALIA ROBOTICS MARKET SIZE, BY ROBOT TYPE, 2018-2030 (USD MILLION)
  • TABLE 83. AUSTRALIA ROBOTICS MARKET SIZE, BY MOBILITY, 2018-2030 (USD MILLION)
  • TABLE 84. AUSTRALIA ROBOTICS MARKET SIZE, BY APPLICATION, 2018-2030 (USD MILLION)
  • TABLE 85. AUSTRALIA ROBOTICS MARKET SIZE, BY END-USE INDUSTRY, 2018-2030 (USD MILLION)
  • TABLE 86. CHINA ROBOTICS MARKET SIZE, BY PAYLOAD CAPACITY, 2018-2030 (USD MILLION)
  • TABLE 87. CHINA ROBOTICS MARKET SIZE, BY ROBOT TYPE, 2018-2030 (USD MILLION)
  • TABLE 88. CHINA ROBOTICS MARKET SIZE, BY MOBILITY, 2018-2030 (USD MILLION)
  • TABLE 89. CHINA ROBOTICS MARKET SIZE, BY APPLICATION, 2018-2030 (USD MILLION)
  • TABLE 90. CHINA ROBOTICS MARKET SIZE, BY END-USE INDUSTRY, 2018-2030 (USD MILLION)
  • TABLE 91. INDIA ROBOTICS MARKET SIZE, BY PAYLOAD CAPACITY, 2018-2030 (USD MILLION)
  • TABLE 92. INDIA ROBOTICS MARKET SIZE, BY ROBOT TYPE, 2018-2030 (USD MILLION)
  • TABLE 93. INDIA ROBOTICS MARKET SIZE, BY MOBILITY, 2018-2030 (USD MILLION)
  • TABLE 94. INDIA ROBOTICS MARKET SIZE, BY APPLICATION, 2018-2030 (USD MILLION)
  • TABLE 95. INDIA ROBOTICS MARKET SIZE, BY END-USE INDUSTRY, 2018-2030 (USD MILLION)
  • TABLE 96. INDONESIA ROBOTICS MARKET SIZE, BY PAYLOAD CAPACITY, 2018-2030 (USD MILLION)
  • TABLE 97. INDONESIA ROBOTICS MARKET SIZE, BY ROBOT TYPE, 2018-2030 (USD MILLION)
  • TABLE 98. INDONESIA ROBOTICS MARKET SIZE, BY MOBILITY, 2018-2030 (USD MILLION)
  • TABLE 99. INDONESIA ROBOTICS MARKET SIZE, BY APPLICATION, 2018-2030 (USD MILLION)
  • TABLE 100. INDONESIA ROBOTICS MARKET SIZE, BY END-USE INDUSTRY, 2018-2030 (USD MILLION)
  • TABLE 101. JAPAN ROBOTICS MARKET SIZE, BY PAYLOAD CAPACITY, 2018-2030 (USD MILLION)
  • TABLE 102. JAPAN ROBOTICS MARKET SIZE, BY ROBOT TYPE, 2018-2030 (USD MILLION)
  • TABLE 103. JAPAN ROBOTICS MARKET SIZE, BY MOBILITY, 2018-2030 (USD MILLION)
  • TABLE 104. JAPAN ROBOTICS MARKET SIZE, BY APPLICATION, 2018-2030 (USD MILLION)
  • TABLE 105. JAPAN ROBOTICS MARKET SIZE, BY END-USE INDUSTRY, 2018-2030 (USD MILLION)
  • TABLE 106. MALAYSIA ROBOTICS MARKET SIZE, BY PAYLOAD CAPACITY, 2018-2030 (USD MILLION)
  • TABLE 107. MALAYSIA ROBOTICS MARKET SIZE, BY ROBOT TYPE, 2018-2030 (USD MILLION)
  • TABLE 108. MALAYSIA ROBOTICS MARKET SIZE, BY MOBILITY, 2018-2030 (USD MILLION)
  • TABLE 109. MALAYSIA ROBOTICS MARKET SIZE, BY APPLICATION, 2018-2030 (USD MILLION)
  • TABLE 110. MALAYSIA ROBOTICS MARKET SIZE, BY END-USE INDUSTRY, 2018-2030 (USD MILLION)
  • TABLE 111. PHILIPPINES ROBOTICS MARKET SIZE, BY PAYLOAD CAPACITY, 2018-2030 (USD MILLION)
  • TABLE 112. PHILIPPINES ROBOTICS MARKET SIZE, BY ROBOT TYPE, 2018-2030 (USD MILLION)
  • TABLE 113. PHILIPPINES ROBOTICS MARKET SIZE, BY MOBILITY, 2018-2030 (USD MILLION)
  • TABLE 114. PHILIPPINES ROBOTICS MARKET SIZE, BY APPLICATION, 2018-2030 (USD MILLION)
  • TABLE 115. PHILIPPINES ROBOTICS MARKET SIZE, BY END-USE INDUSTRY, 2018-2030 (USD MILLION)
  • TABLE 116. SINGAPORE ROBOTICS MARKET SIZE, BY PAYLOAD CAPACITY, 2018-2030 (USD MILLION)
  • TABLE 117. SINGAPORE ROBOTICS MARKET SIZE, BY ROBOT TYPE, 2018-2030 (USD MILLION)
  • TABLE 118. SINGAPORE ROBOTICS MARKET SIZE, BY MOBILITY, 2018-2030 (USD MILLION)
  • TABLE 119. SINGAPORE ROBOTICS MARKET SIZE, BY APPLICATION, 2018-2030 (USD MILLION)
  • TABLE 120. SINGAPORE ROBOTICS MARKET SIZE, BY END-USE INDUSTRY, 2018-2030 (USD MILLION)
  • TABLE 121. SOUTH KOREA ROBOTICS MARKET SIZE, BY PAYLOAD CAPACITY, 2018-2030 (USD MILLION)
  • TABLE 122. SOUTH KOREA ROBOTICS MARKET SIZE, BY ROBOT TYPE, 2018-2030 (USD MILLION)
  • TABLE 123. SOUTH KOREA ROBOTICS MARKET SIZE, BY MOBILITY, 2018-2030 (USD MILLION)
  • TABLE 124. SOUTH KOREA ROBOTICS MARKET SIZE, BY APPLICATION, 2018-2030 (USD MILLION)
  • TABLE 125. SOUTH KOREA ROBOTICS MARKET SIZE, BY END-USE INDUSTRY, 2018-2030 (USD MILLION)
  • TABLE 126. TAIWAN ROBOTICS MARKET SIZE, BY PAYLOAD CAPACITY, 2018-2030 (USD MILLION)
  • TABLE 127. TAIWAN ROBOTICS MARKET SIZE, BY ROBOT TYPE, 2018-2030 (USD MILLION)
  • TABLE 128. TAIWAN ROBOTICS MARKET SIZE, BY MOBILITY, 2018-2030 (USD MILLION)
  • TABLE 129. TAIWAN ROBOTICS MARKET SIZE, BY APPLICATION, 2018-2030 (USD MILLION)
  • TABLE 130. TAIWAN ROBOTICS MARKET SIZE, BY END-USE INDUSTRY, 2018-2030 (USD MILLION)
  • TABLE 131. THAILAND ROBOTICS MARKET SIZE, BY PAYLOAD CAPACITY, 2018-2030 (USD MILLION)
  • TABLE 132. THAILAND ROBOTICS MARKET SIZE, BY ROBOT TYPE, 2018-2030 (USD MILLION)
  • TABLE 133. THAILAND ROBOTICS MARKET SIZE, BY MOBILITY, 2018-2030 (USD MILLION)
  • TABLE 134. THAILAND ROBOTICS MARKET SIZE, BY APPLICATION, 2018-2030 (USD MILLION)
  • TABLE 135. THAILAND ROBOTICS MARKET SIZE, BY END-USE INDUSTRY, 2018-2030 (USD MILLION)
  • TABLE 136. VIETNAM ROBOTICS MARKET SIZE, BY PAYLOAD CAPACITY, 2018-2030 (USD MILLION)
  • TABLE 137. VIETNAM ROBOTICS MARKET SIZE, BY ROBOT TYPE, 2018-2030 (USD MILLION)
  • TABLE 138. VIETNAM ROBOTICS MARKET SIZE, BY MOBILITY, 2018-2030 (USD MILLION)
  • TABLE 139. VIETNAM ROBOTICS MARKET SIZE, BY APPLICATION, 2018-2030 (USD MILLION)
  • TABLE 140. VIETNAM ROBOTICS MARKET SIZE, BY END-USE INDUSTRY, 2018-2030 (USD MILLION)
  • TABLE 141. EUROPE, MIDDLE EAST & AFRICA ROBOTICS MARKET SIZE, BY PAYLOAD CAPACITY, 2018-2030 (USD MILLION)
  • TABLE 142. EUROPE, MIDDLE EAST & AFRICA ROBOTICS MARKET SIZE, BY ROBOT TYPE, 2018-2030 (USD MILLION)
  • TABLE 143. EUROPE, MIDDLE EAST & AFRICA ROBOTICS MARKET SIZE, BY MOBILITY, 2018-2030 (USD MILLION)
  • TABLE 144. EUROPE, MIDDLE EAST & AFRICA ROBOTICS MARKET SIZE, BY APPLICATION, 2018-2030 (USD MILLION)
  • TABLE 145. EUROPE, MIDDLE EAST & AFRICA ROBOTICS MARKET SIZE, BY END-USE INDUSTRY, 2018-2030 (USD MILLION)
  • TABLE 146. EUROPE, MIDDLE EAST & AFRICA ROBOTICS MARKET SIZE, BY COUNTRY, 2018-2030 (USD MILLION)
  • TABLE 147. DENMARK ROBOTICS MARKET SIZE, BY PAYLOAD CAPACITY, 2018-2030 (USD MILLION)
  • TABLE 148. DENMARK ROBOTICS MARKET SIZE, BY ROBOT TYPE, 2018-2030 (USD MILLION)
  • TABLE 149. DENMARK ROBOTICS MARKET SIZE, BY MOBILITY, 2018-2030 (USD MILLION)
  • TABLE 150. DENMARK ROBOTICS MARKET SIZE, BY APPLICATION, 2018-2030 (USD MILLION)
  • TABLE 151. DENMARK ROBOTICS MARKET SIZE, BY END-USE INDUSTRY, 2018-2030 (USD MILLION)
  • TABLE 152. EGYPT ROBOTICS MARKET SIZE, BY PAYLOAD CAPACITY, 2018-2030 (USD MILLION)
  • TABLE 153. EGYPT ROBOTICS MARKET SIZE, BY ROBOT TYPE, 2018-2030 (USD MILLION)
  • TABLE 154. EGYPT ROBOTICS MARKET SIZE, BY MOBILITY, 2018-2030 (USD MILLION)
  • TABLE 155. EGYPT ROBOTICS MARKET SIZE, BY APPLICATION, 2018-2030 (USD MILLION)
  • TABLE 156. EGYPT ROBOTICS MARKET SIZE, BY END-USE INDUSTRY, 2018-2030 (USD MILLION)
  • TABLE 157. FINLAND ROBOTICS MARKET SIZE, BY PAYLOAD CAPACITY, 2018-2030 (USD MILLION)
  • TABLE 158. FINLAND ROBOTICS MARKET SIZE, BY ROBOT TYPE, 2018-2030 (USD MILLION)
  • TABLE 159. FINLAND ROBOTICS MARKET SIZE, BY MOBILITY, 2018-2030 (USD MILLION)
  • TABLE 160. FINLAND ROBOTICS MARKET SIZE, BY APPLICATION, 2018-2030 (USD MILLION)
  • TABLE 161. FINLAND ROBOTICS MARKET SIZE, BY END-USE INDUSTRY, 2018-2030 (USD MILLION)
  • TABLE 162. FRANCE ROBOTICS MARKET SIZE, BY PAYLOAD CAPACITY, 2018-2030 (USD MILLION)
  • TABLE 163. FRANCE ROBOTICS MARKET SIZE, BY ROBOT TYPE, 2018-2030 (USD MILLION)
  • TABLE 164. FRANCE ROBOTICS MARKET SIZE, BY MOBILITY, 2018-2030 (USD MILLION)
  • TABLE 165. FRANCE ROBOTICS MARKET SIZE, BY APPLICATION, 2018-2030 (USD MILLION)
  • TABLE 166. FRANCE ROBOTICS MARKET SIZE, BY END-USE INDUSTRY, 2018-2030 (USD MILLION)
  • TABLE 167. GERMANY ROBOTICS MARKET SIZE, BY PAYLOAD CAPACITY, 2018-2030 (USD MILLION)
  • TABLE 168. GERMANY ROBOTICS MARKET SIZE, BY ROBOT TYPE, 2018-2030 (USD MILLION)
  • TABLE 169. GERMANY ROBOTICS MARKET SIZE, BY MOBILITY, 2018-2030 (USD MILLION)
  • TABLE 170. GERMANY ROBOTICS MARKET SIZE, BY APPLICATION, 2018-2030 (USD MILLION)
  • TABLE 171. GERMANY ROBOTICS MARKET SIZE, BY END-USE INDUSTRY, 2018-2030 (USD MILLION)
  • TABLE 172. ISRAEL ROBOTICS MARKET SIZE, BY PAYLOAD CAPACITY, 2018-2030 (USD MILLION)
  • TABLE 173. ISRAEL ROBOTICS MARKET SIZE, BY ROBOT TYPE, 2018-2030 (USD MILLION)
  • TABLE 174. ISRAEL ROBOTICS MARKET SIZE, BY MOBILITY, 2018-2030 (USD MILLION)
  • TABLE 175. ISRAEL ROBOTICS MARKET SIZE, BY APPLICATION, 2018-2030 (USD MILLION)
  • TABLE 176. ISRAEL ROBOTICS MARKET SIZE, BY END-USE INDUSTRY, 2018-2030 (USD MILLION)
  • TABLE 177. ITALY ROBOTICS MARKET SIZE, BY PAYLOAD CAPACITY, 2018-2030 (USD MILLION)
  • TABLE 178. ITALY ROBOTICS MARKET SIZE, BY ROBOT TYPE, 2018-2030 (USD MILLION)
  • TABLE 179. ITALY ROBOTICS MARKET SIZE, BY MOBILITY, 2018-2030 (USD MILLION)
  • TABLE 180. ITALY ROBOTICS MARKET SIZE, BY APPLICATION, 2018-2030 (USD MILLION)
  • TABLE 181. ITALY ROBOTICS MARKET SIZE, BY END-USE INDUSTRY, 2018-2030 (USD MILLION)
  • TABLE 182. NETHERLANDS ROBOTICS MARKET SIZE, BY PAYLOAD CAPACITY, 2018-2030 (USD MILLION)
  • TABLE 183. NETHERLANDS ROBOTICS MARKET SIZE, BY ROBOT TYPE, 2018-2030 (USD MILLION)
  • TABLE 184. NETHERLANDS ROBOTICS MARKET SIZE, BY MOBILITY, 2018-2030 (USD MILLION)
  • TABLE 185. NETHERLANDS ROBOTICS MARKET SIZE, BY APPLICATION, 2018-2030 (USD MILLION)
  • TABLE 186. NETHERLANDS ROBOTICS MARKET SIZE, BY END-USE INDUSTRY, 2018-2030 (USD MILLION)
  • TABLE 187. NIGERIA ROBOTICS MARKET SIZE, BY PAYLOAD CAPACITY, 2018-2030 (USD MILLION)
  • TABLE 188. NIGERIA ROBOTICS MARKET SIZE, BY ROBOT TYPE, 2018-2030 (USD MILLION)
  • TABLE 189. NIGERIA ROBOTICS MARKET SIZE, BY MOBILITY, 2018-2030 (USD MILLION)
  • TABLE 190. NIGERIA ROBOTICS MARKET SIZE, BY APPLICATION, 2018-2030 (USD MILLION)
  • TABLE 191. NIGERIA ROBOTICS MARKET SIZE, BY END-USE INDUSTRY, 2018-2030 (USD MILLION)
  • TABLE 192. NORWAY ROBOTICS MARKET SIZE, BY PAYLOAD CAPACITY, 2018-2030 (USD MILLION)
  • TABLE 193. NORWAY ROBOTICS MARKET SIZE, BY ROBOT TYPE, 2018-2030 (USD MILLION)
  • TABLE 194. NORWAY ROBOTICS MARKET SIZE, BY MOBILITY, 2018-2030 (USD MILLION)
  • TABLE 195. NORWAY ROBOTICS MARKET SIZE, BY APPLICATION, 2018-2030 (USD MILLION)
  • TABLE 196. NORWAY ROBOTICS MARKET SIZE, BY END-USE INDUSTRY, 2018-2030 (USD MILLION)
  • TABLE 197. POLAND ROBOTICS MARKET SIZE, BY PAYLOAD CAPACITY, 2018-2030 (USD MILLION)
  • TABLE 198. POLAND ROBOTICS MARKET SIZE, BY ROBOT TYPE, 2018-2030 (USD MILLION)
  • TABLE 199. POLAND ROBOTICS MARKET SIZE, BY MOBILITY, 2018-2030 (USD MILLION)
  • TABLE 200. POLAND ROBOTICS MARKET SIZE, BY APPLICATION, 2018-2030 (USD MILLION)
  • TABLE 201. POLAND ROBOTICS MARKET SIZE, BY END-USE INDUSTRY, 2018-2030 (USD MILLION)
  • TABLE 202. QATAR ROBOTICS MARKET SIZE, BY PAYLOAD CAPACITY, 2018-2030 (USD MILLION)
  • TABLE 203. QATAR ROBOTICS MARKET SIZE, BY ROBOT TYPE, 2018-2030 (USD MILLION)
  • TABLE 204. QATAR ROBOTICS MARKET SIZE, BY MOBILITY, 2018-2030 (USD MILLION)
  • TABLE 205. QATAR ROBOTICS MARKET SIZE, BY APPLICATION, 2018-2030 (USD MILLION)
  • TABLE 206. QATAR ROBOTICS MARKET SIZE, BY END-USE INDUSTRY, 2018-2030 (USD MILLION)
  • TABLE 207. RUSSIA ROBOTICS MARKET SIZE, BY PAYLOAD CAPACITY, 2018-2030 (USD MILLION)
  • TABLE 208. RUSSIA ROBOTICS MARKET SIZE, BY ROBOT TYPE, 2018-2030 (USD MILLION)
  • TABLE 209. RUSSIA ROBOTICS MARKET SIZE, BY MOBILITY, 2018-2030 (USD MILLION)
  • TABLE 210. RUSSIA ROBOTICS MARKET SIZE, BY APPLICATION, 2018-2030 (USD MILLION)
  • TABLE 211. RUSSIA ROBOTICS MARKET SIZE, BY END-USE INDUSTRY, 2018-2030 (USD MILLION)
  • TABLE 212. SAUDI ARABIA ROBOTICS MARKET SIZE, BY PAYLOAD CAPACITY, 2018-2030 (USD MILLION)
  • TABLE 213. SAUDI ARABIA ROBOTICS MARKET SIZE, BY ROBOT TYPE, 2018-2030 (USD MILLION)
  • TABLE 214. SAUDI ARABIA ROBOTICS MARKET SIZE, BY MOBILITY, 2018-2030 (USD MILLION)
  • TABLE 215. SAUDI ARABIA ROBOTICS MARKET SIZE, BY APPLICATION, 2018-2030 (USD MILLION)
  • TABLE 216. SAUDI ARABIA ROBOTICS MARKET SIZE, BY END-USE INDUSTRY, 2018-2030 (USD MILLION)
  • TABLE 217. SOUTH AFRICA ROBOTICS MARKET SIZE, BY PAYLOAD CAPACITY, 2018-2030 (USD MILLION)
  • TABLE 218. SOUTH AFRICA ROBOTICS MARKET SIZE, BY ROBOT TYPE, 2018-2030 (USD MILLION)
  • TABLE 219. SOUTH AFRICA ROBOTICS MARKET SIZE, BY MOBILITY, 2018-2030 (USD MILLION)
  • TABLE 220. SOUTH AFRICA ROBOTICS MARKET SIZE, BY APPLICATION, 2018-2030 (USD MILLION)
  • TABLE 221. SOUTH AFRICA ROBOTICS MARKET SIZE, BY END-USE INDUSTRY, 2018-2030 (USD MILLION)
  • TABLE 222. SPAIN ROBOTICS MARKET SIZE, BY PAYLOAD CAPACITY, 2018-2030 (USD MILLION)
  • TABLE 223. SPAIN ROBOTICS MARKET SIZE, BY ROBOT TYPE, 2018-2030 (USD MILLION)
  • TABLE 224. SPAIN ROBOTICS MARKET SIZE, BY MOBILITY, 2018-2030 (USD MILLION)
  • TABLE 225. SPAIN ROBOTICS MARKET SIZE, BY APPLICATION, 2018-2030 (USD MILLION)
  • TABLE 226. SPAIN ROBOTICS MARKET SIZE, BY END-USE INDUSTRY, 2018-2030 (USD MILLION)
  • TABLE 227. SWEDEN ROBOTICS MARKET SIZE, BY PAYLOAD CAPACITY, 2018-2030 (USD MILLION)
  • TABLE 228. SWEDEN ROBOTICS MARKET SIZE, BY ROBOT TYPE, 2018-2030 (USD MILLION)
  • TABLE 229. SWEDEN ROBOTICS MARKET SIZE, BY MOBILITY, 2018-2030 (USD MILLION)
  • TABLE 230. SWEDEN ROBOTICS MARKET SIZE, BY APPLICATION, 2018-2030 (USD MILLION)
  • TABLE 231. SWEDEN ROBOTICS MARKET SIZE, BY END-USE INDUSTRY, 2018-2030 (USD MILLION)
  • TABLE 232. SWITZERLAND ROBOTICS MARKET SIZE, BY PAYLOAD CAPACITY, 2018-2030 (USD MILLION)
  • TABLE 233. SWITZERLAND ROBOTICS MARKET SIZE, BY ROBOT TYPE, 2018-2030 (USD MILLION)
  • TABLE 234. SWITZERLAND ROBOTICS MARKET SIZE, BY MOBILITY, 2018-2030 (USD MILLION)
  • TABLE 235. SWITZERLAND ROBOTICS MARKET SIZE, BY APPLICATION, 2018-2030 (USD MILLION)
  • TABLE 236. SWITZERLAND ROBOTICS MARKET SIZE, BY END-USE INDUSTRY, 2018-2030 (USD MILLION)
  • TABLE 237. TURKEY ROBOTICS MARKET SIZE, BY PAYLOAD CAPACITY, 2018-2030 (USD MILLION)
  • TABLE 238. TURKEY ROBOTICS MARKET SIZE, BY ROBOT TYPE, 2018-2030 (USD MILLION)
  • TABLE 239. TURKEY ROBOTICS MARKET SIZE, BY MOBILITY, 2018-2030 (USD MILLION)
  • TABLE 240. TURKEY ROBOTICS MARKET SIZE, BY APPLICATION, 2018-2030 (USD MILLION)
  • TABLE 241. TURKEY ROBOTICS MARKET SIZE, BY END-USE INDUSTRY, 2018-2030 (USD MILLION)
  • TABLE 242. UNITED ARAB EMIRATES ROBOTICS MARKET SIZE, BY PAYLOAD CAPACITY, 2018-2030 (USD MILLION)
  • TABLE 243. UNITED ARAB EMIRATES ROBOTICS MARKET SIZE, BY ROBOT TYPE, 2018-2030 (USD MILLION)
  • TABLE 244. UNITED ARAB EMIRATES ROBOTICS MARKET SIZE, BY MOBILITY, 2018-2030 (USD MILLION)
  • TABLE 245. UNITED ARAB EMIRATES ROBOTICS MARKET SIZE, BY APPLICATION, 2018-2030 (USD MILLION)
  • TABLE 246. UNITED ARAB EMIRATES ROBOTICS MARKET SIZE, BY END-USE INDUSTRY, 2018-2030 (USD MILLION)
  • TABLE 247. UNITED KINGDOM ROBOTICS MARKET SIZE, BY PAYLOAD CAPACITY, 2018-2030 (USD MILLION)
  • TABLE 248. UNITED KINGDOM ROBOTICS MARKET SIZE, BY ROBOT TYPE, 2018-2030 (USD MILLION)
  • TABLE 249. UNITED KINGDOM ROBOTICS MARKET SIZE, BY MOBILITY, 2018-2030 (USD MILLION)
  • TABLE 250. UNITED KINGDOM ROBOTICS MARKET SIZE, BY APPLICATION, 2018-2030 (USD MILLION)
  • TABLE 251. UNITED KINGDOM ROBOTICS MARKET SIZE, BY END-USE INDUSTRY, 2018-2030 (USD MILLION)
  • TABLE 252. ROBOTICS MARKET SHARE, BY KEY PLAYER, 2024
  • TABLE 253. ROBOTICS MARKET, FPNV POSITIONING MATRIX, 2024
目次
Product Code: MRR-4358917D6417

The Robotics Market was valued at USD 96.90 billion in 2024 and is projected to grow to USD 113.34 billion in 2025, with a CAGR of 17.62%, reaching USD 256.61 billion by 2030.

KEY MARKET STATISTICS
Base Year [2024] USD 96.90 billion
Estimated Year [2025] USD 113.34 billion
Forecast Year [2030] USD 256.61 billion
CAGR (%) 17.62%

The robotics industry is experiencing a period of unprecedented innovation and expansion, driven by rapid technological advancements and evolving market needs. In recent years, robotics has moved from being a niche area of automation to an essential component of global manufacturing, healthcare, and service sectors. This transformation is underpinned by converging technologies-from artificial intelligence and machine learning to sophisticated sensor networks-fueling new applications and unlocking performance capabilities that were once considered the realm of science fiction.

The international market is now characterized by a dynamic interplay between innovation and implementation. Companies are not only refining existing robotic solutions but also pioneering entirely new frameworks that redefine operational norms. In this complex and competitive environment, understanding the key drivers of change is critical for decision-makers seeking sustainable growth and operational efficiency. This comprehensive overview sets the stage by exploring the core elements of market evolution, strategic segmentation, regional dynamics, and competitive landscape, providing stakeholders with actionable insights to navigate a transformative era in robotics.

Transformative Shifts in the Robotics Landscape

In recent years, transformative shifts have reshaped the robotics industry, signaling a move from conventional automation to intelligent, adaptable systems. These shifts can be primarily attributed to several interrelated developments.

First, rapid technological advancements have enabled a level of precision and efficiency previously unattainable. Modern robots now incorporate not only high-precision actuators but also smart sensors and sophisticated control systems that ensure seamless operations even in complex environments. Second, integration of digital data analytics has provided unprecedented insights into operational performance, making it possible to optimize processes in real time. The emergence of digital twins and real-time monitoring systems has further accelerated the shift toward digitally enhanced robotics solutions.

Another significant change is the convergence of robotics with emerging technologies such as AI, machine learning, and the Internet of Things (IoT). This convergence is redefining what robots can do; for example, predictive maintenance and autonomous decision-making are no longer futuristic concepts but tangible benefits of modern robotic systems. Additionally, cost reductions in hardware and increased scalability of software solutions have democratized access, enabling even mid-sized enterprises to deploy robotics at scale.

These transformative trends are not just technological impulses but strategic imperatives that drive enhanced productivity, flexibility, and safety across sectors. As companies revise their operational blueprints, the emphasis on integrating robotics with broader digital strategies is growing. Overall, the landscape is marked by increased collaboration between technology providers, end-users, and regulatory bodies, ensuring that innovation continues to align with practical, market-driven needs.

Key Segmentation Insights in Robotics

A nuanced understanding of the robotics market is best achieved through a holistic examination of key segmentation factors. The industry has been segmented based on payload capacity, where distinctions are drawn among Large Payload Robots that handle more than 50 kilograms of load, Medium Payload Robots designed for those handling between 10 and 50 kilograms, and Small Payload Robots tailored for loads under 10 kilograms. Each payload category offers unique benefits and challenges, influencing design, application, and energy requirements.

From the perspective of robot type, the market encompasses a wide variety of systems. In-depth studies have considered Articulated Robots known for their flexible joints, Automated Guided Vehicles that excel in predetermined path navigation, Autonomous Mobile Robots that offer self-directed movement, Cartesian Robots with their linear motion, Collaborative Robots engineered for safe human-machine interaction, Delta Robots recognized for their high-speed capabilities, Humanoid Robots which mimic human-like movements, and SCARA Robots favored for their precision in assembly lines. This broad array of types reflects the diverse array of operational needs across multiple applications.

Mobility also serves as a critical segmentation criterion. Fixed Robots, which are permanently stationed in one location, provide stability and consistency in repetitive tasks, whereas Mobile Robots offer versatility and adaptability by moving across various locations, thus addressing the needs of dynamic work environments.

Further segmentation based on application reveals significant diversity in end-use scenarios. Whether it is for ascertaining precision in assembling and disassembling operations, ensuring comprehensive inspection and quality testing, streamlining material handling tasks, automating packaging and labeling processes, executing painting and coating with uniformity, or performing welding and soldering with exactitude, each application is governed by specific technological requisites.

Finally, segmentation by end-use industry provides a clearer picture of market penetration. The robotics market serves a broad range of industries including Academics and Education, where robots are used for research and interactive learning; Aerospace and Defense, with stringent performance and reliability criteria; Agriculture, enhancing productivity through automation; Automotive, characterized by high-volume production and assembly; Chemical and Construction sectors, which demand robust and specialized solutions; Electronics, Food and Beverage, Healthcare, and Logistics and Supply Chain, where efficiency and precision are paramount; as well as Metal and Machinery and Retail, which require customized robotic interventions. The ability to address such a diverse spectrum of requirements elucidates the depth and adaptability of modern robotic solutions.

Based on Payload Capacity, market is studied across Large Payload Robots (Above 50 Kg), Medium Payload Robots (10-50 Kg), and Small Payload Robots (Below 10 Kg).

Based on Robot Type, market is studied across Articulated Robots, Automated Guided Vehicles, Autonomous Mobile Robots, Cartesian Robots, Collaborative Robots, Delta Robots, Humanoid Robots, and SCARA Robots.

Based on Mobility, market is studied across Fixed Robots and Mobile Robots.

Based on Application, market is studied across Assembling & Disassembling, Inspection & Quality Testing, Material Handling, Packaging & Labeling, Painting & Coating, and Welding & Soldering.

Based on End-Use Industry, market is studied across Academics & Education, Aerospace & Defense, Agriculture, Automotive, Chemical, Construction, Electronics, Food & Beverage, Healthcare, Logistics & Supply Chain, Metal & Machinery, and Retail.

Key Regional Insights Shaping Market Dynamics

Regional dynamics play a pivotal role in the evolution of the robotics industry, with distinct trends emerging in different parts of the world that together contribute to the global growth trajectory. In the Americas, technological innovation is rapidly accelerating, driven by strong investments in research and development and an entrepreneurial ecosystem that embraces advanced manufacturing and digitalization. These trends have fostered an environment in which robotics integration is increasingly becoming a competitive necessity.

In the Europe, Middle East & Africa region, a strong focus on automation and sustainability is accompanied by rigorous regulatory standards that ensure quality and safety. This region is witnessing a steady uptake of robotics, significantly bolstered by initiatives aimed at revitalizing manufacturing processes and enhancing operational efficiencies. Collaborative environments in these areas promote extensive partnerships between technology providers and end-users, ensuring that innovations are tailored to meet both localized and global requirements.

The Asia-Pacific region stands out as a powerhouse of manufacturing and industrial growth. Here, the sheer scale of production, combined with rapid industrialization and technology adoption, creates a fertile ground for robotics applications across sectors. The integration of robotics in manufacturing lines, supply chain logistics, and quality assurance is driven by the demand for speed and precision, making this region a leading force in shaping the market's future. Additionally, government initiatives in several Asia-Pacific countries actively support innovation and infrastructure development, further accelerating the deployment and sophistication of robotic solutions.

Each region, with its distinct economic landscape and regulatory frameworks, contributes uniquely to the global diffusion of robotics technologies, highlighting not only opportunities for localized growth but also the interdependent nature of the market on a worldwide scale.

Based on Region, market is studied across Americas, Asia-Pacific, and Europe, Middle East & Africa. The Americas is further studied across Argentina, Brazil, Canada, Mexico, and United States. The United States is further studied across California, Florida, Illinois, New York, Ohio, Pennsylvania, and Texas. The Asia-Pacific is further studied across Australia, China, India, Indonesia, Japan, Malaysia, Philippines, Singapore, South Korea, Taiwan, Thailand, and Vietnam. The Europe, Middle East & Africa is further studied across Denmark, Egypt, Finland, France, Germany, Israel, Italy, Netherlands, Nigeria, Norway, Poland, Qatar, Russia, Saudi Arabia, South Africa, Spain, Sweden, Switzerland, Turkey, United Arab Emirates, and United Kingdom.

Key Companies Pioneering Robotics Advancements

The competitive landscape of the robotics market is characterized by a robust presence of established leaders and innovative newcomers all striving to push the boundaries of technology. Industry pioneers such as ABB Ltd., Autonomous Solutions, Inc., and Boston Dynamics, Inc. have long been at the forefront of robotics development, driving innovation through extensive research and exemplary engineering expertise. These leaders are complemented by companies like Clearpath Robotics, Inc. and Comau S.p.A. which have contributed significantly to elevating operational efficiencies and automation precision.

In addition, global powerhouses including Denso Corporation, Fanuc Corporation, and iRobot Corporation continue to set high standards in production, performance, and reliability. The contributions of companies such as Kawasaki Heavy Industries, Ltd., KUKA AG, and Mabi Robotics AG have further enriched the industry by introducing solutions that combine versatility with advanced technological integrations. Noteworthy innovators like Mitsubishi Electric Corporation and NVIDIA Corporation have propelled the functionality of robotics through cutting-edge software integrations and advanced computing capabilities.

Other influential players-such as Omron Corporation, Panasonic Holdings Corporation, and Rethink Robotics GmbH-have played vital roles in expanding the application domains of robotics, seamlessly integrating them into diverse industrial settings. Further, Robert Bosch GmbH, Seiko Epson Corporation, and Staubli International AG have consistently delivered products known for their reliability and precision. Companies that contribute to groundbreaking research and solutions include Stryker Corporation, Teradyne, Inc., and Toshiba Corporation. In recent years, industry leaders like Universal Robots A/S, Yamaha Motor Co. Ltd, Yaskawa Electric Corporation, and Zebra Technologies Corporation have emerged as significant contributors, continuously pushing the boundaries between human and machine collaboration.

This collective drive from both legacy firms and modern innovators is instrumental in shaping breakthrough technologies, optimizing production lines, and setting strategic benchmarks that influence not just the robotics industry but the broader technological and manufacturing paradigms worldwide.

The report delves into recent significant developments in the Robotics Market, highlighting leading vendors and their innovative profiles. These include ABB Ltd., Autonomous Solutions, Inc., Boston Dynamics, Inc., Clearpath Robotics, Inc., Comau S.p.A., Denso Corporation, Fanuc Corporation, iRobot Corporation, Kawasaki Heavy Industries, Ltd., KUKA AG, Mabi Robotics AG, Mitsubishi Electric Corporation, NVIDIA Corporation, Omron Corporation, Panasonic Holdings Corporation, Rethink Robotics GmbH, Robert Bosch GmbH, Seiko Epson Corporation, Staubli International AG, Stryker Corporation, Teradyne, Inc., Toshiba Corporation, Universal Robots A/S, Yamaha Motor Co. Ltd, Yaskawa Electric Corporation, and Zebra Technologies Corporation. Actionable Recommendations for Industry Leaders

To maintain a competitive edge and harness the full potential of evolving robotics technologies, industry leaders should consider a series of targeted, actionable strategies. First, it is crucial to invest in continuous research and development aimed at integrating robotics with emerging trends such as artificial intelligence, machine learning, and IoT connectivity. Companies that proactively embrace advanced algorithms and data analytics can significantly enhance the efficiency and responsiveness of robotic systems.

Another key recommendation is the importance of strategic partnerships. Collaborating with technology innovators, academic institutions, and even regulatory bodies can foster a more integrated approach to problem-solving and technology adoption. Such alliances not only facilitate access to cutting-edge research but also support faster implementation cycles and improved integration of robotics in diverse operational contexts.

It is equally important to develop scalable and adaptable robotic systems, tailored to the inherent complexities of various applications and industry-specific requirements. By adopting modular design principles and embedding flexibility within robotic architectures, companies can better navigate fluctuating market demands and customize solutions to meet precise operational needs.

Furthermore, nurturing a customer-centric approach by actively soliciting feedback and engaging in continuous dialogue with end-users will help ensure that deployed robotic solutions address real-world challenges effectively. Emphasis should also be laid on employee training and skill development to maximize the potential of collaborative robots, thereby fostering an environment of co-evolution between human workforces and robotic systems.

Finally, leaders must pay keen attention to global market trends and regional dynamics as these factors influence customer behavior and competitive positioning. Well-informed decision-making, grounded in comprehensive market analytics, will empower companies to anticipate shifts, optimize operations, and unlock new revenue streams in this highly dynamic industry.

Conclusion: Navigating the Future of Robotics

In summary, this multifaceted analysis underscores the transformative journey of the robotics industry. The convergence of technological advancements, strategic segmentation, and evolving regional dynamics is driving a sweeping transformation that holds promise for enhanced productivity, innovation, and operational excellence.

As robotics becomes increasingly integral to industrial and service applications, the need for strategic foresight and agile adaptation grows ever more important. Stakeholders must leverage these insights to navigate the complexities of market segmentation, capitalize on regional strengths, and engage with leading industry innovators. The interplay between advanced robotics technology and emerging digital trends sets the stage for a future where efficiency, customization, and sustainability are at the forefront of manufacturing and service excellence.

This comprehensive exploration serves as a guiding framework, providing industry participants with both a macro and micro view of the evolving landscape, while empowering them to make informed, strategic decisions that will shape the future of robotics.

Table of Contents

1. Preface

  • 1.1. Objectives of the Study
  • 1.2. Market Segmentation & Coverage
  • 1.3. Years Considered for the Study
  • 1.4. Currency & Pricing
  • 1.5. Language
  • 1.6. Stakeholders

2. Research Methodology

  • 2.1. Define: Research Objective
  • 2.2. Determine: Research Design
  • 2.3. Prepare: Research Instrument
  • 2.4. Collect: Data Source
  • 2.5. Analyze: Data Interpretation
  • 2.6. Formulate: Data Verification
  • 2.7. Publish: Research Report
  • 2.8. Repeat: Report Update

3. Executive Summary

4. Market Overview

5. Market Insights

  • 5.1. Market Dynamics
    • 5.1.1. Drivers
      • 5.1.1.1. Increasing adoption of robotics in manufacturing and industrial applications
      • 5.1.1.2. Growing demand for automation across healthcare and life sciences
      • 5.1.1.3. Surge in E-commerce and warehousing contributing to higher robotics deployment
    • 5.1.2. Restraints
      • 5.1.2.1. High Initial Investment and Implementation Costs
    • 5.1.3. Opportunities
      • 5.1.3.1. Integration of AI-driven robotics solutions for the industrial application
      • 5.1.3.2. Emergence of collaborative robots in small and medium enterprises
    • 5.1.4. Challenges
      • 5.1.4.1. Complex regulatory environments and varying international compliance standards in robotics
  • 5.2. Market Segmentation Analysis
  • 5.3. Porter's Five Forces Analysis
    • 5.3.1. Threat of New Entrants
    • 5.3.2. Threat of Substitutes
    • 5.3.3. Bargaining Power of Customers
    • 5.3.4. Bargaining Power of Suppliers
    • 5.3.5. Industry Rivalry
  • 5.4. PESTLE Analysis
    • 5.4.1. Political
    • 5.4.2. Economic
    • 5.4.3. Social
    • 5.4.4. Technological
    • 5.4.5. Legal
    • 5.4.6. Environmental

6. Robotics Market, by Payload Capacity

  • 6.1. Introduction
  • 6.2. Large Payload Robots (Above 50 Kg)
  • 6.3. Medium Payload Robots (10-50 Kg)
  • 6.4. Small Payload Robots (Below 10 Kg)

7. Robotics Market, by Robot Type

  • 7.1. Introduction
  • 7.2. Articulated Robots
  • 7.3. Automated Guided Vehicles
  • 7.4. Autonomous Mobile Robots
  • 7.5. Cartesian Robots
  • 7.6. Collaborative Robots
  • 7.7. Delta Robots
  • 7.8. Humanoid Robots
  • 7.9. SCARA Robots

8. Robotics Market, by Mobility

  • 8.1. Introduction
  • 8.2. Fixed Robots
  • 8.3. Mobile Robots

9. Robotics Market, by Application

  • 9.1. Introduction
  • 9.2. Assembling & Disassembling
  • 9.3. Inspection & Quality Testing
  • 9.4. Material Handling
  • 9.5. Packaging & Labeling
  • 9.6. Painting & Coating
  • 9.7. Welding & Soldering

10. Robotics Market, by End-Use Industry

  • 10.1. Introduction
  • 10.2. Academics & Education
  • 10.3. Aerospace & Defense
  • 10.4. Agriculture
  • 10.5. Automotive
  • 10.6. Chemical
  • 10.7. Construction
  • 10.8. Electronics
  • 10.9. Food & Beverage
  • 10.10. Healthcare
  • 10.11. Logistics & Supply Chain
  • 10.12. Metal & Machinery
  • 10.13. Retail

11. Americas Robotics Market

  • 11.1. Introduction
  • 11.2. Argentina
  • 11.3. Brazil
  • 11.4. Canada
  • 11.5. Mexico
  • 11.6. United States

12. Asia-Pacific Robotics Market

  • 12.1. Introduction
  • 12.2. Australia
  • 12.3. China
  • 12.4. India
  • 12.5. Indonesia
  • 12.6. Japan
  • 12.7. Malaysia
  • 12.8. Philippines
  • 12.9. Singapore
  • 12.10. South Korea
  • 12.11. Taiwan
  • 12.12. Thailand
  • 12.13. Vietnam

13. Europe, Middle East & Africa Robotics Market

  • 13.1. Introduction
  • 13.2. Denmark
  • 13.3. Egypt
  • 13.4. Finland
  • 13.5. France
  • 13.6. Germany
  • 13.7. Israel
  • 13.8. Italy
  • 13.9. Netherlands
  • 13.10. Nigeria
  • 13.11. Norway
  • 13.12. Poland
  • 13.13. Qatar
  • 13.14. Russia
  • 13.15. Saudi Arabia
  • 13.16. South Africa
  • 13.17. Spain
  • 13.18. Sweden
  • 13.19. Switzerland
  • 13.20. Turkey
  • 13.21. United Arab Emirates
  • 13.22. United Kingdom

14. Competitive Landscape

  • 14.1. Market Share Analysis, 2024
  • 14.2. FPNV Positioning Matrix, 2024
  • 14.3. Competitive Scenario Analysis
    • 14.3.1. Ambi Robotics unveils PRIME-1 to revolutionize warehouse operations
    • 14.3.2. Bobcat and Doosan Robotics merge to accelerate developments in autonomous construction machinery
    • 14.3.3. Serve Robotics and Magna partnered to enhance robot production for uber eats expansion
  • 14.4. Strategy Analysis & Recommendation

Companies Mentioned

  • 1. ABB Ltd.
  • 2. Autonomous Solutions, Inc.
  • 3. Boston Dynamics, Inc.
  • 4. Clearpath Robotics, Inc.
  • 5. Comau S.p.A.
  • 6. Denso Corporation
  • 7. Fanuc Corporation
  • 8. iRobot Corporation
  • 9. Kawasaki Heavy Industries, Ltd.
  • 10. KUKA AG
  • 11. Mabi Robotics AG
  • 12. Mitsubishi Electric Corporation
  • 13. NVIDIA Corporation
  • 14. Omron Corporation
  • 15. Panasonic Holdings Corporation
  • 16. Rethink Robotics GmbH
  • 17. Robert Bosch GmbH
  • 18. Seiko Epson Corporation
  • 19. Staubli International AG
  • 20. Stryker Corporation
  • 21. Teradyne, Inc.
  • 22. Toshiba Corporation
  • 23. Universal Robots A/S
  • 24. Yamaha Motor Co. Ltd
  • 25. Yaskawa Electric Corporation
  • 26. Zebra Technologies Corporation