|
|
市場調査レポート
商品コード
1677152
紅参市場:産地、形態、流通チャネル、用途別-2025-2030年世界予測Red Ginseng Market by Source, Form, Distribution Channel, Application - Global Forecast 2025-2030 |
||||||

|
|||||||
カスタマイズ可能
適宜更新あり
|
|||||||

| 紅参市場:産地、形態、流通チャネル、用途別-2025-2030年世界予測 |
|
出版日: 2025年03月09日
発行: 360iResearch
ページ情報: 英文 199 Pages
納期: 即日から翌営業日
|

全表示
- 概要
- 図表
- 目次
紅参市場の2024年の市場規模は3億2,347万米ドルで、2025年には3億3,644万米ドルに成長し、CAGRは4.14%、2030年には4億1,280万米ドルに達すると予測されています。
| 主な市場の統計 | |
|---|---|
| 基準年 2024 | 3億2,347万米ドル |
| 推定年 2025 | 3億3,644万米ドル |
| 予測年 2030 | 4億1,280万米ドル |
| CAGR(%) | 4.14% |
紅参は長い間、その豊かな歴史と治療効果で讃えられてきました。健康とウェルネスに対する消費者の関心が世界的に高まる中、紅参は伝統的な習慣と現代のウェルネス動向の両方に共鳴する高級食材として台頭してきました。近年、この市場は、消費者が自然療法、アダプトジェニック効果、科学的裏付けのある栄養サポートを求めるにつれて盛り上がりを見せています。本レポートでは、紅参市場を支える力学を掘り下げ、業界に付加価値を与える市場パラメータの進化について概説します。多様な地域と消費者セグメントにわたり、進化する動向は紅参への信頼を高めるだけでなく、供給、流通、製品イノベーションにも変化をもたらしています。本書は定性的考察と定量的データに裏打ちされ、競争激化する健康情勢の中で紅参を有利な機会として位置づける包括的な概観を提供しています。業界の利害関係者は、市場でのリーダーシップを維持し、消費者の需要に対応するために、調査への投資と技術革新をこれまで以上に迫られています。この分析は、消費者の態度の変化と堅調な市場ファンダメンタルズが一体となって、この活気に満ちた進化するセクターの持続可能な成長をどのように促進するかを理解するための基礎となるものです。
紅参市場の変革
急速に進化する今日の世界マーケットプレースにおいて、紅参は、マーケットの構造や消費のあり方を再定義するような変革的な変化を遂げています。生産方法におけるダイナミックな進歩が、天然健康サプリメントに対する消費者の意識の高まりと相まって、市場戦略を全面的に方向転換させました。戦略的プレーヤーは、製品の品質と入手しやすさを向上させるために新技術と流通モデルを活用する一方、紅参に関連する多くの健康強調表示を厳密な科学的調査によって裏付けています。こうした進歩は、プレミアム品質と多様な製剤に対する消費者の強い志向に後押しされ、製品範囲の拡大と技術革新につながっています。デジタル化によってオンライン化が促進され、購買行動が変化するにつれて、従来の販売形態によって定義されていた境界線が引き直されつつあります。さらに、規制基準の進化と持続可能性への注目の高まりにより、市場のリーダー企業は、倫理的な調達と生産慣行を確保しながら事業を最適化する必要に迫られています。その結果、消費者行動が変容していることは、市場パフォーマンス指標の高まりや、研究開発イニシアティブへの投資の急増によって証明されています。こうした動向は、弾力性と適応性を併せ持つエコシステムを構築し、紅参セクターの競争力学と長期的展望に決定的な変化をもたらしています。
紅参の主要セグメンテーション洞察
セグメンテーションを詳細に調査した結果、紅参市場は微妙で多面的であることが確認されました。分析はまず製品の調達先から始まる。市場は調達先に基づいてセグメントに分けられ、栽培品目と野生品目の両方を調査対象としています。栽培方法、環境の影響、収穫条件の固有の違いは、製品の品質と消費者の認識に直接影響します。さらに、市場は紅参の形態に基づいて評価されます。製品はカプセル、液体エキス、粉末、錠剤に細かく分類され、それぞれの形態が消費者の嗜好や使用シナリオに対応しています。消費方法だけでなく、市場は流通チャネルによってもさらに区別されます。オフラインの小売チャネルとオンラインチャネルの両方を精査しています。オフライン小売には、薬局・ドラッグストア、ハーブ専門店、健康専門店、スーパーマーケット、ハイパーマーケットが含まれ、消費者は高品質な製品を幅広く入手することができます。オフライン戦略を補完するオンライン・チャネルは、ブランド所有のウェブサイトとeコマース・プラットフォームにまたがり、デジタル・リーチと利便性を確保しています。紅参は、栄養補助食品や機能性食品、飲食品加工、医薬品、パーソナルケア製品など、さまざまな用途で使用されています。それぞれのセグメンテーション・パラメーターは、市場の異質性を強調するだけでなく、微妙な消費者行動や市場参入企業にとっての戦略的機会を明らかにします。
目次
第1章 序文
第2章 調査手法
第3章 エグゼクティブサマリー
第4章 市場の概要
第5章 市場洞察
- 市場力学
- 促進要因
- 世界中で自然派・オーガニック健康製品への嗜好が増加
- 科学的に検証された紅参の健康効果に対する消費者の意識の高まり
- 機能性食品、栄養補助食品、飲料における紅参の統合の拡大
- 伝統的なハーブ療法を促進する政府の取り組みと政策
- 抑制要因
- 高い生産コストと原材料の季節変動
- 機会
- 紅参の抽出および処理技術の技術的進歩
- 機能性栄養補助食品の革新の研究開発への投資と資金提供
- 課題
- 安定した農業生産性と偽造品の流通に関連する環境問題
- 促進要因
- 市場セグメンテーション分析
- 形態:吸収が速く、統合が容易なため、紅参の液体製剤の需要が高まっています。
- 応用:栄養補助食品および機能性食品における紅参の使用増加
- ポーターのファイブフォース分析
- PESTEL分析
- 政治的
- 経済
- 社会
- 技術的
- 法律上
- 環境
第6章 紅参市場:ソース別
- 栽培
- 野生
第7章 紅参市場:形態別
- カプセル
- 液体
- 粉
- タブレット
第8章 紅参市場:流通チャネル別
- オフライン小売
- 薬局・ドラッグストア
- ハーブ&健康食品専門店
- スーパーマーケットとハイパーマーケット
- オンラインチャンネル
- ブランド所有のウェブサイト
- eコマースプラットフォーム
第9章 紅参市場:用途別
- 栄養補助食品と機能性食品
- 飲食品加工
- 医療用途
- パーソナルケア製品
第10章 南北アメリカの紅参市場
- アルゼンチン
- ブラジル
- カナダ
- メキシコ
- 米国
第11章 アジア太平洋地域の紅参市場
- オーストラリア
- 中国
- インド
- インドネシア
- 日本
- マレーシア
- フィリピン
- シンガポール
- 韓国
- 台湾
- タイ
- ベトナム
第12章 欧州・中東・アフリカの紅参市場
- デンマーク
- エジプト
- フィンランド
- フランス
- ドイツ
- イスラエル
- イタリア
- オランダ
- ナイジェリア
- ノルウェー
- ポーランド
- カタール
- ロシア
- サウジアラビア
- 南アフリカ
- スペイン
- スウェーデン
- スイス
- トルコ
- アラブ首長国連邦
- 英国
第13章 競合情勢
- 市場シェア分析, 2024
- FPNVポジショニングマトリックス, 2024
- 競合シナリオ分析
- 戦略分析と提言
企業一覧
- Alpha Herbals LLC
- Blue Ridge Ginseng LLC
- COR Ginseng Solutions Ltd.
- Elite Herbal Technologies Inc.
- Essence of Ginseng Corp.
- Evergreen Ginseng Co.
- Ginseng Bioactive Solutions
- Ginseng Health Co.
- Ginseng Life Sciences Inc.
- Ginseng Worldwide Ltd.
- Global Herbal Solutions Inc.
- Herbal Synergy Corp.
- Heritage Herbal Extracts Ltd.
- Highland Ginseng International
- Holistica Nutraceuticals LLC
- Korean Red Ginseng Corporation
- Nature's Best Ginseng International
- Nature's Ginseng Holdings
- Omega Herbal Sciences Inc.
- Panax Pro Inc.
- Prime Botanical Therapeutics LLC
- Prime Essence Herbs Inc.
- Prime Ginseng Supplies
- Prime Harvest Herbs Inc.
- Prime Nature Extracts
- Pure Nature Ginseng Ltd.
- Red Ginseng Empowerment Corp.
- Red Ginseng Innovations Inc.
- Superior Ginseng Tech Inc.
- Terra Ginseng Enterprises
- Vital Red Ginseng Ltd.
- Zen Ginseng Industries Ltd.
- Zenith Herbal Products Inc.
LIST OF FIGURES
- FIGURE 1. RED GINSENG MARKET MULTI-CURRENCY
- FIGURE 2. RED GINSENG MARKET MULTI-LANGUAGE
- FIGURE 3. RED GINSENG MARKET RESEARCH PROCESS
- FIGURE 4. RED GINSENG MARKET SIZE, 2024 VS 2030
- FIGURE 5. GLOBAL RED GINSENG MARKET SIZE, 2018-2030 (USD MILLION)
- FIGURE 6. GLOBAL RED GINSENG MARKET SIZE, BY REGION, 2024 VS 2025 VS 2030 (USD MILLION)
- FIGURE 7. GLOBAL RED GINSENG MARKET SIZE, BY COUNTRY, 2024 VS 2025 VS 2030 (USD MILLION)
- FIGURE 8. GLOBAL RED GINSENG MARKET SIZE, BY SOURCE, 2024 VS 2030 (%)
- FIGURE 9. GLOBAL RED GINSENG MARKET SIZE, BY SOURCE, 2024 VS 2025 VS 2030 (USD MILLION)
- FIGURE 10. GLOBAL RED GINSENG MARKET SIZE, BY FORM, 2024 VS 2030 (%)
- FIGURE 11. GLOBAL RED GINSENG MARKET SIZE, BY FORM, 2024 VS 2025 VS 2030 (USD MILLION)
- FIGURE 12. GLOBAL RED GINSENG MARKET SIZE, BY DISTRIBUTION CHANNEL, 2024 VS 2030 (%)
- FIGURE 13. GLOBAL RED GINSENG MARKET SIZE, BY DISTRIBUTION CHANNEL, 2024 VS 2025 VS 2030 (USD MILLION)
- FIGURE 14. GLOBAL RED GINSENG MARKET SIZE, BY APPLICATION, 2024 VS 2030 (%)
- FIGURE 15. GLOBAL RED GINSENG MARKET SIZE, BY APPLICATION, 2024 VS 2025 VS 2030 (USD MILLION)
- FIGURE 16. AMERICAS RED GINSENG MARKET SIZE, BY COUNTRY, 2024 VS 2030 (%)
- FIGURE 17. AMERICAS RED GINSENG MARKET SIZE, BY COUNTRY, 2024 VS 2025 VS 2030 (USD MILLION)
- FIGURE 18. UNITED STATES RED GINSENG MARKET SIZE, BY STATE, 2024 VS 2030 (%)
- FIGURE 19. UNITED STATES RED GINSENG MARKET SIZE, BY STATE, 2024 VS 2025 VS 2030 (USD MILLION)
- FIGURE 20. ASIA-PACIFIC RED GINSENG MARKET SIZE, BY COUNTRY, 2024 VS 2030 (%)
- FIGURE 21. ASIA-PACIFIC RED GINSENG MARKET SIZE, BY COUNTRY, 2024 VS 2025 VS 2030 (USD MILLION)
- FIGURE 22. EUROPE, MIDDLE EAST & AFRICA RED GINSENG MARKET SIZE, BY COUNTRY, 2024 VS 2030 (%)
- FIGURE 23. EUROPE, MIDDLE EAST & AFRICA RED GINSENG MARKET SIZE, BY COUNTRY, 2024 VS 2025 VS 2030 (USD MILLION)
- FIGURE 24. RED GINSENG MARKET SHARE, BY KEY PLAYER, 2024
- FIGURE 25. RED GINSENG MARKET, FPNV POSITIONING MATRIX, 2024
LIST OF TABLES
- TABLE 1. RED GINSENG MARKET SEGMENTATION & COVERAGE
- TABLE 2. UNITED STATES DOLLAR EXCHANGE RATE, 2018-2024
- TABLE 3. GLOBAL RED GINSENG MARKET SIZE, 2018-2030 (USD MILLION)
- TABLE 4. GLOBAL RED GINSENG MARKET SIZE, BY REGION, 2018-2030 (USD MILLION)
- TABLE 5. GLOBAL RED GINSENG MARKET SIZE, BY COUNTRY, 2018-2030 (USD MILLION)
- TABLE 6. RED GINSENG MARKET DYNAMICS
- TABLE 7. GLOBAL RED GINSENG MARKET SIZE, BY SOURCE, 2018-2030 (USD MILLION)
- TABLE 8. GLOBAL RED GINSENG MARKET SIZE, BY CULTIVATED, BY REGION, 2018-2030 (USD MILLION)
- TABLE 9. GLOBAL RED GINSENG MARKET SIZE, BY WILD, BY REGION, 2018-2030 (USD MILLION)
- TABLE 10. GLOBAL RED GINSENG MARKET SIZE, BY FORM, 2018-2030 (USD MILLION)
- TABLE 11. GLOBAL RED GINSENG MARKET SIZE, BY CAPSULES, BY REGION, 2018-2030 (USD MILLION)
- TABLE 12. GLOBAL RED GINSENG MARKET SIZE, BY LIQUID, BY REGION, 2018-2030 (USD MILLION)
- TABLE 13. GLOBAL RED GINSENG MARKET SIZE, BY POWDER, BY REGION, 2018-2030 (USD MILLION)
- TABLE 14. GLOBAL RED GINSENG MARKET SIZE, BY TABLETS, BY REGION, 2018-2030 (USD MILLION)
- TABLE 15. GLOBAL RED GINSENG MARKET SIZE, BY DISTRIBUTION CHANNEL, 2018-2030 (USD MILLION)
- TABLE 16. GLOBAL RED GINSENG MARKET SIZE, BY OFFLINE RETAIL, BY REGION, 2018-2030 (USD MILLION)
- TABLE 17. GLOBAL RED GINSENG MARKET SIZE, BY PHARMACIES & DRUGSTORES, BY REGION, 2018-2030 (USD MILLION)
- TABLE 18. GLOBAL RED GINSENG MARKET SIZE, BY SPECIALTY HERBAL & HEALTH STORES, BY REGION, 2018-2030 (USD MILLION)
- TABLE 19. GLOBAL RED GINSENG MARKET SIZE, BY SUPERMARKETS & HYPERMARKETS, BY REGION, 2018-2030 (USD MILLION)
- TABLE 20. GLOBAL RED GINSENG MARKET SIZE, BY OFFLINE RETAIL, 2018-2030 (USD MILLION)
- TABLE 21. GLOBAL RED GINSENG MARKET SIZE, BY ONLINE CHANNELS, BY REGION, 2018-2030 (USD MILLION)
- TABLE 22. GLOBAL RED GINSENG MARKET SIZE, BY BRAND-OWNED WEBSITES, BY REGION, 2018-2030 (USD MILLION)
- TABLE 23. GLOBAL RED GINSENG MARKET SIZE, BY E-COMMERCE PLATFORMS, BY REGION, 2018-2030 (USD MILLION)
- TABLE 24. GLOBAL RED GINSENG MARKET SIZE, BY ONLINE CHANNELS, 2018-2030 (USD MILLION)
- TABLE 25. GLOBAL RED GINSENG MARKET SIZE, BY APPLICATION, 2018-2030 (USD MILLION)
- TABLE 26. GLOBAL RED GINSENG MARKET SIZE, BY DIETARY SUPPLEMENTS & FUNCTIONAL FOOD, BY REGION, 2018-2030 (USD MILLION)
- TABLE 27. GLOBAL RED GINSENG MARKET SIZE, BY FOOD & BEVERAGE PROCESSING, BY REGION, 2018-2030 (USD MILLION)
- TABLE 28. GLOBAL RED GINSENG MARKET SIZE, BY MEDICINAL APPLICATION, BY REGION, 2018-2030 (USD MILLION)
- TABLE 29. GLOBAL RED GINSENG MARKET SIZE, BY PERSONAL CARE PRODUCTS, BY REGION, 2018-2030 (USD MILLION)
- TABLE 30. AMERICAS RED GINSENG MARKET SIZE, BY SOURCE, 2018-2030 (USD MILLION)
- TABLE 31. AMERICAS RED GINSENG MARKET SIZE, BY FORM, 2018-2030 (USD MILLION)
- TABLE 32. AMERICAS RED GINSENG MARKET SIZE, BY DISTRIBUTION CHANNEL, 2018-2030 (USD MILLION)
- TABLE 33. AMERICAS RED GINSENG MARKET SIZE, BY OFFLINE RETAIL, 2018-2030 (USD MILLION)
- TABLE 34. AMERICAS RED GINSENG MARKET SIZE, BY ONLINE CHANNELS, 2018-2030 (USD MILLION)
- TABLE 35. AMERICAS RED GINSENG MARKET SIZE, BY APPLICATION, 2018-2030 (USD MILLION)
- TABLE 36. AMERICAS RED GINSENG MARKET SIZE, BY COUNTRY, 2018-2030 (USD MILLION)
- TABLE 37. ARGENTINA RED GINSENG MARKET SIZE, BY SOURCE, 2018-2030 (USD MILLION)
- TABLE 38. ARGENTINA RED GINSENG MARKET SIZE, BY FORM, 2018-2030 (USD MILLION)
- TABLE 39. ARGENTINA RED GINSENG MARKET SIZE, BY DISTRIBUTION CHANNEL, 2018-2030 (USD MILLION)
- TABLE 40. ARGENTINA RED GINSENG MARKET SIZE, BY OFFLINE RETAIL, 2018-2030 (USD MILLION)
- TABLE 41. ARGENTINA RED GINSENG MARKET SIZE, BY ONLINE CHANNELS, 2018-2030 (USD MILLION)
- TABLE 42. ARGENTINA RED GINSENG MARKET SIZE, BY APPLICATION, 2018-2030 (USD MILLION)
- TABLE 43. BRAZIL RED GINSENG MARKET SIZE, BY SOURCE, 2018-2030 (USD MILLION)
- TABLE 44. BRAZIL RED GINSENG MARKET SIZE, BY FORM, 2018-2030 (USD MILLION)
- TABLE 45. BRAZIL RED GINSENG MARKET SIZE, BY DISTRIBUTION CHANNEL, 2018-2030 (USD MILLION)
- TABLE 46. BRAZIL RED GINSENG MARKET SIZE, BY OFFLINE RETAIL, 2018-2030 (USD MILLION)
- TABLE 47. BRAZIL RED GINSENG MARKET SIZE, BY ONLINE CHANNELS, 2018-2030 (USD MILLION)
- TABLE 48. BRAZIL RED GINSENG MARKET SIZE, BY APPLICATION, 2018-2030 (USD MILLION)
- TABLE 49. CANADA RED GINSENG MARKET SIZE, BY SOURCE, 2018-2030 (USD MILLION)
- TABLE 50. CANADA RED GINSENG MARKET SIZE, BY FORM, 2018-2030 (USD MILLION)
- TABLE 51. CANADA RED GINSENG MARKET SIZE, BY DISTRIBUTION CHANNEL, 2018-2030 (USD MILLION)
- TABLE 52. CANADA RED GINSENG MARKET SIZE, BY OFFLINE RETAIL, 2018-2030 (USD MILLION)
- TABLE 53. CANADA RED GINSENG MARKET SIZE, BY ONLINE CHANNELS, 2018-2030 (USD MILLION)
- TABLE 54. CANADA RED GINSENG MARKET SIZE, BY APPLICATION, 2018-2030 (USD MILLION)
- TABLE 55. MEXICO RED GINSENG MARKET SIZE, BY SOURCE, 2018-2030 (USD MILLION)
- TABLE 56. MEXICO RED GINSENG MARKET SIZE, BY FORM, 2018-2030 (USD MILLION)
- TABLE 57. MEXICO RED GINSENG MARKET SIZE, BY DISTRIBUTION CHANNEL, 2018-2030 (USD MILLION)
- TABLE 58. MEXICO RED GINSENG MARKET SIZE, BY OFFLINE RETAIL, 2018-2030 (USD MILLION)
- TABLE 59. MEXICO RED GINSENG MARKET SIZE, BY ONLINE CHANNELS, 2018-2030 (USD MILLION)
- TABLE 60. MEXICO RED GINSENG MARKET SIZE, BY APPLICATION, 2018-2030 (USD MILLION)
- TABLE 61. UNITED STATES RED GINSENG MARKET SIZE, BY SOURCE, 2018-2030 (USD MILLION)
- TABLE 62. UNITED STATES RED GINSENG MARKET SIZE, BY FORM, 2018-2030 (USD MILLION)
- TABLE 63. UNITED STATES RED GINSENG MARKET SIZE, BY DISTRIBUTION CHANNEL, 2018-2030 (USD MILLION)
- TABLE 64. UNITED STATES RED GINSENG MARKET SIZE, BY OFFLINE RETAIL, 2018-2030 (USD MILLION)
- TABLE 65. UNITED STATES RED GINSENG MARKET SIZE, BY ONLINE CHANNELS, 2018-2030 (USD MILLION)
- TABLE 66. UNITED STATES RED GINSENG MARKET SIZE, BY APPLICATION, 2018-2030 (USD MILLION)
- TABLE 67. UNITED STATES RED GINSENG MARKET SIZE, BY STATE, 2018-2030 (USD MILLION)
- TABLE 68. ASIA-PACIFIC RED GINSENG MARKET SIZE, BY SOURCE, 2018-2030 (USD MILLION)
- TABLE 69. ASIA-PACIFIC RED GINSENG MARKET SIZE, BY FORM, 2018-2030 (USD MILLION)
- TABLE 70. ASIA-PACIFIC RED GINSENG MARKET SIZE, BY DISTRIBUTION CHANNEL, 2018-2030 (USD MILLION)
- TABLE 71. ASIA-PACIFIC RED GINSENG MARKET SIZE, BY OFFLINE RETAIL, 2018-2030 (USD MILLION)
- TABLE 72. ASIA-PACIFIC RED GINSENG MARKET SIZE, BY ONLINE CHANNELS, 2018-2030 (USD MILLION)
- TABLE 73. ASIA-PACIFIC RED GINSENG MARKET SIZE, BY APPLICATION, 2018-2030 (USD MILLION)
- TABLE 74. ASIA-PACIFIC RED GINSENG MARKET SIZE, BY COUNTRY, 2018-2030 (USD MILLION)
- TABLE 75. AUSTRALIA RED GINSENG MARKET SIZE, BY SOURCE, 2018-2030 (USD MILLION)
- TABLE 76. AUSTRALIA RED GINSENG MARKET SIZE, BY FORM, 2018-2030 (USD MILLION)
- TABLE 77. AUSTRALIA RED GINSENG MARKET SIZE, BY DISTRIBUTION CHANNEL, 2018-2030 (USD MILLION)
- TABLE 78. AUSTRALIA RED GINSENG MARKET SIZE, BY OFFLINE RETAIL, 2018-2030 (USD MILLION)
- TABLE 79. AUSTRALIA RED GINSENG MARKET SIZE, BY ONLINE CHANNELS, 2018-2030 (USD MILLION)
- TABLE 80. AUSTRALIA RED GINSENG MARKET SIZE, BY APPLICATION, 2018-2030 (USD MILLION)
- TABLE 81. CHINA RED GINSENG MARKET SIZE, BY SOURCE, 2018-2030 (USD MILLION)
- TABLE 82. CHINA RED GINSENG MARKET SIZE, BY FORM, 2018-2030 (USD MILLION)
- TABLE 83. CHINA RED GINSENG MARKET SIZE, BY DISTRIBUTION CHANNEL, 2018-2030 (USD MILLION)
- TABLE 84. CHINA RED GINSENG MARKET SIZE, BY OFFLINE RETAIL, 2018-2030 (USD MILLION)
- TABLE 85. CHINA RED GINSENG MARKET SIZE, BY ONLINE CHANNELS, 2018-2030 (USD MILLION)
- TABLE 86. CHINA RED GINSENG MARKET SIZE, BY APPLICATION, 2018-2030 (USD MILLION)
- TABLE 87. INDIA RED GINSENG MARKET SIZE, BY SOURCE, 2018-2030 (USD MILLION)
- TABLE 88. INDIA RED GINSENG MARKET SIZE, BY FORM, 2018-2030 (USD MILLION)
- TABLE 89. INDIA RED GINSENG MARKET SIZE, BY DISTRIBUTION CHANNEL, 2018-2030 (USD MILLION)
- TABLE 90. INDIA RED GINSENG MARKET SIZE, BY OFFLINE RETAIL, 2018-2030 (USD MILLION)
- TABLE 91. INDIA RED GINSENG MARKET SIZE, BY ONLINE CHANNELS, 2018-2030 (USD MILLION)
- TABLE 92. INDIA RED GINSENG MARKET SIZE, BY APPLICATION, 2018-2030 (USD MILLION)
- TABLE 93. INDONESIA RED GINSENG MARKET SIZE, BY SOURCE, 2018-2030 (USD MILLION)
- TABLE 94. INDONESIA RED GINSENG MARKET SIZE, BY FORM, 2018-2030 (USD MILLION)
- TABLE 95. INDONESIA RED GINSENG MARKET SIZE, BY DISTRIBUTION CHANNEL, 2018-2030 (USD MILLION)
- TABLE 96. INDONESIA RED GINSENG MARKET SIZE, BY OFFLINE RETAIL, 2018-2030 (USD MILLION)
- TABLE 97. INDONESIA RED GINSENG MARKET SIZE, BY ONLINE CHANNELS, 2018-2030 (USD MILLION)
- TABLE 98. INDONESIA RED GINSENG MARKET SIZE, BY APPLICATION, 2018-2030 (USD MILLION)
- TABLE 99. JAPAN RED GINSENG MARKET SIZE, BY SOURCE, 2018-2030 (USD MILLION)
- TABLE 100. JAPAN RED GINSENG MARKET SIZE, BY FORM, 2018-2030 (USD MILLION)
- TABLE 101. JAPAN RED GINSENG MARKET SIZE, BY DISTRIBUTION CHANNEL, 2018-2030 (USD MILLION)
- TABLE 102. JAPAN RED GINSENG MARKET SIZE, BY OFFLINE RETAIL, 2018-2030 (USD MILLION)
- TABLE 103. JAPAN RED GINSENG MARKET SIZE, BY ONLINE CHANNELS, 2018-2030 (USD MILLION)
- TABLE 104. JAPAN RED GINSENG MARKET SIZE, BY APPLICATION, 2018-2030 (USD MILLION)
- TABLE 105. MALAYSIA RED GINSENG MARKET SIZE, BY SOURCE, 2018-2030 (USD MILLION)
- TABLE 106. MALAYSIA RED GINSENG MARKET SIZE, BY FORM, 2018-2030 (USD MILLION)
- TABLE 107. MALAYSIA RED GINSENG MARKET SIZE, BY DISTRIBUTION CHANNEL, 2018-2030 (USD MILLION)
- TABLE 108. MALAYSIA RED GINSENG MARKET SIZE, BY OFFLINE RETAIL, 2018-2030 (USD MILLION)
- TABLE 109. MALAYSIA RED GINSENG MARKET SIZE, BY ONLINE CHANNELS, 2018-2030 (USD MILLION)
- TABLE 110. MALAYSIA RED GINSENG MARKET SIZE, BY APPLICATION, 2018-2030 (USD MILLION)
- TABLE 111. PHILIPPINES RED GINSENG MARKET SIZE, BY SOURCE, 2018-2030 (USD MILLION)
- TABLE 112. PHILIPPINES RED GINSENG MARKET SIZE, BY FORM, 2018-2030 (USD MILLION)
- TABLE 113. PHILIPPINES RED GINSENG MARKET SIZE, BY DISTRIBUTION CHANNEL, 2018-2030 (USD MILLION)
- TABLE 114. PHILIPPINES RED GINSENG MARKET SIZE, BY OFFLINE RETAIL, 2018-2030 (USD MILLION)
- TABLE 115. PHILIPPINES RED GINSENG MARKET SIZE, BY ONLINE CHANNELS, 2018-2030 (USD MILLION)
- TABLE 116. PHILIPPINES RED GINSENG MARKET SIZE, BY APPLICATION, 2018-2030 (USD MILLION)
- TABLE 117. SINGAPORE RED GINSENG MARKET SIZE, BY SOURCE, 2018-2030 (USD MILLION)
- TABLE 118. SINGAPORE RED GINSENG MARKET SIZE, BY FORM, 2018-2030 (USD MILLION)
- TABLE 119. SINGAPORE RED GINSENG MARKET SIZE, BY DISTRIBUTION CHANNEL, 2018-2030 (USD MILLION)
- TABLE 120. SINGAPORE RED GINSENG MARKET SIZE, BY OFFLINE RETAIL, 2018-2030 (USD MILLION)
- TABLE 121. SINGAPORE RED GINSENG MARKET SIZE, BY ONLINE CHANNELS, 2018-2030 (USD MILLION)
- TABLE 122. SINGAPORE RED GINSENG MARKET SIZE, BY APPLICATION, 2018-2030 (USD MILLION)
- TABLE 123. SOUTH KOREA RED GINSENG MARKET SIZE, BY SOURCE, 2018-2030 (USD MILLION)
- TABLE 124. SOUTH KOREA RED GINSENG MARKET SIZE, BY FORM, 2018-2030 (USD MILLION)
- TABLE 125. SOUTH KOREA RED GINSENG MARKET SIZE, BY DISTRIBUTION CHANNEL, 2018-2030 (USD MILLION)
- TABLE 126. SOUTH KOREA RED GINSENG MARKET SIZE, BY OFFLINE RETAIL, 2018-2030 (USD MILLION)
- TABLE 127. SOUTH KOREA RED GINSENG MARKET SIZE, BY ONLINE CHANNELS, 2018-2030 (USD MILLION)
- TABLE 128. SOUTH KOREA RED GINSENG MARKET SIZE, BY APPLICATION, 2018-2030 (USD MILLION)
- TABLE 129. TAIWAN RED GINSENG MARKET SIZE, BY SOURCE, 2018-2030 (USD MILLION)
- TABLE 130. TAIWAN RED GINSENG MARKET SIZE, BY FORM, 2018-2030 (USD MILLION)
- TABLE 131. TAIWAN RED GINSENG MARKET SIZE, BY DISTRIBUTION CHANNEL, 2018-2030 (USD MILLION)
- TABLE 132. TAIWAN RED GINSENG MARKET SIZE, BY OFFLINE RETAIL, 2018-2030 (USD MILLION)
- TABLE 133. TAIWAN RED GINSENG MARKET SIZE, BY ONLINE CHANNELS, 2018-2030 (USD MILLION)
- TABLE 134. TAIWAN RED GINSENG MARKET SIZE, BY APPLICATION, 2018-2030 (USD MILLION)
- TABLE 135. THAILAND RED GINSENG MARKET SIZE, BY SOURCE, 2018-2030 (USD MILLION)
- TABLE 136. THAILAND RED GINSENG MARKET SIZE, BY FORM, 2018-2030 (USD MILLION)
- TABLE 137. THAILAND RED GINSENG MARKET SIZE, BY DISTRIBUTION CHANNEL, 2018-2030 (USD MILLION)
- TABLE 138. THAILAND RED GINSENG MARKET SIZE, BY OFFLINE RETAIL, 2018-2030 (USD MILLION)
- TABLE 139. THAILAND RED GINSENG MARKET SIZE, BY ONLINE CHANNELS, 2018-2030 (USD MILLION)
- TABLE 140. THAILAND RED GINSENG MARKET SIZE, BY APPLICATION, 2018-2030 (USD MILLION)
- TABLE 141. VIETNAM RED GINSENG MARKET SIZE, BY SOURCE, 2018-2030 (USD MILLION)
- TABLE 142. VIETNAM RED GINSENG MARKET SIZE, BY FORM, 2018-2030 (USD MILLION)
- TABLE 143. VIETNAM RED GINSENG MARKET SIZE, BY DISTRIBUTION CHANNEL, 2018-2030 (USD MILLION)
- TABLE 144. VIETNAM RED GINSENG MARKET SIZE, BY OFFLINE RETAIL, 2018-2030 (USD MILLION)
- TABLE 145. VIETNAM RED GINSENG MARKET SIZE, BY ONLINE CHANNELS, 2018-2030 (USD MILLION)
- TABLE 146. VIETNAM RED GINSENG MARKET SIZE, BY APPLICATION, 2018-2030 (USD MILLION)
- TABLE 147. EUROPE, MIDDLE EAST & AFRICA RED GINSENG MARKET SIZE, BY SOURCE, 2018-2030 (USD MILLION)
- TABLE 148. EUROPE, MIDDLE EAST & AFRICA RED GINSENG MARKET SIZE, BY FORM, 2018-2030 (USD MILLION)
- TABLE 149. EUROPE, MIDDLE EAST & AFRICA RED GINSENG MARKET SIZE, BY DISTRIBUTION CHANNEL, 2018-2030 (USD MILLION)
- TABLE 150. EUROPE, MIDDLE EAST & AFRICA RED GINSENG MARKET SIZE, BY OFFLINE RETAIL, 2018-2030 (USD MILLION)
- TABLE 151. EUROPE, MIDDLE EAST & AFRICA RED GINSENG MARKET SIZE, BY ONLINE CHANNELS, 2018-2030 (USD MILLION)
- TABLE 152. EUROPE, MIDDLE EAST & AFRICA RED GINSENG MARKET SIZE, BY APPLICATION, 2018-2030 (USD MILLION)
- TABLE 153. EUROPE, MIDDLE EAST & AFRICA RED GINSENG MARKET SIZE, BY COUNTRY, 2018-2030 (USD MILLION)
- TABLE 154. DENMARK RED GINSENG MARKET SIZE, BY SOURCE, 2018-2030 (USD MILLION)
- TABLE 155. DENMARK RED GINSENG MARKET SIZE, BY FORM, 2018-2030 (USD MILLION)
- TABLE 156. DENMARK RED GINSENG MARKET SIZE, BY DISTRIBUTION CHANNEL, 2018-2030 (USD MILLION)
- TABLE 157. DENMARK RED GINSENG MARKET SIZE, BY OFFLINE RETAIL, 2018-2030 (USD MILLION)
- TABLE 158. DENMARK RED GINSENG MARKET SIZE, BY ONLINE CHANNELS, 2018-2030 (USD MILLION)
- TABLE 159. DENMARK RED GINSENG MARKET SIZE, BY APPLICATION, 2018-2030 (USD MILLION)
- TABLE 160. EGYPT RED GINSENG MARKET SIZE, BY SOURCE, 2018-2030 (USD MILLION)
- TABLE 161. EGYPT RED GINSENG MARKET SIZE, BY FORM, 2018-2030 (USD MILLION)
- TABLE 162. EGYPT RED GINSENG MARKET SIZE, BY DISTRIBUTION CHANNEL, 2018-2030 (USD MILLION)
- TABLE 163. EGYPT RED GINSENG MARKET SIZE, BY OFFLINE RETAIL, 2018-2030 (USD MILLION)
- TABLE 164. EGYPT RED GINSENG MARKET SIZE, BY ONLINE CHANNELS, 2018-2030 (USD MILLION)
- TABLE 165. EGYPT RED GINSENG MARKET SIZE, BY APPLICATION, 2018-2030 (USD MILLION)
- TABLE 166. FINLAND RED GINSENG MARKET SIZE, BY SOURCE, 2018-2030 (USD MILLION)
- TABLE 167. FINLAND RED GINSENG MARKET SIZE, BY FORM, 2018-2030 (USD MILLION)
- TABLE 168. FINLAND RED GINSENG MARKET SIZE, BY DISTRIBUTION CHANNEL, 2018-2030 (USD MILLION)
- TABLE 169. FINLAND RED GINSENG MARKET SIZE, BY OFFLINE RETAIL, 2018-2030 (USD MILLION)
- TABLE 170. FINLAND RED GINSENG MARKET SIZE, BY ONLINE CHANNELS, 2018-2030 (USD MILLION)
- TABLE 171. FINLAND RED GINSENG MARKET SIZE, BY APPLICATION, 2018-2030 (USD MILLION)
- TABLE 172. FRANCE RED GINSENG MARKET SIZE, BY SOURCE, 2018-2030 (USD MILLION)
- TABLE 173. FRANCE RED GINSENG MARKET SIZE, BY FORM, 2018-2030 (USD MILLION)
- TABLE 174. FRANCE RED GINSENG MARKET SIZE, BY DISTRIBUTION CHANNEL, 2018-2030 (USD MILLION)
- TABLE 175. FRANCE RED GINSENG MARKET SIZE, BY OFFLINE RETAIL, 2018-2030 (USD MILLION)
- TABLE 176. FRANCE RED GINSENG MARKET SIZE, BY ONLINE CHANNELS, 2018-2030 (USD MILLION)
- TABLE 177. FRANCE RED GINSENG MARKET SIZE, BY APPLICATION, 2018-2030 (USD MILLION)
- TABLE 178. GERMANY RED GINSENG MARKET SIZE, BY SOURCE, 2018-2030 (USD MILLION)
- TABLE 179. GERMANY RED GINSENG MARKET SIZE, BY FORM, 2018-2030 (USD MILLION)
- TABLE 180. GERMANY RED GINSENG MARKET SIZE, BY DISTRIBUTION CHANNEL, 2018-2030 (USD MILLION)
- TABLE 181. GERMANY RED GINSENG MARKET SIZE, BY OFFLINE RETAIL, 2018-2030 (USD MILLION)
- TABLE 182. GERMANY RED GINSENG MARKET SIZE, BY ONLINE CHANNELS, 2018-2030 (USD MILLION)
- TABLE 183. GERMANY RED GINSENG MARKET SIZE, BY APPLICATION, 2018-2030 (USD MILLION)
- TABLE 184. ISRAEL RED GINSENG MARKET SIZE, BY SOURCE, 2018-2030 (USD MILLION)
- TABLE 185. ISRAEL RED GINSENG MARKET SIZE, BY FORM, 2018-2030 (USD MILLION)
- TABLE 186. ISRAEL RED GINSENG MARKET SIZE, BY DISTRIBUTION CHANNEL, 2018-2030 (USD MILLION)
- TABLE 187. ISRAEL RED GINSENG MARKET SIZE, BY OFFLINE RETAIL, 2018-2030 (USD MILLION)
- TABLE 188. ISRAEL RED GINSENG MARKET SIZE, BY ONLINE CHANNELS, 2018-2030 (USD MILLION)
- TABLE 189. ISRAEL RED GINSENG MARKET SIZE, BY APPLICATION, 2018-2030 (USD MILLION)
- TABLE 190. ITALY RED GINSENG MARKET SIZE, BY SOURCE, 2018-2030 (USD MILLION)
- TABLE 191. ITALY RED GINSENG MARKET SIZE, BY FORM, 2018-2030 (USD MILLION)
- TABLE 192. ITALY RED GINSENG MARKET SIZE, BY DISTRIBUTION CHANNEL, 2018-2030 (USD MILLION)
- TABLE 193. ITALY RED GINSENG MARKET SIZE, BY OFFLINE RETAIL, 2018-2030 (USD MILLION)
- TABLE 194. ITALY RED GINSENG MARKET SIZE, BY ONLINE CHANNELS, 2018-2030 (USD MILLION)
- TABLE 195. ITALY RED GINSENG MARKET SIZE, BY APPLICATION, 2018-2030 (USD MILLION)
- TABLE 196. NETHERLANDS RED GINSENG MARKET SIZE, BY SOURCE, 2018-2030 (USD MILLION)
- TABLE 197. NETHERLANDS RED GINSENG MARKET SIZE, BY FORM, 2018-2030 (USD MILLION)
- TABLE 198. NETHERLANDS RED GINSENG MARKET SIZE, BY DISTRIBUTION CHANNEL, 2018-2030 (USD MILLION)
- TABLE 199. NETHERLANDS RED GINSENG MARKET SIZE, BY OFFLINE RETAIL, 2018-2030 (USD MILLION)
- TABLE 200. NETHERLANDS RED GINSENG MARKET SIZE, BY ONLINE CHANNELS, 2018-2030 (USD MILLION)
- TABLE 201. NETHERLANDS RED GINSENG MARKET SIZE, BY APPLICATION, 2018-2030 (USD MILLION)
- TABLE 202. NIGERIA RED GINSENG MARKET SIZE, BY SOURCE, 2018-2030 (USD MILLION)
- TABLE 203. NIGERIA RED GINSENG MARKET SIZE, BY FORM, 2018-2030 (USD MILLION)
- TABLE 204. NIGERIA RED GINSENG MARKET SIZE, BY DISTRIBUTION CHANNEL, 2018-2030 (USD MILLION)
- TABLE 205. NIGERIA RED GINSENG MARKET SIZE, BY OFFLINE RETAIL, 2018-2030 (USD MILLION)
- TABLE 206. NIGERIA RED GINSENG MARKET SIZE, BY ONLINE CHANNELS, 2018-2030 (USD MILLION)
- TABLE 207. NIGERIA RED GINSENG MARKET SIZE, BY APPLICATION, 2018-2030 (USD MILLION)
- TABLE 208. NORWAY RED GINSENG MARKET SIZE, BY SOURCE, 2018-2030 (USD MILLION)
- TABLE 209. NORWAY RED GINSENG MARKET SIZE, BY FORM, 2018-2030 (USD MILLION)
- TABLE 210. NORWAY RED GINSENG MARKET SIZE, BY DISTRIBUTION CHANNEL, 2018-2030 (USD MILLION)
- TABLE 211. NORWAY RED GINSENG MARKET SIZE, BY OFFLINE RETAIL, 2018-2030 (USD MILLION)
- TABLE 212. NORWAY RED GINSENG MARKET SIZE, BY ONLINE CHANNELS, 2018-2030 (USD MILLION)
- TABLE 213. NORWAY RED GINSENG MARKET SIZE, BY APPLICATION, 2018-2030 (USD MILLION)
- TABLE 214. POLAND RED GINSENG MARKET SIZE, BY SOURCE, 2018-2030 (USD MILLION)
- TABLE 215. POLAND RED GINSENG MARKET SIZE, BY FORM, 2018-2030 (USD MILLION)
- TABLE 216. POLAND RED GINSENG MARKET SIZE, BY DISTRIBUTION CHANNEL, 2018-2030 (USD MILLION)
- TABLE 217. POLAND RED GINSENG MARKET SIZE, BY OFFLINE RETAIL, 2018-2030 (USD MILLION)
- TABLE 218. POLAND RED GINSENG MARKET SIZE, BY ONLINE CHANNELS, 2018-2030 (USD MILLION)
- TABLE 219. POLAND RED GINSENG MARKET SIZE, BY APPLICATION, 2018-2030 (USD MILLION)
- TABLE 220. QATAR RED GINSENG MARKET SIZE, BY SOURCE, 2018-2030 (USD MILLION)
- TABLE 221. QATAR RED GINSENG MARKET SIZE, BY FORM, 2018-2030 (USD MILLION)
- TABLE 222. QATAR RED GINSENG MARKET SIZE, BY DISTRIBUTION CHANNEL, 2018-2030 (USD MILLION)
- TABLE 223. QATAR RED GINSENG MARKET SIZE, BY OFFLINE RETAIL, 2018-2030 (USD MILLION)
- TABLE 224. QATAR RED GINSENG MARKET SIZE, BY ONLINE CHANNELS, 2018-2030 (USD MILLION)
- TABLE 225. QATAR RED GINSENG MARKET SIZE, BY APPLICATION, 2018-2030 (USD MILLION)
- TABLE 226. RUSSIA RED GINSENG MARKET SIZE, BY SOURCE, 2018-2030 (USD MILLION)
- TABLE 227. RUSSIA RED GINSENG MARKET SIZE, BY FORM, 2018-2030 (USD MILLION)
- TABLE 228. RUSSIA RED GINSENG MARKET SIZE, BY DISTRIBUTION CHANNEL, 2018-2030 (USD MILLION)
- TABLE 229. RUSSIA RED GINSENG MARKET SIZE, BY OFFLINE RETAIL, 2018-2030 (USD MILLION)
- TABLE 230. RUSSIA RED GINSENG MARKET SIZE, BY ONLINE CHANNELS, 2018-2030 (USD MILLION)
- TABLE 231. RUSSIA RED GINSENG MARKET SIZE, BY APPLICATION, 2018-2030 (USD MILLION)
- TABLE 232. SAUDI ARABIA RED GINSENG MARKET SIZE, BY SOURCE, 2018-2030 (USD MILLION)
- TABLE 233. SAUDI ARABIA RED GINSENG MARKET SIZE, BY FORM, 2018-2030 (USD MILLION)
- TABLE 234. SAUDI ARABIA RED GINSENG MARKET SIZE, BY DISTRIBUTION CHANNEL, 2018-2030 (USD MILLION)
- TABLE 235. SAUDI ARABIA RED GINSENG MARKET SIZE, BY OFFLINE RETAIL, 2018-2030 (USD MILLION)
- TABLE 236. SAUDI ARABIA RED GINSENG MARKET SIZE, BY ONLINE CHANNELS, 2018-2030 (USD MILLION)
- TABLE 237. SAUDI ARABIA RED GINSENG MARKET SIZE, BY APPLICATION, 2018-2030 (USD MILLION)
- TABLE 238. SOUTH AFRICA RED GINSENG MARKET SIZE, BY SOURCE, 2018-2030 (USD MILLION)
- TABLE 239. SOUTH AFRICA RED GINSENG MARKET SIZE, BY FORM, 2018-2030 (USD MILLION)
- TABLE 240. SOUTH AFRICA RED GINSENG MARKET SIZE, BY DISTRIBUTION CHANNEL, 2018-2030 (USD MILLION)
- TABLE 241. SOUTH AFRICA RED GINSENG MARKET SIZE, BY OFFLINE RETAIL, 2018-2030 (USD MILLION)
- TABLE 242. SOUTH AFRICA RED GINSENG MARKET SIZE, BY ONLINE CHANNELS, 2018-2030 (USD MILLION)
- TABLE 243. SOUTH AFRICA RED GINSENG MARKET SIZE, BY APPLICATION, 2018-2030 (USD MILLION)
- TABLE 244. SPAIN RED GINSENG MARKET SIZE, BY SOURCE, 2018-2030 (USD MILLION)
- TABLE 245. SPAIN RED GINSENG MARKET SIZE, BY FORM, 2018-2030 (USD MILLION)
- TABLE 246. SPAIN RED GINSENG MARKET SIZE, BY DISTRIBUTION CHANNEL, 2018-2030 (USD MILLION)
- TABLE 247. SPAIN RED GINSENG MARKET SIZE, BY OFFLINE RETAIL, 2018-2030 (USD MILLION)
- TABLE 248. SPAIN RED GINSENG MARKET SIZE, BY ONLINE CHANNELS, 2018-2030 (USD MILLION)
- TABLE 249. SPAIN RED GINSENG MARKET SIZE, BY APPLICATION, 2018-2030 (USD MILLION)
- TABLE 250. SWEDEN RED GINSENG MARKET SIZE, BY SOURCE, 2018-2030 (USD MILLION)
- TABLE 251. SWEDEN RED GINSENG MARKET SIZE, BY FORM, 2018-2030 (USD MILLION)
- TABLE 252. SWEDEN RED GINSENG MARKET SIZE, BY DISTRIBUTION CHANNEL, 2018-2030 (USD MILLION)
- TABLE 253. SWEDEN RED GINSENG MARKET SIZE, BY OFFLINE RETAIL, 2018-2030 (USD MILLION)
- TABLE 254. SWEDEN RED GINSENG MARKET SIZE, BY ONLINE CHANNELS, 2018-2030 (USD MILLION)
- TABLE 255. SWEDEN RED GINSENG MARKET SIZE, BY APPLICATION, 2018-2030 (USD MILLION)
- TABLE 256. SWITZERLAND RED GINSENG MARKET SIZE, BY SOURCE, 2018-2030 (USD MILLION)
- TABLE 257. SWITZERLAND RED GINSENG MARKET SIZE, BY FORM, 2018-2030 (USD MILLION)
- TABLE 258. SWITZERLAND RED GINSENG MARKET SIZE, BY DISTRIBUTION CHANNEL, 2018-2030 (USD MILLION)
- TABLE 259. SWITZERLAND RED GINSENG MARKET SIZE, BY OFFLINE RETAIL, 2018-2030 (USD MILLION)
- TABLE 260. SWITZERLAND RED GINSENG MARKET SIZE, BY ONLINE CHANNELS, 2018-2030 (USD MILLION)
- TABLE 261. SWITZERLAND RED GINSENG MARKET SIZE, BY APPLICATION, 2018-2030 (USD MILLION)
- TABLE 262. TURKEY RED GINSENG MARKET SIZE, BY SOURCE, 2018-2030 (USD MILLION)
- TABLE 263. TURKEY RED GINSENG MARKET SIZE, BY FORM, 2018-2030 (USD MILLION)
- TABLE 264. TURKEY RED GINSENG MARKET SIZE, BY DISTRIBUTION CHANNEL, 2018-2030 (USD MILLION)
- TABLE 265. TURKEY RED GINSENG MARKET SIZE, BY OFFLINE RETAIL, 2018-2030 (USD MILLION)
- TABLE 266. TURKEY RED GINSENG MARKET SIZE, BY ONLINE CHANNELS, 2018-2030 (USD MILLION)
- TABLE 267. TURKEY RED GINSENG MARKET SIZE, BY APPLICATION, 2018-2030 (USD MILLION)
- TABLE 268. UNITED ARAB EMIRATES RED GINSENG MARKET SIZE, BY SOURCE, 2018-2030 (USD MILLION)
- TABLE 269. UNITED ARAB EMIRATES RED GINSENG MARKET SIZE, BY FORM, 2018-2030 (USD MILLION)
- TABLE 270. UNITED ARAB EMIRATES RED GINSENG MARKET SIZE, BY DISTRIBUTION CHANNEL, 2018-2030 (USD MILLION)
- TABLE 271. UNITED ARAB EMIRATES RED GINSENG MARKET SIZE, BY OFFLINE RETAIL, 2018-2030 (USD MILLION)
- TABLE 272. UNITED ARAB EMIRATES RED GINSENG MARKET SIZE, BY ONLINE CHANNELS, 2018-2030 (USD MILLION)
- TABLE 273. UNITED ARAB EMIRATES RED GINSENG MARKET SIZE, BY APPLICATION, 2018-2030 (USD MILLION)
- TABLE 274. UNITED KINGDOM RED GINSENG MARKET SIZE, BY SOURCE, 2018-2030 (USD MILLION)
- TABLE 275. UNITED KINGDOM RED GINSENG MARKET SIZE, BY FORM, 2018-2030 (USD MILLION)
- TABLE 276. UNITED KINGDOM RED GINSENG MARKET SIZE, BY DISTRIBUTION CHANNEL, 2018-2030 (USD MILLION)
- TABLE 277. UNITED KINGDOM RED GINSENG MARKET SIZE, BY OFFLINE RETAIL, 2018-2030 (USD MILLION)
- TABLE 278. UNITED KINGDOM RED GINSENG MARKET SIZE, BY ONLINE CHANNELS, 2018-2030 (USD MILLION)
- TABLE 279. UNITED KINGDOM RED GINSENG MARKET SIZE, BY APPLICATION, 2018-2030 (USD MILLION)
- TABLE 280. RED GINSENG MARKET SHARE, BY KEY PLAYER, 2024
- TABLE 281. RED GINSENG MARKET, FPNV POSITIONING MATRIX, 2024
The Red Ginseng Market was valued at USD 323.47 million in 2024 and is projected to grow to USD 336.44 million in 2025, with a CAGR of 4.14%, reaching USD 412.80 million by 2030.
| KEY MARKET STATISTICS | |
|---|---|
| Base Year [2024] | USD 323.47 million |
| Estimated Year [2025] | USD 336.44 million |
| Forecast Year [2030] | USD 412.80 million |
| CAGR (%) | 4.14% |
Red ginseng has long been celebrated for its rich history and therapeutic properties. As consumer interest in health and wellness intensifies globally, red ginseng has emerged as a premium ingredient that resonates with both traditional practices and modern wellness trends. In recent years, this market has experienced an upswing as consumers seek natural remedies, adaptogenic benefits, and scientifically backed nutritional support. This report delves into the dynamics underpinning the red ginseng market and outlines the evolution of market parameters that add value to the industry. Across diverse geographies and consumer segments, evolving trends have not only bolstered confidence in red ginseng but also transformed supply, distribution, and product innovation. The narrative is underpinned by a blend of qualitative insights and quantitative data, ultimately providing a comprehensive overview that positions red ginseng as a lucrative opportunity in an increasingly competitive health landscape. Industry stakeholders are now more than ever compelled to invest in research and to innovate in order to maintain market leadership and address consumer demands. This analysis sets the foundation for understanding how shifting consumer attitudes and robust market fundamentals collectively drive sustainable growth in this vibrant and evolving sector.
Transformative Shifts in the Red Ginseng Market Landscape
In today's rapidly evolving global marketplace, red ginseng has undergone transformative shifts that redefine how the market is structured and consumed. Dynamic advancements in production methods, combined with heightened consumer awareness about natural health supplements, have reoriented market strategies across the board. Strategic players are leveraging new technologies and distribution models to enhance product quality and accessibility, while rigorous scientific research underpins many of the health claims associated with red ginseng. These advancements have led to an expansion in product range and innovation, driven by a stronger consumer inclination towards premium quality and diverse formulations. The conventional boundaries defined by traditional modes of sale are being redrawn as digitization boosts online engagement and alters purchasing behaviors. Furthermore, evolving regulatory standards and an increased focus on sustainability have prompted market leaders to optimize their operations, ensuring ethical sourcing and production practices. The resultant transformation in consumer behavior is evidenced by heightened market performance metrics and a surge in investment in research and development initiatives. These trends converge to create an ecosystem that is both resilient and adaptive, marking a decisive shift in the competitive dynamics and long-term outlook of the red ginseng sector.
Key Segmentation Insights for Red Ginseng
A detailed exploration of segmentation confirms that the red ginseng market is nuanced and multifaceted. The analysis begins with product sourcing; the market is divided into segments based on source, where studies cover both cultivated and wild variants. The inherent differences in cultivation practices, environmental influences, and harvest conditions directly impact product quality and consumer perception. In addition, the market is evaluated based on the form in which red ginseng is available. Products are meticulously categorized into capsules, liquid extracts, powders, and tablets, with each format catering to distinct consumer preferences and usage scenarios. Beyond consumption methods, the market further differentiates by distribution channels. Both offline retail and online channels are closely examined. Offline retail encompasses Pharmacies and Drugstores, Specialty Herbal and Health Stores, as well as Supermarkets and Hypermarkets, ensuring that consumers have access to a wide recommender of quality products. Complementing offline strategies, online channels, which span Brand-Owned Websites and E-Commerce Platforms, secure digital reach and convenience in acquisition. Finally, a critical segmentation is based on application, wherein red ginseng is used in diverse applications such as dietary supplements and functional foods, food and beverage processing, medicinal applications, and personal care products. Each segmentation parameter not only underlines the heterogeneity of the market but also reveals nuanced consumer behaviors and strategic opportunities for market participants.
Based on Source, market is studied across Cultivated and Wild.
Based on Form, market is studied across Capsules, Liquid, Powder, and Tablets.
Based on Distribution Channel, market is studied across Offline Retail and Online Channels. The Offline Retail is further studied across Pharmacies & Drugstores, Specialty Herbal & Health Stores, and Supermarkets & Hypermarkets. The Online Channels is further studied across Brand-Owned Websites and E-Commerce Platforms.
Based on Application, market is studied across Dietary Supplements & Functional Food, Food & Beverage Processing, Medicinal Application, and Personal Care Products.
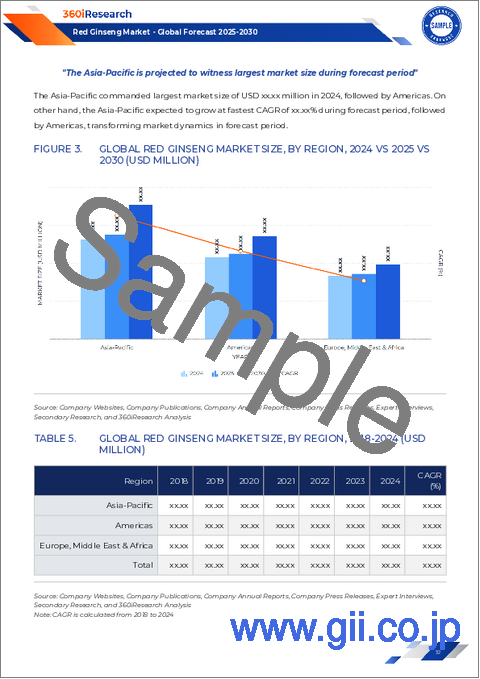
Key Regional Insights in the Red Ginseng Market
An in-depth regional analysis underscores the geographic dimensions influencing the red ginseng market. The study spans multiple regions, each contributing uniquely to the global market tapestry. In the Americas, robust consumer demand, coupled with an increasing inclination toward natural therapeutics, has propelled rapid market adoption, making it a significant contributor. In Europe, Middle East and Africa, stringent regulatory frameworks and a growing emphasis on natural and organic products have redefined market expectations and operational paradigms. Across the Asia-Pacific, traditional practices allied with modern scientific validation have spurred both domestic familiarity and export opportunities. This region, known for its deep-rooted historical engagement with herbal supplements, has continued to drive innovations that merge ancient wisdom with contemporary health trends. The interplay between local consumer perceptions and broader market dynamics highlights varied growth trajectories, with each region offering distinct challenges and opportunities. Such granular insights enable stakeholders to tailor their marketing, product development, and distribution strategies in line with regional preferences and consumption patterns, ensuring a balanced approach towards addressing both mature and emerging markets.
Based on Region, market is studied across Americas, Asia-Pacific, and Europe, Middle East & Africa. The Americas is further studied across Argentina, Brazil, Canada, Mexico, and United States. The United States is further studied across California, Florida, Illinois, New York, Ohio, Pennsylvania, and Texas. The Asia-Pacific is further studied across Australia, China, India, Indonesia, Japan, Malaysia, Philippines, Singapore, South Korea, Taiwan, Thailand, and Vietnam. The Europe, Middle East & Africa is further studied across Denmark, Egypt, Finland, France, Germany, Israel, Italy, Netherlands, Nigeria, Norway, Poland, Qatar, Russia, Saudi Arabia, South Africa, Spain, Sweden, Switzerland, Turkey, United Arab Emirates, and United Kingdom.
Key Companies Driving Innovation in the Red Ginseng Market
A constellation of pioneering companies is driving the evolution of the red ginseng market, with each player bringing unique strengths and strategic acumen to the table. Innovative enterprises such as Alpha Herbals LLC, Blue Ridge Ginseng LLC, and COR Ginseng Solutions Ltd. are setting benchmarks in quality and processing standards, ensuring that product reliability meets the highest consumer expectations. Established industry leaders like Elite Herbal Technologies Inc. and Essence of Ginseng Corp. continuously invest in R&D to push the boundaries of product formulation and therapeutic efficacy. In addition, trailblazers such as Evergreen Ginseng Co. and Ginseng Bioactive Solutions harness advanced extraction and formulation techniques, while Ginseng Health Co. and Ginseng Life Sciences Inc. focus on integrating traditional processes with modern technology. This wave of innovation is further supported by Ginseng Worldwide Ltd., Global Herbal Solutions Inc., and Herbal Synergy Corp., each renowned for their deep industry insights and commitment to consumer wellbeing. Heritage Herbal Extracts Ltd. and Highland Ginseng International play pivotal roles in globally expanding market reach, with Holistica Nutraceuticals LLC and Korean Red Ginseng Corporation reinforcing the market with scientifically validated products. Nature's Best Ginseng International, Nature's Ginseng Holdings, Omega Herbal Sciences Inc., Panax Pro Inc., Prime Botanical Therapeutics LLC, Prime Essence Herbs Inc., as well as Prime Ginseng Supplies and Prime Harvest Herbs Inc. add even more depth to the competitive landscape. Prime Nature Extracts, Pure Nature Ginseng Ltd., Red Ginseng Empowerment Corp., Red Ginseng Innovations Inc., Superior Ginseng Tech Inc., Terra Ginseng Enterprises, Vital Red Ginseng Ltd., Zen Ginseng Industries Ltd., and Zenith Herbal Products Inc. synthesize innovation with market intelligence to underpin the sector's sustained growth.
The report delves into recent significant developments in the Red Ginseng Market, highlighting leading vendors and their innovative profiles. These include Alpha Herbals LLC, Blue Ridge Ginseng LLC, COR Ginseng Solutions Ltd., Elite Herbal Technologies Inc., Essence of Ginseng Corp., Evergreen Ginseng Co., Ginseng Bioactive Solutions, Ginseng Health Co., Ginseng Life Sciences Inc., Ginseng Worldwide Ltd., Global Herbal Solutions Inc., Herbal Synergy Corp., Heritage Herbal Extracts Ltd., Highland Ginseng International, Holistica Nutraceuticals LLC, Korean Red Ginseng Corporation, Nature's Best Ginseng International, Nature's Ginseng Holdings, Omega Herbal Sciences Inc., Panax Pro Inc., Prime Botanical Therapeutics LLC, Prime Essence Herbs Inc., Prime Ginseng Supplies, Prime Harvest Herbs Inc., Prime Nature Extracts, Pure Nature Ginseng Ltd., Red Ginseng Empowerment Corp., Red Ginseng Innovations Inc., Superior Ginseng Tech Inc., Terra Ginseng Enterprises, Vital Red Ginseng Ltd., Zen Ginseng Industries Ltd., and Zenith Herbal Products Inc.. Actionable Recommendations for Future Market Strategies
Industry leaders are encouraged to adopt strategic measures that can harness the full potential of the red ginseng market. It is crucial to focus on continuous innovation and quality enhancement, aligning product development with evolving consumer preferences and technological advancements. Companies should invest significantly in research initiatives to understand the bioactive components of red ginseng and tailor their product offerings accordingly. Diversification of product forms-ranging from capsules and liquids to powders and tablets-is essential for meeting varied consumer needs. Additionally, streamlining distribution channels by integrating both offline and online strategies will ensure that products are accessible to a broader audience. Strategic collaborations and partnerships with health specialists and research institutions can further enhance credibility and market reach. Emphasis should also be placed on regional customization, acknowledging that market dynamics in the Americas differ significantly from those in Europe, Middle East and Africa, and Asia-Pacific. Ethical sourcing and sustainable production practices must be maintained to build consumer trust and long-term brand loyalty. Finally, leaders are advised to adopt agile marketing strategies that swiftly respond to regulatory changes and shifting market demands, thereby ensuring that the competitive edge is preserved in a rapidly transforming global environment.
Conclusion: Summarizing the Red Ginseng Market Trend Outlook
The red ginseng market stands as a dynamic arena enriched by scientific innovation, evolving consumer behaviors, and comprehensive segmentation insights. The continuous transformation in market dynamics and distribution channels, coupled with an increasing demand for natural and efficacious health supplements, has created a robust platform for both established and emerging players. In dissecting key segmentation parameters, it becomes clear that versatility in product form and application is pivotal to capturing consumer interest. Regional differences showcase tailored opportunities and challenges, thereby urging companies to adopt a localized yet global strategy. The competitive landscape is marked by numerous forward-thinking companies who are actively redefining industry standards through quality, research, and sustainable practices. With a focus on strategic agility and deep market insights, the industry is poised for substantial and sustained growth. This report encapsulates essential trends and operational insights needed for stakeholders to navigate the intricacies of a varied yet promising market, ultimately guiding decision-makers in harnessing the full potential of the red ginseng sector.
Table of Contents
1. Preface
- 1.1. Objectives of the Study
- 1.2. Market Segmentation & Coverage
- 1.3. Years Considered for the Study
- 1.4. Currency & Pricing
- 1.5. Language
- 1.6. Stakeholders
2. Research Methodology
- 2.1. Define: Research Objective
- 2.2. Determine: Research Design
- 2.3. Prepare: Research Instrument
- 2.4. Collect: Data Source
- 2.5. Analyze: Data Interpretation
- 2.6. Formulate: Data Verification
- 2.7. Publish: Research Report
- 2.8. Repeat: Report Update
3. Executive Summary
4. Market Overview
5. Market Insights
- 5.1. Market Dynamics
- 5.1.1. Drivers
- 5.1.1.1. Increasing preference for natural and organic wellness products globally
- 5.1.1.2. Rising consumer awareness of the scientifically validated health benefits of red ginseng
- 5.1.1.3. Growing integration of red ginseng in functional food, nutraceutical, and beverages
- 5.1.1.4. Government initiatives and policies promoting traditional herbal remedies
- 5.1.2. Restraints
- 5.1.2.1. High production costs and seasonal fluctuations in raw material availability
- 5.1.3. Opportunities
- 5.1.3.1. Technological advancements in extraction and processing techniques of red ginseng
- 5.1.3.2. Investments & funding in the research & development of functional nutraceutical innovations
- 5.1.4. Challenges
- 5.1.4.1. Environmental issues associated with consistent agricultural productivity and availability of counterfeit products
- 5.1.1. Drivers
- 5.2. Market Segmentation Analysis
- 5.2.1. Form: Rising demand for liquid formulations of red ginseng owing to the rapid absorption and ease of integration
- 5.2.2. Application: Growing usage of red ginseng in the dietary supplements & functional foods
- 5.3. Porter's Five Forces Analysis
- 5.3.1. Threat of New Entrants
- 5.3.2. Threat of Substitutes
- 5.3.3. Bargaining Power of Customers
- 5.3.4. Bargaining Power of Suppliers
- 5.3.5. Industry Rivalry
- 5.4. PESTLE Analysis
- 5.4.1. Political
- 5.4.2. Economic
- 5.4.3. Social
- 5.4.4. Technological
- 5.4.5. Legal
- 5.4.6. Environmental
6. Red Ginseng Market, by Source
- 6.1. Introduction
- 6.2. Cultivated
- 6.3. Wild
7. Red Ginseng Market, by Form
- 7.1. Introduction
- 7.2. Capsules
- 7.3. Liquid
- 7.4. Powder
- 7.5. Tablets
8. Red Ginseng Market, by Distribution Channel
- 8.1. Introduction
- 8.2. Offline Retail
- 8.2.1. Pharmacies & Drugstores
- 8.2.2. Specialty Herbal & Health Stores
- 8.2.3. Supermarkets & Hypermarkets
- 8.3. Online Channels
- 8.3.1. Brand-Owned Websites
- 8.3.2. E-Commerce Platforms
9. Red Ginseng Market, by Application
- 9.1. Introduction
- 9.2. Dietary Supplements & Functional Food
- 9.3. Food & Beverage Processing
- 9.4. Medicinal Application
- 9.5. Personal Care Products
10. Americas Red Ginseng Market
- 10.1. Introduction
- 10.2. Argentina
- 10.3. Brazil
- 10.4. Canada
- 10.5. Mexico
- 10.6. United States
11. Asia-Pacific Red Ginseng Market
- 11.1. Introduction
- 11.2. Australia
- 11.3. China
- 11.4. India
- 11.5. Indonesia
- 11.6. Japan
- 11.7. Malaysia
- 11.8. Philippines
- 11.9. Singapore
- 11.10. South Korea
- 11.11. Taiwan
- 11.12. Thailand
- 11.13. Vietnam
12. Europe, Middle East & Africa Red Ginseng Market
- 12.1. Introduction
- 12.2. Denmark
- 12.3. Egypt
- 12.4. Finland
- 12.5. France
- 12.6. Germany
- 12.7. Israel
- 12.8. Italy
- 12.9. Netherlands
- 12.10. Nigeria
- 12.11. Norway
- 12.12. Poland
- 12.13. Qatar
- 12.14. Russia
- 12.15. Saudi Arabia
- 12.16. South Africa
- 12.17. Spain
- 12.18. Sweden
- 12.19. Switzerland
- 12.20. Turkey
- 12.21. United Arab Emirates
- 12.22. United Kingdom
13. Competitive Landscape
- 13.1. Market Share Analysis, 2024
- 13.2. FPNV Positioning Matrix, 2024
- 13.3. Competitive Scenario Analysis
- 13.3.1. KGC Ginseng Corporation expands its Malaysian market presence through exclusive roadshows
- 13.3.2. Korea Ginseng Corporation launches a convenient grapefruit-flavored red ginseng stick pack
- 13.3.3. Cheong Kwan Jang launched traditional yakuza by integrating red ginseng concentrate and innovative flavor profiles
- 13.4. Strategy Analysis & Recommendation
Companies Mentioned
- 1. Alpha Herbals LLC
- 2. Blue Ridge Ginseng LLC
- 3. COR Ginseng Solutions Ltd.
- 4. Elite Herbal Technologies Inc.
- 5. Essence of Ginseng Corp.
- 6. Evergreen Ginseng Co.
- 7. Ginseng Bioactive Solutions
- 8. Ginseng Health Co.
- 9. Ginseng Life Sciences Inc.
- 10. Ginseng Worldwide Ltd.
- 11. Global Herbal Solutions Inc.
- 12. Herbal Synergy Corp.
- 13. Heritage Herbal Extracts Ltd.
- 14. Highland Ginseng International
- 15. Holistica Nutraceuticals LLC
- 16. Korean Red Ginseng Corporation
- 17. Nature's Best Ginseng International
- 18. Nature's Ginseng Holdings
- 19. Omega Herbal Sciences Inc.
- 20. Panax Pro Inc.
- 21. Prime Botanical Therapeutics LLC
- 22. Prime Essence Herbs Inc.
- 23. Prime Ginseng Supplies
- 24. Prime Harvest Herbs Inc.
- 25. Prime Nature Extracts
- 26. Pure Nature Ginseng Ltd.
- 27. Red Ginseng Empowerment Corp.
- 28. Red Ginseng Innovations Inc.
- 29. Superior Ginseng Tech Inc.
- 30. Terra Ginseng Enterprises
- 31. Vital Red Ginseng Ltd.
- 32. Zen Ginseng Industries Ltd.
- 33. Zenith Herbal Products Inc.
