 |
市場調査レポート
商品コード
1434591
空中作業プラットフォーム市場:製品タイプ別、推進タイプ別、用途別-2023~2030年の世界予測Aerial Work Platforms Market by Product (Articulated Boom Lift, Crawler Lift, Scissor Lift), Propulsion Type (Diesel, Electric, Hybrid), Application - Global Forecast 2023-2030 |
||||||
● お客様のご希望に応じて、既存データの加工や未掲載情報(例:国別セグメント)の追加などの対応が可能です。 詳細はお問い合わせください。

| 空中作業プラットフォーム市場:製品タイプ別、推進タイプ別、用途別-2023~2030年の世界予測 |
|
出版日: 2024年01月09日
発行: 360iResearch
ページ情報: 英文 182 Pages
納期: 即日から翌営業日
|
- 全表示
- 概要
- 図表
- 目次
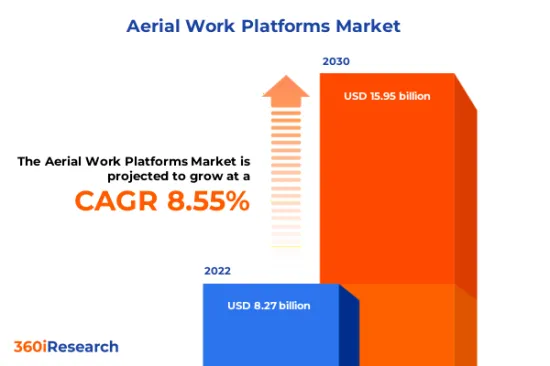
空中作業プラットフォーム市場規模は2022年に82億7,000万米ドルと推計され、2023年には88億9,000万米ドルに達し、CAGR 8.55%で2030年には159億5,000万米ドルに達すると予測されます。
空中作業プラットフォームの世界市場
| 主な市場の統計 | |
|---|---|
| 基準年[2022] | 82億7,000万米ドル |
| 予測年[2023] | 88億9,000万米ドル |
| 予測年 [2030] | 159億5,000万米ドル |
| CAGR(%) | 8.55% |
高所作業プラットフォーム(AWP)は、通常、人が近づけない場所への一時的なアクセスを提供するために使用されます。AWPは建設業やメンテナンス業でよく見られ、シザーリフト、ブームリフト、垂直マストリフトなど様々な形態があります。空中作業プラットフォームは、安定した作業プラットフォームを提供することで、より危険な高所へのアクセス方法に取って代わりました。世界中で建設活動やインフラプロジェクトが増加しており、AWPの需要に拍車をかけています。さらに、産業作業の自動化と電化の推進により、新しい革新的なAWPが含まれる範囲も広がっています。しかし、最新のAWPに必要な初期投資は、中小企業にとって障壁となる可能性があります。加えて、熟練したオペレーターの必要性と訓練に関連するコストは、空中作業プラットフォームの展開を制限する可能性があります。とはいえ、環境に配慮した操作のための電気リフトやハイブリッド・リフトのような技術革新は、多様なエンドユーザー産業にわたるAWPの採用を奨励しています。AWPの自律性とスマートセーフティシステムに関する継続的な調査が、今後数年間の市場成長を促進すると予想されます。
地域別洞察
アジア太平洋地域は、インフラストラクチャーの急速な成長を目の当たりにしており、AWPの需要増加につながっています。アジア太平洋の新興国では建設活動が盛んであり、AWPの需要を牽引しています。同地域の消費者は、設備投資とメンテナンスコストが低いことから、レンタルオプションを好むようになっています。AWPの旺盛な需要は、南北アメリカにおける大規模建設、メンテナンス活動、仮設設置を必要とする活気ある娯楽産業によるものです。南北アメリカにおける重要な投資は、フリートの拡大と持続可能性を中心に展開されています。EMEA地域は多様なAWP市場を示しており、EU諸国は厳しい安全規制とエネルギー効率の高い機械に重点を置いているため、高い導入率を示しています。インフラと商業プロジェクトに多額の投資を行う中東は、AWPに大きな成長の可能性を提供しています。
FPNVポジショニング・マトリックス
FPNVポジショニングマトリックスは空中作業プラットフォーム市場を評価する上で極めて重要です。事業戦略や製品満足度に関連する主要指標を調査し、ベンダーの包括的な評価を提供します。この綿密な分析により、ユーザーは各自の要件に沿った十分な情報に基づいた意思決定を行うことができます。評価に基づき、ベンダーは成功の度合いが異なる4つの象限に分類されます:フォアフロント(F)、パスファインダー(P)、ニッチ(N)、バイタル(V)です。
市場シェア分析
市場シェア分析は、空中作業プラットフォーム市場におけるベンダーの現状について、洞察に満ちた詳細な調査を提供する包括的なツールです。全体的な収益、顧客基盤、その他の主要指標についてベンダーの貢献度を綿密に比較・分析することで、企業の業績や市場シェア争いの際に直面する課題について理解を深めることができます。さらに、この分析により、調査対象基準年に観察された累積、断片化の優位性、合併の特徴などの要因を含む、この分野の競合特性に関する貴重な考察が得られます。このような詳細レベルの拡大により、ベンダーはより多くの情報に基づいた意思決定を行い、市場で競争優位に立つための効果的な戦略を考案することができます。
本レポートは、以下の側面に関する貴重な洞察を提供しています:
1-市場の浸透度:主要企業が提供する市場に関する包括的な情報を提示しています。
2-市場の開拓度:有利な新興市場を深く掘り下げ、成熟市場セグメントにおける浸透度を分析しています。
3-市場の多様化:新製品の発売、未開拓の地域、最近の開発、投資に関する詳細な情報を提供します。
4-競合の評価と情報:市場シェア、戦略、製品、認証、規制状況、特許状況、主要企業の製造能力などを網羅的に評価します。
5-製品開発およびイノベーション:将来の技術、研究開発活動、画期的な製品開発に関する知的洞察を提供します。
本レポートは、以下のような主要な質問に対応しています:
1-空中作業プラットフォーム市場の市場規模および予測は?
2-空中作業プラットフォーム市場の予測期間中に投資を検討すべき製品、セグメント、用途、分野は何か?
3-空中作業プラットフォーム市場における技術動向と規制の枠組みは?
4-空中作業プラットフォーム市場における主要ベンダーの市場シェアは?
5-空中作業プラットフォーム市場への参入に適した形態や戦略的手段は?
目次
第1章 序文
第2章 調査手法
第3章 エグゼクティブサマリー
第4章 市場の概要
第5章 市場洞察
- 市場力学
- 促進要因
- 建築物の復興と定期メンテナンスの増加
- 製造部門や工場におけるマテリアルハンドリングの需要の増加
- 抑制要因
- 熟練オペレーターの不足と高所作業車に関連する潜在的な危険
- 機会
- AWPの技術進歩による製品機能と運用パフォーマンスの向上
- 建設産業とインフラ開発への投資の拡大
- 課題
- AWPプラットフォームレンタルサービスの嗜好性の向上と容易な利用可能性
- 促進要因
- 市場セグメンテーション分析
- 製品:倉庫作業におけるシザーリフトの多用
- 推進タイプ:電動化の新たな普及空中作業プラットフォーム
- 用途:空中作業プラットフォームが建築・建設・不動産分野で大採用
- 市場動向分析
- COVID-19の累積的な影響
- ロシア・ウクライナ紛争の累積的影響
- 高インフレの累積的影響
- ポーターのファイブフォース分析
- バリューチェーンとクリティカルパス分析
- 規制の枠組み
- 顧客のカスタマイズ
第6章 空中作業プラットフォーム市場:製品別
- 関節式ブームリフト
- クローラーリフト
- シザーリフト
- スパイダーリフト
- 伸縮ブーム
- トレーラー搭載型リフト
- トラック搭載型リフト
- 垂直リフト
第7章 空中作業プラットフォーム市場推進タイプ別
- ディーゼル
- 電気
- ハイブリッド
- ガソリン
第8章 空中作業プラットフォーム市場:用途別
- 航空宇宙と防衛
- 自動車と輸送
- 建築、建設、不動産
- エネルギーと公共事業
- 石油ガス
- 通信
第9章 南北アメリカの空中作業プラットフォーム市場
- アルゼンチン
- ブラジル
- カナダ
- メキシコ
- 米国
第10章 アジア太平洋地域の空中作業プラットフォーム市場
- オーストラリア
- 中国
- インド
- インドネシア
- 日本
- マレーシア
- フィリピン
- シンガポール
- 韓国
- 台湾
- タイ
- ベトナム
第11章 欧州・中東・アフリカの空中作業プラットフォーム市場
- デンマーク
- エジプト
- フィンランド
- フランス
- ドイツ
- イスラエル
- イタリア
- オランダ
- ナイジェリア
- ノルウェー
- ポーランド
- カタール
- ロシア
- サウジアラビア
- 南アフリカ
- スペイン
- スウェーデン
- スイス
- トルコ
- アラブ首長国連邦
- 英国
第12章 競合情勢
- FPNVポジショニングマトリクス
- 市場シェア分析:主要企業別
- 競合シナリオ主要企業別の分析
- 合併・買収
- 契約、コラボレーション、パートナーシップ
- 投資、資金調達
第13章 競争力のあるポートフォリオ
- 主要な企業プロファイル
- Advance Lifts, Inc.
- Aichi Corporation
- Altec Industries, Inc.
- Dinolift OY
- EdmoLift AB
- Elliott Equipment Company
- Haulotte Group
- Holland Lift International B.V.
- Hunan RUNSHARE Heavy Industry Company, Ltd.
- Hunan Sinoboom Intelligent Equipment Co, Ltd.
- JLG Industries, Inc.
- Klubb
- Linamar Corporation
- Manitex International, Inc.
- MEC Aerial Work Platforms
- MORN LIFT
- Nidec Corporation
- Niftylift Ltd.
- Snorkel International, LLC
- Socage S.r.l.
- SOOSAN CSM
- Tadano Ltd.
- Terex Corporation
- WIESE USA
- Zhejiang Dingli Machinery Co., Ltd.
- Zoomlion Heavy Industry Science&Technology Co., Ltd.
- 主要な製品ポートフォリオ
第14章 付録
- ディスカッションガイド
- ライセンスと価格について
LIST OF FIGURES
- FIGURE 1. AERIAL WORK PLATFORMS MARKET RESEARCH PROCESS
- FIGURE 2. AERIAL WORK PLATFORMS MARKET SIZE, 2022 VS 2030
- FIGURE 3. AERIAL WORK PLATFORMS MARKET SIZE, 2018-2030 (USD MILLION)
- FIGURE 4. AERIAL WORK PLATFORMS MARKET SIZE, BY REGION, 2022 VS 2030 (%)
- FIGURE 5. AERIAL WORK PLATFORMS MARKET SIZE, BY REGION, 2022 VS 2023 VS 2030 (USD MILLION)
- FIGURE 6. AERIAL WORK PLATFORMS MARKET DYNAMICS
- FIGURE 7. AERIAL WORK PLATFORMS MARKET SIZE, BY PRODUCT, 2022 VS 2030 (%)
- FIGURE 8. AERIAL WORK PLATFORMS MARKET SIZE, BY PRODUCT, 2022 VS 2023 VS 2030 (USD MILLION)
- FIGURE 9. AERIAL WORK PLATFORMS MARKET SIZE, BY PROPULSION TYPE, 2022 VS 2030 (%)
- FIGURE 10. AERIAL WORK PLATFORMS MARKET SIZE, BY PROPULSION TYPE, 2022 VS 2023 VS 2030 (USD MILLION)
- FIGURE 11. AERIAL WORK PLATFORMS MARKET SIZE, BY APPLICATION, 2022 VS 2030 (%)
- FIGURE 12. AERIAL WORK PLATFORMS MARKET SIZE, BY APPLICATION, 2022 VS 2023 VS 2030 (USD MILLION)
- FIGURE 13. AMERICAS AERIAL WORK PLATFORMS MARKET SIZE, BY COUNTRY, 2022 VS 2030 (%)
- FIGURE 14. AMERICAS AERIAL WORK PLATFORMS MARKET SIZE, BY COUNTRY, 2022 VS 2023 VS 2030 (USD MILLION)
- FIGURE 15. UNITED STATES AERIAL WORK PLATFORMS MARKET SIZE, BY STATE, 2022 VS 2030 (%)
- FIGURE 16. UNITED STATES AERIAL WORK PLATFORMS MARKET SIZE, BY STATE, 2022 VS 2023 VS 2030 (USD MILLION)
- FIGURE 17. ASIA-PACIFIC AERIAL WORK PLATFORMS MARKET SIZE, BY COUNTRY, 2022 VS 2030 (%)
- FIGURE 18. ASIA-PACIFIC AERIAL WORK PLATFORMS MARKET SIZE, BY COUNTRY, 2022 VS 2023 VS 2030 (USD MILLION)
- FIGURE 19. EUROPE, MIDDLE EAST & AFRICA AERIAL WORK PLATFORMS MARKET SIZE, BY COUNTRY, 2022 VS 2030 (%)
- FIGURE 20. EUROPE, MIDDLE EAST & AFRICA AERIAL WORK PLATFORMS MARKET SIZE, BY COUNTRY, 2022 VS 2023 VS 2030 (USD MILLION)
- FIGURE 21. AERIAL WORK PLATFORMS MARKET, FPNV POSITIONING MATRIX, 2022
- FIGURE 22. AERIAL WORK PLATFORMS MARKET SHARE, BY KEY PLAYER, 2022
LIST OF TABLES
- TABLE 1. AERIAL WORK PLATFORMS MARKET SEGMENTATION & COVERAGE
- TABLE 2. UNITED STATES DOLLAR EXCHANGE RATE, 2018-2022
- TABLE 3. AERIAL WORK PLATFORMS MARKET SIZE, 2018-2030 (USD MILLION)
- TABLE 4. GLOBAL AERIAL WORK PLATFORMS MARKET SIZE, BY REGION, 2018-2030 (USD MILLION)
- TABLE 5. AERIAL WORK PLATFORMS MARKET SIZE, BY PRODUCT, 2018-2030 (USD MILLION)
- TABLE 6. AERIAL WORK PLATFORMS MARKET SIZE, BY ARTICULATED BOOM LIFT, BY REGION, 2018-2030 (USD MILLION)
- TABLE 7. AERIAL WORK PLATFORMS MARKET SIZE, BY CRAWLER LIFT, BY REGION, 2018-2030 (USD MILLION)
- TABLE 8. AERIAL WORK PLATFORMS MARKET SIZE, BY SCISSOR LIFT, BY REGION, 2018-2030 (USD MILLION)
- TABLE 9. AERIAL WORK PLATFORMS MARKET SIZE, BY SPIDER LIFT, BY REGION, 2018-2030 (USD MILLION)
- TABLE 10. AERIAL WORK PLATFORMS MARKET SIZE, BY TELESCOPIC BOOM, BY REGION, 2018-2030 (USD MILLION)
- TABLE 11. AERIAL WORK PLATFORMS MARKET SIZE, BY TRAILER MOUNTED LIFT, BY REGION, 2018-2030 (USD MILLION)
- TABLE 12. AERIAL WORK PLATFORMS MARKET SIZE, BY TRUCK MOUNTED LIFT, BY REGION, 2018-2030 (USD MILLION)
- TABLE 13. AERIAL WORK PLATFORMS MARKET SIZE, BY VERTICAL LIFT, BY REGION, 2018-2030 (USD MILLION)
- TABLE 14. AERIAL WORK PLATFORMS MARKET SIZE, BY PROPULSION TYPE, 2018-2030 (USD MILLION)
- TABLE 15. AERIAL WORK PLATFORMS MARKET SIZE, BY DIESEL, BY REGION, 2018-2030 (USD MILLION)
- TABLE 16. AERIAL WORK PLATFORMS MARKET SIZE, BY ELECTRIC, BY REGION, 2018-2030 (USD MILLION)
- TABLE 17. AERIAL WORK PLATFORMS MARKET SIZE, BY HYBRID, BY REGION, 2018-2030 (USD MILLION)
- TABLE 18. AERIAL WORK PLATFORMS MARKET SIZE, BY PETROL, BY REGION, 2018-2030 (USD MILLION)
- TABLE 19. AERIAL WORK PLATFORMS MARKET SIZE, BY APPLICATION, 2018-2030 (USD MILLION)
- TABLE 20. AERIAL WORK PLATFORMS MARKET SIZE, BY AEROSPACE & DEFENSE, BY REGION, 2018-2030 (USD MILLION)
- TABLE 21. AERIAL WORK PLATFORMS MARKET SIZE, BY AUTOMOTIVE & TRANSPORTATION, BY REGION, 2018-2030 (USD MILLION)
- TABLE 22. AERIAL WORK PLATFORMS MARKET SIZE, BY BUILDING, CONSTRUCTION & REAL ESTATE, BY REGION, 2018-2030 (USD MILLION)
- TABLE 23. AERIAL WORK PLATFORMS MARKET SIZE, BY ENERGY & UTILITIES, BY REGION, 2018-2030 (USD MILLION)
- TABLE 24. AERIAL WORK PLATFORMS MARKET SIZE, BY OIL & GAS, BY REGION, 2018-2030 (USD MILLION)
- TABLE 25. AERIAL WORK PLATFORMS MARKET SIZE, BY TELECOMMUNICATION, BY REGION, 2018-2030 (USD MILLION)
- TABLE 26. AMERICAS AERIAL WORK PLATFORMS MARKET SIZE, BY PRODUCT, 2018-2030 (USD MILLION)
- TABLE 27. AMERICAS AERIAL WORK PLATFORMS MARKET SIZE, BY PROPULSION TYPE, 2018-2030 (USD MILLION)
- TABLE 28. AMERICAS AERIAL WORK PLATFORMS MARKET SIZE, BY APPLICATION, 2018-2030 (USD MILLION)
- TABLE 29. AMERICAS AERIAL WORK PLATFORMS MARKET SIZE, BY COUNTRY, 2018-2030 (USD MILLION)
- TABLE 30. ARGENTINA AERIAL WORK PLATFORMS MARKET SIZE, BY PRODUCT, 2018-2030 (USD MILLION)
- TABLE 31. ARGENTINA AERIAL WORK PLATFORMS MARKET SIZE, BY PROPULSION TYPE, 2018-2030 (USD MILLION)
- TABLE 32. ARGENTINA AERIAL WORK PLATFORMS MARKET SIZE, BY APPLICATION, 2018-2030 (USD MILLION)
- TABLE 33. BRAZIL AERIAL WORK PLATFORMS MARKET SIZE, BY PRODUCT, 2018-2030 (USD MILLION)
- TABLE 34. BRAZIL AERIAL WORK PLATFORMS MARKET SIZE, BY PROPULSION TYPE, 2018-2030 (USD MILLION)
- TABLE 35. BRAZIL AERIAL WORK PLATFORMS MARKET SIZE, BY APPLICATION, 2018-2030 (USD MILLION)
- TABLE 36. CANADA AERIAL WORK PLATFORMS MARKET SIZE, BY PRODUCT, 2018-2030 (USD MILLION)
- TABLE 37. CANADA AERIAL WORK PLATFORMS MARKET SIZE, BY PROPULSION TYPE, 2018-2030 (USD MILLION)
- TABLE 38. CANADA AERIAL WORK PLATFORMS MARKET SIZE, BY APPLICATION, 2018-2030 (USD MILLION)
- TABLE 39. MEXICO AERIAL WORK PLATFORMS MARKET SIZE, BY PRODUCT, 2018-2030 (USD MILLION)
- TABLE 40. MEXICO AERIAL WORK PLATFORMS MARKET SIZE, BY PROPULSION TYPE, 2018-2030 (USD MILLION)
- TABLE 41. MEXICO AERIAL WORK PLATFORMS MARKET SIZE, BY APPLICATION, 2018-2030 (USD MILLION)
- TABLE 42. UNITED STATES AERIAL WORK PLATFORMS MARKET SIZE, BY PRODUCT, 2018-2030 (USD MILLION)
- TABLE 43. UNITED STATES AERIAL WORK PLATFORMS MARKET SIZE, BY PROPULSION TYPE, 2018-2030 (USD MILLION)
- TABLE 44. UNITED STATES AERIAL WORK PLATFORMS MARKET SIZE, BY APPLICATION, 2018-2030 (USD MILLION)
- TABLE 45. UNITED STATES AERIAL WORK PLATFORMS MARKET SIZE, BY STATE, 2018-2030 (USD MILLION)
- TABLE 46. ASIA-PACIFIC AERIAL WORK PLATFORMS MARKET SIZE, BY PRODUCT, 2018-2030 (USD MILLION)
- TABLE 47. ASIA-PACIFIC AERIAL WORK PLATFORMS MARKET SIZE, BY PROPULSION TYPE, 2018-2030 (USD MILLION)
- TABLE 48. ASIA-PACIFIC AERIAL WORK PLATFORMS MARKET SIZE, BY APPLICATION, 2018-2030 (USD MILLION)
- TABLE 49. ASIA-PACIFIC AERIAL WORK PLATFORMS MARKET SIZE, BY COUNTRY, 2018-2030 (USD MILLION)
- TABLE 50. AUSTRALIA AERIAL WORK PLATFORMS MARKET SIZE, BY PRODUCT, 2018-2030 (USD MILLION)
- TABLE 51. AUSTRALIA AERIAL WORK PLATFORMS MARKET SIZE, BY PROPULSION TYPE, 2018-2030 (USD MILLION)
- TABLE 52. AUSTRALIA AERIAL WORK PLATFORMS MARKET SIZE, BY APPLICATION, 2018-2030 (USD MILLION)
- TABLE 53. CHINA AERIAL WORK PLATFORMS MARKET SIZE, BY PRODUCT, 2018-2030 (USD MILLION)
- TABLE 54. CHINA AERIAL WORK PLATFORMS MARKET SIZE, BY PROPULSION TYPE, 2018-2030 (USD MILLION)
- TABLE 55. CHINA AERIAL WORK PLATFORMS MARKET SIZE, BY APPLICATION, 2018-2030 (USD MILLION)
- TABLE 56. INDIA AERIAL WORK PLATFORMS MARKET SIZE, BY PRODUCT, 2018-2030 (USD MILLION)
- TABLE 57. INDIA AERIAL WORK PLATFORMS MARKET SIZE, BY PROPULSION TYPE, 2018-2030 (USD MILLION)
- TABLE 58. INDIA AERIAL WORK PLATFORMS MARKET SIZE, BY APPLICATION, 2018-2030 (USD MILLION)
- TABLE 59. INDONESIA AERIAL WORK PLATFORMS MARKET SIZE, BY PRODUCT, 2018-2030 (USD MILLION)
- TABLE 60. INDONESIA AERIAL WORK PLATFORMS MARKET SIZE, BY PROPULSION TYPE, 2018-2030 (USD MILLION)
- TABLE 61. INDONESIA AERIAL WORK PLATFORMS MARKET SIZE, BY APPLICATION, 2018-2030 (USD MILLION)
- TABLE 62. JAPAN AERIAL WORK PLATFORMS MARKET SIZE, BY PRODUCT, 2018-2030 (USD MILLION)
- TABLE 63. JAPAN AERIAL WORK PLATFORMS MARKET SIZE, BY PROPULSION TYPE, 2018-2030 (USD MILLION)
- TABLE 64. JAPAN AERIAL WORK PLATFORMS MARKET SIZE, BY APPLICATION, 2018-2030 (USD MILLION)
- TABLE 65. MALAYSIA AERIAL WORK PLATFORMS MARKET SIZE, BY PRODUCT, 2018-2030 (USD MILLION)
- TABLE 66. MALAYSIA AERIAL WORK PLATFORMS MARKET SIZE, BY PROPULSION TYPE, 2018-2030 (USD MILLION)
- TABLE 67. MALAYSIA AERIAL WORK PLATFORMS MARKET SIZE, BY APPLICATION, 2018-2030 (USD MILLION)
- TABLE 68. PHILIPPINES AERIAL WORK PLATFORMS MARKET SIZE, BY PRODUCT, 2018-2030 (USD MILLION)
- TABLE 69. PHILIPPINES AERIAL WORK PLATFORMS MARKET SIZE, BY PROPULSION TYPE, 2018-2030 (USD MILLION)
- TABLE 70. PHILIPPINES AERIAL WORK PLATFORMS MARKET SIZE, BY APPLICATION, 2018-2030 (USD MILLION)
- TABLE 71. SINGAPORE AERIAL WORK PLATFORMS MARKET SIZE, BY PRODUCT, 2018-2030 (USD MILLION)
- TABLE 72. SINGAPORE AERIAL WORK PLATFORMS MARKET SIZE, BY PROPULSION TYPE, 2018-2030 (USD MILLION)
- TABLE 73. SINGAPORE AERIAL WORK PLATFORMS MARKET SIZE, BY APPLICATION, 2018-2030 (USD MILLION)
- TABLE 74. SOUTH KOREA AERIAL WORK PLATFORMS MARKET SIZE, BY PRODUCT, 2018-2030 (USD MILLION)
- TABLE 75. SOUTH KOREA AERIAL WORK PLATFORMS MARKET SIZE, BY PROPULSION TYPE, 2018-2030 (USD MILLION)
- TABLE 76. SOUTH KOREA AERIAL WORK PLATFORMS MARKET SIZE, BY APPLICATION, 2018-2030 (USD MILLION)
- TABLE 77. TAIWAN AERIAL WORK PLATFORMS MARKET SIZE, BY PRODUCT, 2018-2030 (USD MILLION)
- TABLE 78. TAIWAN AERIAL WORK PLATFORMS MARKET SIZE, BY PROPULSION TYPE, 2018-2030 (USD MILLION)
- TABLE 79. TAIWAN AERIAL WORK PLATFORMS MARKET SIZE, BY APPLICATION, 2018-2030 (USD MILLION)
- TABLE 80. THAILAND AERIAL WORK PLATFORMS MARKET SIZE, BY PRODUCT, 2018-2030 (USD MILLION)
- TABLE 81. THAILAND AERIAL WORK PLATFORMS MARKET SIZE, BY PROPULSION TYPE, 2018-2030 (USD MILLION)
- TABLE 82. THAILAND AERIAL WORK PLATFORMS MARKET SIZE, BY APPLICATION, 2018-2030 (USD MILLION)
- TABLE 83. VIETNAM AERIAL WORK PLATFORMS MARKET SIZE, BY PRODUCT, 2018-2030 (USD MILLION)
- TABLE 84. VIETNAM AERIAL WORK PLATFORMS MARKET SIZE, BY PROPULSION TYPE, 2018-2030 (USD MILLION)
- TABLE 85. VIETNAM AERIAL WORK PLATFORMS MARKET SIZE, BY APPLICATION, 2018-2030 (USD MILLION)
- TABLE 86. EUROPE, MIDDLE EAST & AFRICA AERIAL WORK PLATFORMS MARKET SIZE, BY PRODUCT, 2018-2030 (USD MILLION)
- TABLE 87. EUROPE, MIDDLE EAST & AFRICA AERIAL WORK PLATFORMS MARKET SIZE, BY PROPULSION TYPE, 2018-2030 (USD MILLION)
- TABLE 88. EUROPE, MIDDLE EAST & AFRICA AERIAL WORK PLATFORMS MARKET SIZE, BY APPLICATION, 2018-2030 (USD MILLION)
- TABLE 89. EUROPE, MIDDLE EAST & AFRICA AERIAL WORK PLATFORMS MARKET SIZE, BY COUNTRY, 2018-2030 (USD MILLION)
- TABLE 90. DENMARK AERIAL WORK PLATFORMS MARKET SIZE, BY PRODUCT, 2018-2030 (USD MILLION)
- TABLE 91. DENMARK AERIAL WORK PLATFORMS MARKET SIZE, BY PROPULSION TYPE, 2018-2030 (USD MILLION)
- TABLE 92. DENMARK AERIAL WORK PLATFORMS MARKET SIZE, BY APPLICATION, 2018-2030 (USD MILLION)
- TABLE 93. EGYPT AERIAL WORK PLATFORMS MARKET SIZE, BY PRODUCT, 2018-2030 (USD MILLION)
- TABLE 94. EGYPT AERIAL WORK PLATFORMS MARKET SIZE, BY PROPULSION TYPE, 2018-2030 (USD MILLION)
- TABLE 95. EGYPT AERIAL WORK PLATFORMS MARKET SIZE, BY APPLICATION, 2018-2030 (USD MILLION)
- TABLE 96. FINLAND AERIAL WORK PLATFORMS MARKET SIZE, BY PRODUCT, 2018-2030 (USD MILLION)
- TABLE 97. FINLAND AERIAL WORK PLATFORMS MARKET SIZE, BY PROPULSION TYPE, 2018-2030 (USD MILLION)
- TABLE 98. FINLAND AERIAL WORK PLATFORMS MARKET SIZE, BY APPLICATION, 2018-2030 (USD MILLION)
- TABLE 99. FRANCE AERIAL WORK PLATFORMS MARKET SIZE, BY PRODUCT, 2018-2030 (USD MILLION)
- TABLE 100. FRANCE AERIAL WORK PLATFORMS MARKET SIZE, BY PROPULSION TYPE, 2018-2030 (USD MILLION)
- TABLE 101. FRANCE AERIAL WORK PLATFORMS MARKET SIZE, BY APPLICATION, 2018-2030 (USD MILLION)
- TABLE 102. GERMANY AERIAL WORK PLATFORMS MARKET SIZE, BY PRODUCT, 2018-2030 (USD MILLION)
- TABLE 103. GERMANY AERIAL WORK PLATFORMS MARKET SIZE, BY PROPULSION TYPE, 2018-2030 (USD MILLION)
- TABLE 104. GERMANY AERIAL WORK PLATFORMS MARKET SIZE, BY APPLICATION, 2018-2030 (USD MILLION)
- TABLE 105. ISRAEL AERIAL WORK PLATFORMS MARKET SIZE, BY PRODUCT, 2018-2030 (USD MILLION)
- TABLE 106. ISRAEL AERIAL WORK PLATFORMS MARKET SIZE, BY PROPULSION TYPE, 2018-2030 (USD MILLION)
- TABLE 107. ISRAEL AERIAL WORK PLATFORMS MARKET SIZE, BY APPLICATION, 2018-2030 (USD MILLION)
- TABLE 108. ITALY AERIAL WORK PLATFORMS MARKET SIZE, BY PRODUCT, 2018-2030 (USD MILLION)
- TABLE 109. ITALY AERIAL WORK PLATFORMS MARKET SIZE, BY PROPULSION TYPE, 2018-2030 (USD MILLION)
- TABLE 110. ITALY AERIAL WORK PLATFORMS MARKET SIZE, BY APPLICATION, 2018-2030 (USD MILLION)
- TABLE 111. NETHERLANDS AERIAL WORK PLATFORMS MARKET SIZE, BY PRODUCT, 2018-2030 (USD MILLION)
- TABLE 112. NETHERLANDS AERIAL WORK PLATFORMS MARKET SIZE, BY PROPULSION TYPE, 2018-2030 (USD MILLION)
- TABLE 113. NETHERLANDS AERIAL WORK PLATFORMS MARKET SIZE, BY APPLICATION, 2018-2030 (USD MILLION)
- TABLE 114. NIGERIA AERIAL WORK PLATFORMS MARKET SIZE, BY PRODUCT, 2018-2030 (USD MILLION)
- TABLE 115. NIGERIA AERIAL WORK PLATFORMS MARKET SIZE, BY PROPULSION TYPE, 2018-2030 (USD MILLION)
- TABLE 116. NIGERIA AERIAL WORK PLATFORMS MARKET SIZE, BY APPLICATION, 2018-2030 (USD MILLION)
- TABLE 117. NORWAY AERIAL WORK PLATFORMS MARKET SIZE, BY PRODUCT, 2018-2030 (USD MILLION)
- TABLE 118. NORWAY AERIAL WORK PLATFORMS MARKET SIZE, BY PROPULSION TYPE, 2018-2030 (USD MILLION)
- TABLE 119. NORWAY AERIAL WORK PLATFORMS MARKET SIZE, BY APPLICATION, 2018-2030 (USD MILLION)
- TABLE 120. POLAND AERIAL WORK PLATFORMS MARKET SIZE, BY PRODUCT, 2018-2030 (USD MILLION)
- TABLE 121. POLAND AERIAL WORK PLATFORMS MARKET SIZE, BY PROPULSION TYPE, 2018-2030 (USD MILLION)
- TABLE 122. POLAND AERIAL WORK PLATFORMS MARKET SIZE, BY APPLICATION, 2018-2030 (USD MILLION)
- TABLE 123. QATAR AERIAL WORK PLATFORMS MARKET SIZE, BY PRODUCT, 2018-2030 (USD MILLION)
- TABLE 124. QATAR AERIAL WORK PLATFORMS MARKET SIZE, BY PROPULSION TYPE, 2018-2030 (USD MILLION)
- TABLE 125. QATAR AERIAL WORK PLATFORMS MARKET SIZE, BY APPLICATION, 2018-2030 (USD MILLION)
- TABLE 126. RUSSIA AERIAL WORK PLATFORMS MARKET SIZE, BY PRODUCT, 2018-2030 (USD MILLION)
- TABLE 127. RUSSIA AERIAL WORK PLATFORMS MARKET SIZE, BY PROPULSION TYPE, 2018-2030 (USD MILLION)
- TABLE 128. RUSSIA AERIAL WORK PLATFORMS MARKET SIZE, BY APPLICATION, 2018-2030 (USD MILLION)
- TABLE 129. SAUDI ARABIA AERIAL WORK PLATFORMS MARKET SIZE, BY PRODUCT, 2018-2030 (USD MILLION)
- TABLE 130. SAUDI ARABIA AERIAL WORK PLATFORMS MARKET SIZE, BY PROPULSION TYPE, 2018-2030 (USD MILLION)
- TABLE 131. SAUDI ARABIA AERIAL WORK PLATFORMS MARKET SIZE, BY APPLICATION, 2018-2030 (USD MILLION)
- TABLE 132. SOUTH AFRICA AERIAL WORK PLATFORMS MARKET SIZE, BY PRODUCT, 2018-2030 (USD MILLION)
- TABLE 133. SOUTH AFRICA AERIAL WORK PLATFORMS MARKET SIZE, BY PROPULSION TYPE, 2018-2030 (USD MILLION)
- TABLE 134. SOUTH AFRICA AERIAL WORK PLATFORMS MARKET SIZE, BY APPLICATION, 2018-2030 (USD MILLION)
- TABLE 135. SPAIN AERIAL WORK PLATFORMS MARKET SIZE, BY PRODUCT, 2018-2030 (USD MILLION)
- TABLE 136. SPAIN AERIAL WORK PLATFORMS MARKET SIZE, BY PROPULSION TYPE, 2018-2030 (USD MILLION)
- TABLE 137. SPAIN AERIAL WORK PLATFORMS MARKET SIZE, BY APPLICATION, 2018-2030 (USD MILLION)
- TABLE 138. SWEDEN AERIAL WORK PLATFORMS MARKET SIZE, BY PRODUCT, 2018-2030 (USD MILLION)
- TABLE 139. SWEDEN AERIAL WORK PLATFORMS MARKET SIZE, BY PROPULSION TYPE, 2018-2030 (USD MILLION)
- TABLE 140. SWEDEN AERIAL WORK PLATFORMS MARKET SIZE, BY APPLICATION, 2018-2030 (USD MILLION)
- TABLE 141. SWITZERLAND AERIAL WORK PLATFORMS MARKET SIZE, BY PRODUCT, 2018-2030 (USD MILLION)
- TABLE 142. SWITZERLAND AERIAL WORK PLATFORMS MARKET SIZE, BY PROPULSION TYPE, 2018-2030 (USD MILLION)
- TABLE 143. SWITZERLAND AERIAL WORK PLATFORMS MARKET SIZE, BY APPLICATION, 2018-2030 (USD MILLION)
- TABLE 144. TURKEY AERIAL WORK PLATFORMS MARKET SIZE, BY PRODUCT, 2018-2030 (USD MILLION)
- TABLE 145. TURKEY AERIAL WORK PLATFORMS MARKET SIZE, BY PROPULSION TYPE, 2018-2030 (USD MILLION)
- TABLE 146. TURKEY AERIAL WORK PLATFORMS MARKET SIZE, BY APPLICATION, 2018-2030 (USD MILLION)
- TABLE 147. UNITED ARAB EMIRATES AERIAL WORK PLATFORMS MARKET SIZE, BY PRODUCT, 2018-2030 (USD MILLION)
- TABLE 148. UNITED ARAB EMIRATES AERIAL WORK PLATFORMS MARKET SIZE, BY PROPULSION TYPE, 2018-2030 (USD MILLION)
- TABLE 149. UNITED ARAB EMIRATES AERIAL WORK PLATFORMS MARKET SIZE, BY APPLICATION, 2018-2030 (USD MILLION)
- TABLE 150. UNITED KINGDOM AERIAL WORK PLATFORMS MARKET SIZE, BY PRODUCT, 2018-2030 (USD MILLION)
- TABLE 151. UNITED KINGDOM AERIAL WORK PLATFORMS MARKET SIZE, BY PROPULSION TYPE, 2018-2030 (USD MILLION)
- TABLE 152. UNITED KINGDOM AERIAL WORK PLATFORMS MARKET SIZE, BY APPLICATION, 2018-2030 (USD MILLION)
- TABLE 153. AERIAL WORK PLATFORMS MARKET, FPNV POSITIONING MATRIX, 2022
- TABLE 154. AERIAL WORK PLATFORMS MARKET SHARE, BY KEY PLAYER, 2022
- TABLE 155. AERIAL WORK PLATFORMS MARKET LICENSE & PRICING
[182 Pages Report] The Aerial Work Platforms Market size was estimated at USD 8.27 billion in 2022 and expected to reach USD 8.89 billion in 2023, at a CAGR 8.55% to reach USD 15.95 billion by 2030.
Global Aerial Work Platforms Market
| KEY MARKET STATISTICS | |
|---|---|
| Base Year [2022] | USD 8.27 billion |
| Estimated Year [2023] | USD 8.89 billion |
| Forecast Year [2030] | USD 15.95 billion |
| CAGR (%) | 8.55% |
An aerial work platform (AWP) used to provide temporary access for people to inaccessible areas, usually at height. AWPs are commonly found in construction and maintenance industries and can come in various forms, such as scissor lifts, boom lifts, and vertical mast lifts. The aerial work platforms have replaced more dangerous methods of accessing heights by providing a stable platform to work. The increasing construction activities and infrastructure projects around the globe fuel the demand for AWPs. Moreover, the push towards automation and electrification of industrial operations has broadened the scope to include new, innovative AWPs. However, the initial investment required for modern AWPs can be a barrier for small to medium enterprises. In addition, the need for skilled operators and the costs associated with training can limit the deployment of aerial work platforms. Nevertheless, innovations such as electric and hybrid lifts for environmentally sensitive operations encourage the adoption of AWPs across diverse end-user industries. The ongoing research for autonomy and smart safety systems for AWPs is expected to drive market growth in the coming years.
Regional Insights
The Asia Pacific region is witnessing rapid infrastructure growth, leading to an increased demand for AWPs. The emerging economies in the Asia-Pacific are experiencing significant construction activities, driving demand for AWPs. The region's consumers increasingly prefer rental options due to the lower capital investment and maintenance costs. A strong demand for AWPs is attributed to large-scale construction, maintenance activities, and a vibrant entertainment industry requiring temporary installations in the Americas. Significant investments in the Americas revolve around fleet expansion and sustainability. The EMEA region presents a diverse AWP market, with EU countries exhibiting a high adoption rate due to stringent safety regulations and an emphasis on energy-efficient machines. The Middle East, with its significant investment in infrastructure and commercial projects, offers considerable growth potential for AWPs.
FPNV Positioning Matrix
The FPNV Positioning Matrix is pivotal in evaluating the Aerial Work Platforms Market. It offers a comprehensive assessment of vendors, examining key metrics related to Business Strategy and Product Satisfaction. This in-depth analysis empowers users to make well-informed decisions aligned with their requirements. Based on the evaluation, the vendors are then categorized into four distinct quadrants representing varying levels of success: Forefront (F), Pathfinder (P), Niche (N), or Vital (V).
Market Share Analysis
The Market Share Analysis is a comprehensive tool that provides an insightful and in-depth examination of the current state of vendors in the Aerial Work Platforms Market. By meticulously comparing and analyzing vendor contributions in terms of overall revenue, customer base, and other key metrics, we can offer companies a greater understanding of their performance and the challenges they face when competing for market share. Additionally, this analysis provides valuable insights into the competitive nature of the sector, including factors such as accumulation, fragmentation dominance, and amalgamation traits observed over the base year period studied. With this expanded level of detail, vendors can make more informed decisions and devise effective strategies to gain a competitive edge in the market.
Key Company Profiles
The report delves into recent significant developments in the Aerial Work Platforms Market, highlighting leading vendors and their innovative profiles. These include Advance Lifts, Inc., Aichi Corporation, Altec Industries, Inc., Dinolift OY, EdmoLift AB, Elliott Equipment Company, Haulotte Group, Holland Lift International B.V., Hunan RUNSHARE Heavy Industry Company, Ltd., Hunan Sinoboom Intelligent Equipment Co, Ltd., JLG Industries, Inc., Klubb, Linamar Corporation, Manitex International, Inc., MEC Aerial Work Platforms, MORN LIFT, Nidec Corporation, Niftylift Ltd., Snorkel International, LLC, Socage S.r.l., SOOSAN CSM, Tadano Ltd., Terex Corporation, WIESE USA, Zhejiang Dingli Machinery Co., Ltd., and Zoomlion Heavy Industry Science&Technology Co., Ltd..
Market Segmentation & Coverage
This research report categorizes the Aerial Work Platforms Market to forecast the revenues and analyze trends in each of the following sub-markets:
- Product
- Articulated Boom Lift
- Crawler Lift
- Scissor Lift
- Spider Lift
- Telescopic boom
- Trailer Mounted Lift
- Truck Mounted Lift
- Vertical Lift
- Propulsion Type
- Diesel
- Electric
- Hybrid
- Petrol
- Application
- Aerospace & Defense
- Automotive & Transportation
- Building, Construction & Real Estate
- Energy & Utilities
- Oil & Gas
- Telecommunication
- Region
- Americas
- Argentina
- Brazil
- Canada
- Mexico
- United States
- California
- Florida
- Illinois
- New York
- Ohio
- Pennsylvania
- Texas
- Asia-Pacific
- Australia
- China
- India
- Indonesia
- Japan
- Malaysia
- Philippines
- Singapore
- South Korea
- Taiwan
- Thailand
- Vietnam
- Europe, Middle East & Africa
- Denmark
- Egypt
- Finland
- France
- Germany
- Israel
- Italy
- Netherlands
- Nigeria
- Norway
- Poland
- Qatar
- Russia
- Saudi Arabia
- South Africa
- Spain
- Sweden
- Switzerland
- Turkey
- United Arab Emirates
- United Kingdom
- Americas
The report offers valuable insights on the following aspects:
1. Market Penetration: It presents comprehensive information on the market provided by key players.
2. Market Development: It delves deep into lucrative emerging markets and analyzes the penetration across mature market segments.
3. Market Diversification: It provides detailed information on new product launches, untapped geographic regions, recent developments, and investments.
4. Competitive Assessment & Intelligence: It conducts an exhaustive assessment of market shares, strategies, products, certifications, regulatory approvals, patent landscape, and manufacturing capabilities of the leading players.
5. Product Development & Innovation: It offers intelligent insights on future technologies, R&D activities, and breakthrough product developments.
The report addresses key questions such as:
1. What is the market size and forecast of the Aerial Work Platforms Market?
2. Which products, segments, applications, and areas should one consider investing in over the forecast period in the Aerial Work Platforms Market?
3. What are the technology trends and regulatory frameworks in the Aerial Work Platforms Market?
4. What is the market share of the leading vendors in the Aerial Work Platforms Market?
5. Which modes and strategic moves are suitable for entering the Aerial Work Platforms Market?
Table of Contents
1. Preface
- 1.1. Objectives of the Study
- 1.2. Market Segmentation & Coverage
- 1.3. Years Considered for the Study
- 1.4. Currency & Pricing
- 1.5. Language
- 1.6. Limitations
- 1.7. Assumptions
- 1.8. Stakeholders
2. Research Methodology
- 2.1. Define: Research Objective
- 2.2. Determine: Research Design
- 2.3. Prepare: Research Instrument
- 2.4. Collect: Data Source
- 2.5. Analyze: Data Interpretation
- 2.6. Formulate: Data Verification
- 2.7. Publish: Research Report
- 2.8. Repeat: Report Update
3. Executive Summary
4. Market Overview
- 4.1. Introduction
- 4.2. Aerial Work Platforms Market, by Region
5. Market Insights
- 5.1. Market Dynamics
- 5.1.1. Drivers
- 5.1.1.1. Rising Reconstruction and Periodic Maintenance of Buildings
- 5.1.1.2. Increasing Demand for Material Handling in Manufacturing Units and Factories
- 5.1.2. Restraints
- 5.1.2.1. Lack of Skilled Operators and Potential Hazard Related to Aerial Work Platform
- 5.1.3. Opportunities
- 5.1.3.1. Technological Advancements in AWP to Improve Product Capability and Operational Performance
- 5.1.3.2. Growing Investment in Construction Industry and Infrastructure Development
- 5.1.4. Challenges
- 5.1.4.1. Increasing Preferences and Easy Availability of AWP Platform Rental Services
- 5.1.1. Drivers
- 5.2. Market Segmentation Analysis
- 5.2.1. Product: Significant usage of scissor lifts in warehouse activities
- 5.2.2. Propulsion Type: Emerging penetration of electric-powered aerial work platforms
- 5.2.3. Application: Major adoption of aerial work platforms in building, construction, and real estate sector
- 5.3. Market Trend Analysis
- 5.4. Cumulative Impact of COVID-19
- 5.5. Cumulative Impact of Russia-Ukraine Conflict
- 5.6. Cumulative Impact of High Inflation
- 5.7. Porter's Five Forces Analysis
- 5.7.1. Threat of New Entrants
- 5.7.2. Threat of Substitutes
- 5.7.3. Bargaining Power of Customers
- 5.7.4. Bargaining Power of Suppliers
- 5.7.5. Industry Rivalry
- 5.8. Value Chain & Critical Path Analysis
- 5.9. Regulatory Framework
- 5.10. Client Customization
6. Aerial Work Platforms Market, by Product
- 6.1. Introduction
- 6.2. Articulated Boom Lift
- 6.3. Crawler Lift
- 6.4. Scissor Lift
- 6.5. Spider Lift
- 6.6. Telescopic boom
- 6.7. Trailer Mounted Lift
- 6.8. Truck Mounted Lift
- 6.9. Vertical Lift
7. Aerial Work Platforms Market, by Propulsion Type
- 7.1. Introduction
- 7.2. Diesel
- 7.3. Electric
- 7.4. Hybrid
- 7.5. Petrol
8. Aerial Work Platforms Market, by Application
- 8.1. Introduction
- 8.2. Aerospace & Defense
- 8.3. Automotive & Transportation
- 8.4. Building, Construction & Real Estate
- 8.5. Energy & Utilities
- 8.6. Oil & Gas
- 8.7. Telecommunication
9. Americas Aerial Work Platforms Market
- 9.1. Introduction
- 9.2. Argentina
- 9.3. Brazil
- 9.4. Canada
- 9.5. Mexico
- 9.6. United States
10. Asia-Pacific Aerial Work Platforms Market
- 10.1. Introduction
- 10.2. Australia
- 10.3. China
- 10.4. India
- 10.5. Indonesia
- 10.6. Japan
- 10.7. Malaysia
- 10.8. Philippines
- 10.9. Singapore
- 10.10. South Korea
- 10.11. Taiwan
- 10.12. Thailand
- 10.13. Vietnam
11. Europe, Middle East & Africa Aerial Work Platforms Market
- 11.1. Introduction
- 11.2. Denmark
- 11.3. Egypt
- 11.4. Finland
- 11.5. France
- 11.6. Germany
- 11.7. Israel
- 11.8. Italy
- 11.9. Netherlands
- 11.10. Nigeria
- 11.11. Norway
- 11.12. Poland
- 11.13. Qatar
- 11.14. Russia
- 11.15. Saudi Arabia
- 11.16. South Africa
- 11.17. Spain
- 11.18. Sweden
- 11.19. Switzerland
- 11.20. Turkey
- 11.21. United Arab Emirates
- 11.22. United Kingdom
12. Competitive Landscape
- 12.1. FPNV Positioning Matrix
- 12.2. Market Share Analysis, By Key Player
- 12.3. Competitive Scenario Analysis, By Key Player
- 12.3.1. Merger & Acquisition
- 12.3.1.1. Tadano Buys Aerial Platform Manufacturer
- 12.3.2. Agreement, Collaboration, & Partnership
- 12.3.2.1. AlmaCrawler Signs New Partnership in France with NACELEXPERT for its Aerial Working Platform Line
- 12.3.3. Investment & Funding
- 12.3.3.1. Dubai-Based Manlift Group to Invest up to EUR 25 Million in India
- 12.3.1. Merger & Acquisition
13. Competitive Portfolio
- 13.1. Key Company Profiles
- 13.1.1. Advance Lifts, Inc.
- 13.1.2. Aichi Corporation
- 13.1.3. Altec Industries, Inc.
- 13.1.4. Dinolift OY
- 13.1.5. EdmoLift AB
- 13.1.6. Elliott Equipment Company
- 13.1.7. Haulotte Group
- 13.1.8. Holland Lift International B.V.
- 13.1.9. Hunan RUNSHARE Heavy Industry Company, Ltd.
- 13.1.10. Hunan Sinoboom Intelligent Equipment Co, Ltd.
- 13.1.11. JLG Industries, Inc.
- 13.1.12. Klubb
- 13.1.13. Linamar Corporation
- 13.1.14. Manitex International, Inc.
- 13.1.15. MEC Aerial Work Platforms
- 13.1.16. MORN LIFT
- 13.1.17. Nidec Corporation
- 13.1.18. Niftylift Ltd.
- 13.1.19. Snorkel International, LLC
- 13.1.20. Socage S.r.l.
- 13.1.21. SOOSAN CSM
- 13.1.22. Tadano Ltd.
- 13.1.23. Terex Corporation
- 13.1.24. WIESE USA
- 13.1.25. Zhejiang Dingli Machinery Co., Ltd.
- 13.1.26. Zoomlion Heavy Industry Science&Technology Co., Ltd.
- 13.2. Key Product Portfolio
14. Appendix
- 14.1. Discussion Guide
- 14.2. License & Pricing