|
|
市場調査レポート
商品コード
1645572
プレインシュレートパイプの世界市場 2025~2029年Global Pre-insulated Pipes Market 2025-2029 |
||||||

|
|||||||
カスタマイズ可能
|
|||||||


| プレインシュレートパイプの世界市場 2025~2029年 |
|
出版日: 2025年01月18日
発行: TechNavio
ページ情報: 英文 191 Pages
納期: 即納可能
|

全表示
- 概要
- 図表
- 目次
プレインシュレートパイプ市場は2024~2029年に59億3,770万米ドル、予測期間中のCAGRは11.7%で成長すると予測されます。
当レポートでは、プレインシュレートパイプ市場の全体的な分析、市場規模・予測、動向、成長促進要因、課題、約25のベンダーを網羅したベンダー分析などを掲載しています。
現在の市場シナリオ、最新動向と促進要因、市場環境全体に関する最新分析を提供しています。市場は、地域冷暖房システムの世界の利用増加、二酸化炭素排出量の削減とエネルギー効率の向上、建設と産業部門におけるプレインシュレートパイプの需要増加が牽引しています。
| 市場範囲 | |
|---|---|
| 基準年 | 2025年 |
| 終了年 | 2029年 |
| 予測期間 | 2025~2029年 |
| 成長モメンタム | 加速 |
| 前年比[2025年] | 10.1% |
| CAGR | 11.7% |
| 増分額 | 59億3,770万米ドル |
本調査では、超深海油田における需要の増加が、今後数年間のプレインシュレートパイプ市場成長を牽引する主要要因の1つであるとしています。また、太陽光発電設備におけるプレインシュレートパイプや、プレインシュレーテッドパイプの設計における技術革新も、市場の大きな需要につながると考えられます。
目次
第1章 エグゼクティブサマリー
- 市場概要
第2章 Technavio分析
- 価格・ライフサイクル・顧客購入バスケット・採用率・購入基準の分析
- インプットの重要性と差別化の要因
- 混乱の要因
- 促進要因と課題の影響
第3章 市場情勢
- 市場エコシステム
- 市場の特徴
- バリューチェーン分析
第4章 市場規模
- 市場の定義
- 市場セグメント分析
- 市場規模 2024年
- 市場の展望 2024~2029年
第5章 市場規模実績
- プレインシュレートパイプの世界市場 2019~2023年
- 製品別セグメント分析 2019~2023年
- 設置場所セグメント分析 2019~2023年
- 地域別セグメント分析 2019~2023年
- 国別セグメント分析 2019~2023年
第6章 定性分析
- AIの影響:プレインシュレートパイプの世界市場
第7章 ファイブフォース分析
- ファイブフォースの要約
- 買い手の交渉力
- 供給企業の交渉力
- 新規参入業者の脅威
- 代替品の脅威
- 競争の脅威
- 市況
第8章 市場セグメンテーション:製品別
- 市場セグメント
- 比較:製品別
- 柔軟型プレインシュレートパイプ:市場規模と予測 2024~2029年
- 堅固型プレインシュレートパイプ:市場規模と予測 2024~2029年
- 市場機会:製品別
第9章 市場セグメンテーション設置場所別
- 市場セグメント
- 比較設置場所別
- 地下:市場規模と予測 2024~2029年
- 地上:市場規模と予測 2024~2029年
- 市場機会設置場所別
第10章 顧客情勢
- 顧客情勢概要
第11章 地域別情勢
- 地域別セグメンテーション
- 比較:地域別
- アジア太平洋:市場規模と予測 2024~2029年
- 欧州:市場規模と予測 2024~2029年
- 北米:市場規模と予測 2024~2029年
- 中東・アフリカ:市場規模と予測 2024~2029年
- 南米:市場規模と予測 2024~2029年
- 中国:市場規模と予測 2024~2029年
- 米国:市場規模と予測 2024~2029年
- ドイツ:市場規模と予測 2024~2029年
- 日本:市場規模と予測 2024~2029年
- カナダ:市場規模と予測 2024~2029年
- インド:市場規模と予測 2024~2029年
- 英国:市場規模と予測 2024~2029年
- フランス:市場規模と予測 2024~2029年
- サウジアラビア:市場規模と予測 2024~2029年
- ブラジル:市場規模と予測 2024~2029年
- 地域情勢による市場機会
第12章 促進要因・課題・機会・抑制要因
- 市場促進要因
- 市場課題
- 促進要因と課題の影響
- 市場機会・抑制要因
第13章 競合情勢
- 概要
- 競合情勢
- 混乱の状況
- 産業のリスク
第14章 競合分析
- 企業プロファイル
- 企業ランキング指数
- 企業の市場ポジショニング
- aquatherm GmbH
- BRUGG Rohrsystem AG
- Georg Fischer Ltd.
- Hennecke GmbH
- Insul Pipe Systems
- KC Polymers Pvt. Ltd.
- LOGSTOR Denmark Holding ApS
- PEM Korea Co. Ltd.
- Perma Pipe International Holdings Inc.
- Polypipe Ltd
- Rovanco Piping Systems Inc.
- Thermaflex
- Uponor Corp.
- Watts Water Technologies Inc.
- ZECO AIRCON Ltd.
第15章 付録
Exhibits:
- Exhibits1: Executive Summary - Chart on Market Overview
- Exhibits2: Executive Summary - Data Table on Market Overview
- Exhibits3: Executive Summary - Chart on Global Market Characteristics
- Exhibits4: Executive Summary - Chart on Market By Geographical Landscape
- Exhibits5: Executive Summary - Chart on Market Segmentation by Product
- Exhibits6: Executive Summary - Chart on Market Segmentation by Installation Sites
- Exhibits7: Executive Summary - Chart on Incremental Growth
- Exhibits8: Executive Summary - Data Table on Incremental Growth
- Exhibits9: Executive Summary - Chart on Company Market Positioning
- Exhibits10: Analysis of price sensitivity, lifecycle, customer purchase basket, adoption rates, and purchase criteria
- Exhibits11: Overview on criticality of inputs and factors of differentiation
- Exhibits12: Overview on factors of disruption
- Exhibits13: Impact of drivers and challenges in 2024 and 2029
- Exhibits14: Parent Market
- Exhibits15: Data Table on - Parent Market
- Exhibits16: Market characteristics analysis
- Exhibits17: Value chain analysis
- Exhibits18: Offerings of companies included in the market definition
- Exhibits19: Market segments
- Exhibits20: Chart on Global - Market size and forecast 2024-2029 ($ million)
- Exhibits21: Data Table on Global - Market size and forecast 2024-2029 ($ million)
- Exhibits22: Chart on Global Market: Year-over-year growth 2024-2029 (%)
- Exhibits23: Data Table on Global Market: Year-over-year growth 2024-2029 (%)
- Exhibits24: Historic Market Size - Data Table on Global Pre-Insulated Pipes Market 2019 - 2023 ($ million)
- Exhibits25: Historic Market Size - Product Segment 2019 - 2023 ($ million)
- Exhibits26: Historic Market Size - Installation Sites Segment 2019 - 2023 ($ million)
- Exhibits27: Historic Market Size - Geography Segment 2019 - 2023 ($ million)
- Exhibits28: Historic Market Size - Country Segment 2019 - 2023 ($ million)
- Exhibits29: Five forces analysis - Comparison between 2024 and 2029
- Exhibits30: Bargaining power of buyers - Impact of key factors 2024 and 2029
- Exhibits31: Bargaining power of suppliers - Impact of key factors in 2024 and 2029
- Exhibits32: Threat of new entrants - Impact of key factors in 2024 and 2029
- Exhibits33: Threat of substitutes - Impact of key factors in 2024 and 2029
- Exhibits34: Threat of rivalry - Impact of key factors in 2024 and 2029
- Exhibits35: Chart on Market condition - Five forces 2024 and 2029
- Exhibits36: Chart on Product - Market share 2024-2029 (%)
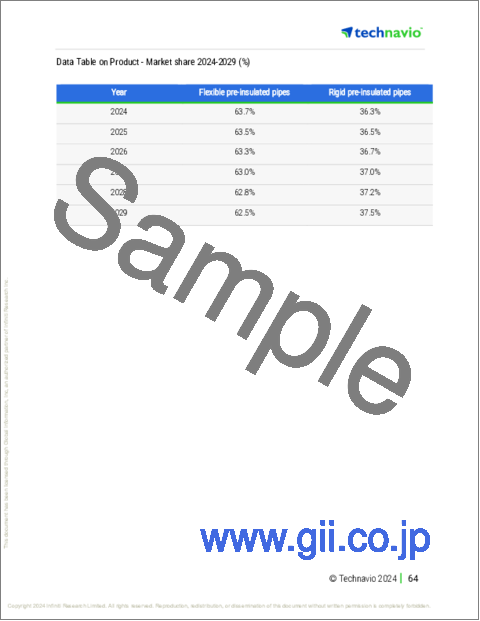
- Exhibits37: Data Table on Product - Market share 2024-2029 (%)
- Exhibits38: Chart on Comparison by Product
- Exhibits39: Data Table on Comparison by Product
- Exhibits40: Chart on Flexible pre-insulated pipes - Market size and forecast 2024-2029 ($ million)
- Exhibits41: Data Table on Flexible pre-insulated pipes - Market size and forecast 2024-2029 ($ million)
- Exhibits42: Chart on Flexible pre-insulated pipes - Year-over-year growth 2024-2029 (%)
- Exhibits43: Data Table on Flexible pre-insulated pipes - Year-over-year growth 2024-2029 (%)
- Exhibits44: Chart on Rigid pre-insulated pipes - Market size and forecast 2024-2029 ($ million)
- Exhibits45: Data Table on Rigid pre-insulated pipes - Market size and forecast 2024-2029 ($ million)
- Exhibits46: Chart on Rigid pre-insulated pipes - Year-over-year growth 2024-2029 (%)
- Exhibits47: Data Table on Rigid pre-insulated pipes - Year-over-year growth 2024-2029 (%)
- Exhibits48: Market opportunity by Product ($ million)
- Exhibits49: Data Table on Market opportunity by Product ($ million)
- Exhibits50: Chart on Installation Sites - Market share 2024-2029 (%)
- Exhibits51: Data Table on Installation Sites - Market share 2024-2029 (%)
- Exhibits52: Chart on Comparison by Installation Sites
- Exhibits53: Data Table on Comparison by Installation Sites
- Exhibits54: Chart on Below ground - Market size and forecast 2024-2029 ($ million)
- Exhibits55: Data Table on Below ground - Market size and forecast 2024-2029 ($ million)
- Exhibits56: Chart on Below ground - Year-over-year growth 2024-2029 (%)
- Exhibits57: Data Table on Below ground - Year-over-year growth 2024-2029 (%)
- Exhibits58: Chart on Above ground - Market size and forecast 2024-2029 ($ million)
- Exhibits59: Data Table on Above ground - Market size and forecast 2024-2029 ($ million)
- Exhibits60: Chart on Above ground - Year-over-year growth 2024-2029 (%)
- Exhibits61: Data Table on Above ground - Year-over-year growth 2024-2029 (%)
- Exhibits62: Market opportunity by Installation Sites ($ million)
- Exhibits63: Data Table on Market opportunity by Installation Sites ($ million)
- Exhibits64: Analysis of price sensitivity, lifecycle, customer purchase basket, adoption rates, and purchase criteria
- Exhibits65: Chart on Market share By Geographical Landscape 2024-2029 (%)
- Exhibits66: Data Table on Market share By Geographical Landscape 2024-2029 (%)
- Exhibits67: Chart on Geographic comparison
- Exhibits68: Data Table on Geographic comparison
- Exhibits69: Chart on APAC - Market size and forecast 2024-2029 ($ million)
- Exhibits70: Data Table on APAC - Market size and forecast 2024-2029 ($ million)
- Exhibits71: Chart on APAC - Year-over-year growth 2024-2029 (%)
- Exhibits72: Data Table on APAC - Year-over-year growth 2024-2029 (%)
- Exhibits73: Chart on Europe - Market size and forecast 2024-2029 ($ million)
- Exhibits74: Data Table on Europe - Market size and forecast 2024-2029 ($ million)
- Exhibits75: Chart on Europe - Year-over-year growth 2024-2029 (%)
- Exhibits76: Data Table on Europe - Year-over-year growth 2024-2029 (%)
- Exhibits77: Chart on North America - Market size and forecast 2024-2029 ($ million)
- Exhibits78: Data Table on North America - Market size and forecast 2024-2029 ($ million)
- Exhibits79: Chart on North America - Year-over-year growth 2024-2029 (%)
- Exhibits80: Data Table on North America - Year-over-year growth 2024-2029 (%)
- Exhibits81: Chart on Middle East and Africa - Market size and forecast 2024-2029 ($ million)
- Exhibits82: Data Table on Middle East and Africa - Market size and forecast 2024-2029 ($ million)
- Exhibits83: Chart on Middle East and Africa - Year-over-year growth 2024-2029 (%)
- Exhibits84: Data Table on Middle East and Africa - Year-over-year growth 2024-2029 (%)
- Exhibits85: Chart on South America - Market size and forecast 2024-2029 ($ million)
- Exhibits86: Data Table on South America - Market size and forecast 2024-2029 ($ million)
- Exhibits87: Chart on South America - Year-over-year growth 2024-2029 (%)
- Exhibits88: Data Table on South America - Year-over-year growth 2024-2029 (%)
- Exhibits89: Chart on China - Market size and forecast 2024-2029 ($ million)
- Exhibits90: Data Table on China - Market size and forecast 2024-2029 ($ million)
- Exhibits91: Chart on China - Year-over-year growth 2024-2029 (%)
- Exhibits92: Data Table on China - Year-over-year growth 2024-2029 (%)
- Exhibits93: Chart on US - Market size and forecast 2024-2029 ($ million)
- Exhibits94: Data Table on US - Market size and forecast 2024-2029 ($ million)
- Exhibits95: Chart on US - Year-over-year growth 2024-2029 (%)
- Exhibits96: Data Table on US - Year-over-year growth 2024-2029 (%)
- Exhibits97: Chart on Germany - Market size and forecast 2024-2029 ($ million)
- Exhibits98: Data Table on Germany - Market size and forecast 2024-2029 ($ million)
- Exhibits99: Chart on Germany - Year-over-year growth 2024-2029 (%)
- Exhibits100: Data Table on Germany - Year-over-year growth 2024-2029 (%)
- Exhibits101: Chart on Japan - Market size and forecast 2024-2029 ($ million)
- Exhibits102: Data Table on Japan - Market size and forecast 2024-2029 ($ million)
- Exhibits103: Chart on Japan - Year-over-year growth 2024-2029 (%)
- Exhibits104: Data Table on Japan - Year-over-year growth 2024-2029 (%)
- Exhibits105: Chart on Canada - Market size and forecast 2024-2029 ($ million)
- Exhibits106: Data Table on Canada - Market size and forecast 2024-2029 ($ million)
- Exhibits107: Chart on Canada - Year-over-year growth 2024-2029 (%)
- Exhibits108: Data Table on Canada - Year-over-year growth 2024-2029 (%)
- Exhibits109: Chart on India - Market size and forecast 2024-2029 ($ million)
- Exhibits110: Data Table on India - Market size and forecast 2024-2029 ($ million)
- Exhibits111: Chart on India - Year-over-year growth 2024-2029 (%)
- Exhibits112: Data Table on India - Year-over-year growth 2024-2029 (%)
- Exhibits113: Chart on UK - Market size and forecast 2024-2029 ($ million)
- Exhibits114: Data Table on UK - Market size and forecast 2024-2029 ($ million)
- Exhibits115: Chart on UK - Year-over-year growth 2024-2029 (%)
- Exhibits116: Data Table on UK - Year-over-year growth 2024-2029 (%)
- Exhibits117: Chart on France - Market size and forecast 2024-2029 ($ million)
- Exhibits118: Data Table on France - Market size and forecast 2024-2029 ($ million)
- Exhibits119: Chart on France - Year-over-year growth 2024-2029 (%)
- Exhibits120: Data Table on France - Year-over-year growth 2024-2029 (%)
- Exhibits121: Chart on Saudi Arabia - Market size and forecast 2024-2029 ($ million)
- Exhibits122: Data Table on Saudi Arabia - Market size and forecast 2024-2029 ($ million)
- Exhibits123: Chart on Saudi Arabia - Year-over-year growth 2024-2029 (%)
- Exhibits124: Data Table on Saudi Arabia - Year-over-year growth 2024-2029 (%)
- Exhibits125: Chart on Brazil - Market size and forecast 2024-2029 ($ million)
- Exhibits126: Data Table on Brazil - Market size and forecast 2024-2029 ($ million)
- Exhibits127: Chart on Brazil - Year-over-year growth 2024-2029 (%)
- Exhibits128: Data Table on Brazil - Year-over-year growth 2024-2029 (%)
- Exhibits129: Market opportunity By Geographical Landscape ($ million)
- Exhibits130: Data Tables on Market opportunity By Geographical Landscape ($ million)
- Exhibits131: Impact of drivers and challenges in 2024 and 2029
- Exhibits132: Overview on criticality of inputs and factors of differentiation
- Exhibits133: Overview on factors of disruption
- Exhibits134: Impact of key risks on business
- Exhibits135: Companies covered
- Exhibits136: Company ranking index
- Exhibits137: Matrix on companies position and classification
- Exhibits138: aquatherm GmbH - Overview
- Exhibits139: aquatherm GmbH - Product / Service
- Exhibits140: aquatherm GmbH - Key offerings
- Exhibits141: SWOT
- Exhibits142: BRUGG Rohrsystem AG - Overview
- Exhibits143: BRUGG Rohrsystem AG - Product / Service
- Exhibits144: BRUGG Rohrsystem AG - Key offerings
- Exhibits145: SWOT
- Exhibits146: Georg Fischer Ltd. - Overview
- Exhibits147: Georg Fischer Ltd. - Business segments
- Exhibits148: Georg Fischer Ltd. - Key offerings
- Exhibits149: Georg Fischer Ltd. - Segment focus
- Exhibits150: SWOT
- Exhibits151: Hennecke GmbH - Overview
- Exhibits152: Hennecke GmbH - Product / Service
- Exhibits153: Hennecke GmbH - Key offerings
- Exhibits154: SWOT
- Exhibits155: Insul Pipe Systems - Overview
- Exhibits156: Insul Pipe Systems - Product / Service
- Exhibits157: Insul Pipe Systems - Key offerings
- Exhibits158: SWOT
- Exhibits159: KC Polymers Pvt. Ltd. - Overview
- Exhibits160: KC Polymers Pvt. Ltd. - Product / Service
- Exhibits161: KC Polymers Pvt. Ltd. - Key offerings
- Exhibits162: SWOT
- Exhibits163: LOGSTOR Denmark Holding ApS - Overview
- Exhibits164: LOGSTOR Denmark Holding ApS - Product / Service
- Exhibits165: LOGSTOR Denmark Holding ApS - Key offerings
- Exhibits166: SWOT
- Exhibits167: PEM Korea Co. Ltd. - Overview
- Exhibits168: PEM Korea Co. Ltd. - Product / Service
- Exhibits169: PEM Korea Co. Ltd. - Key offerings
- Exhibits170: SWOT
- Exhibits171: Perma Pipe International Holdings Inc. - Overview
- Exhibits172: Perma Pipe International Holdings Inc. - Product / Service
- Exhibits173: Perma Pipe International Holdings Inc. - Key offerings
- Exhibits174: SWOT
- Exhibits175: Polypipe Ltd - Overview
- Exhibits176: Polypipe Ltd - Product / Service
- Exhibits177: Polypipe Ltd - Key offerings
- Exhibits178: SWOT
- Exhibits179: Rovanco Piping Systems Inc. - Overview
- Exhibits180: Rovanco Piping Systems Inc. - Product / Service
- Exhibits181: Rovanco Piping Systems Inc. - Key offerings
- Exhibits182: SWOT
- Exhibits183: Thermaflex - Overview
- Exhibits184: Thermaflex - Product / Service
- Exhibits185: Thermaflex - Key offerings
- Exhibits186: SWOT
- Exhibits187: Uponor Corp. - Overview
- Exhibits188: Uponor Corp. - Business segments
- Exhibits189: Uponor Corp. - Key offerings
- Exhibits190: Uponor Corp. - Segment focus
- Exhibits191: SWOT
- Exhibits192: Watts Water Technologies Inc. - Overview
- Exhibits193: Watts Water Technologies Inc. - Product / Service
- Exhibits194: Watts Water Technologies Inc. - Key offerings
- Exhibits195: SWOT
- Exhibits196: ZECO AIRCON Ltd. - Overview
- Exhibits197: ZECO AIRCON Ltd. - Product / Service
- Exhibits198: ZECO AIRCON Ltd. - Key offerings
- Exhibits199: SWOT
- Exhibits200: Inclusions checklist
- Exhibits201: Exclusions checklist
- Exhibits202: Currency conversion rates for US$
- Exhibits203: Research methodology
- Exhibits204: Information sources
- Exhibits205: Data validation
- Exhibits206: Validation techniques employed for market sizing
- Exhibits207: Data synthesis
- Exhibits208: 360 degree market analysis
- Exhibits209: List of abbreviations
The pre-insulated pipes market is forecasted to grow by USD 5937.7 mn during 2024-2029, accelerating at a CAGR of 11.7% during the forecast period. The report on the pre-insulated pipes market provides a holistic analysis, market size and forecast, trends, growth drivers, and challenges, as well as vendor analysis covering around 25 vendors.
The report offers an up-to-date analysis regarding the current market scenario, the latest trends and drivers, and the overall market environment. The market is driven by global increase in use of district heating and cooling systems, reduction in carbon footprint and increase in energy efficiency, and increase in demand for pre-insulated pipes in construction and industrial sectors.
| Market Scope | |
|---|---|
| Base Year | 2025 |
| End Year | 2029 |
| Series Year | 2025-2029 |
| Growth Momentum | Accelerate |
| YOY 2025 | 10.1% |
| CAGR | 11.7% |
| Incremental Value | $5937.7 mn |
Technavio's pre-insulated pipes market is segmented as below:
By Product
- Flexible pre-insulated pipes
- Rigid pre-insulated pipes
By Installation Sites
- Below ground
- Above ground
By Geographical Landscape
- APAC
- Europe
- North America
- Middle East and Africa
- South America
This study identifies the increase in demand in ultra-deep offshore oilfields as one of the prime reasons driving the pre-insulated pipes market growth during the next few years. Also, pre-insulated pipes in solar power installations and innovation in pre-insulated pipe designing will lead to sizable demand in the market.
The report on the pre-insulated pipes market covers the following areas:
- Pre-Insulated Pipes Market sizing
- Pre-Insulated Pipes Market forecast
- Pre-Insulated Pipes Market industry analysis
The robust vendor analysis is designed to help clients improve their market position, and in line with this, this report provides a detailed analysis of several leading pre-insulated pipes market vendors that include Alaska PUF Industries, aquatherm GmbH, BRUGG Rohrsystem AG, Georg Fischer Ltd., Hennecke GmbH, Insul Pipe Systems, KC Polymers Pvt. Ltd., KE KELIT GmbH, LOGSTOR Denmark Holding ApS, PEM Korea Co. Ltd., Perma Pipe International Holdings Inc., Polypipe Ltd, Rovanco Piping Systems Inc., Seven Star Aircon Ancillaries Pvt. Ltd., TECE GmbH, Thermaflex, Thermal Pipe Systems Inc., Uponor Corp., Watts Water Technologies Inc., and ZECO AIRCON Ltd.. Also, the pre-insulated pipes market analysis report includes information on upcoming trends and challenges that will influence market growth. This is to help companies strategize and leverage all forthcoming growth opportunities.
The study was conducted using an objective combination of primary and secondary information including inputs from key participants in the industry. The report contains a comprehensive market and vendor landscape in addition to an analysis of the key vendors.
The publisher presents a detailed picture of the market by the way of study, synthesis, and summation of data from multiple sources by an analysis of key parameters such as profit, pricing, competition, and promotions. It presents various market facets by identifying the key industry influencers. The data presented is comprehensive, reliable, and a result of extensive primary and secondary research. The market research reports provide a complete competitive landscape and an in-depth vendor selection methodology and analysis using qualitative and quantitative research to forecast accurate market growth.
Table of Contents
1 Executive Summary
- 1.1 Market overview
- Executive Summary - Chart on Market Overview
- Executive Summary - Data Table on Market Overview
- Executive Summary - Chart on Global Market Characteristics
- Executive Summary - Chart on Market By Geographical Landscape
- Executive Summary - Chart on Market Segmentation by Product
- Executive Summary - Chart on Market Segmentation by Installation Sites
- Executive Summary - Chart on Incremental Growth
- Executive Summary - Data Table on Incremental Growth
- Executive Summary - Chart on Company Market Positioning
2 Technavio Analysis
- 2.1 Analysis of price sensitivity, lifecycle, customer purchase basket, adoption rates, and purchase criteria
- Analysis of price sensitivity, lifecycle, customer purchase basket, adoption rates, and purchase criteria
- 2.2 Criticality of inputs and Factors of differentiation
- Overview on criticality of inputs and factors of differentiation
- 2.3 Factors of disruption
- Overview on factors of disruption
- 2.4 Impact of drivers and challenges
- Impact of drivers and challenges in 2024 and 2029
3 Market Landscape
- 3.1 Market ecosystem
- Parent Market
- Data Table on - Parent Market
- 3.2 Market characteristics
- Market characteristics analysis
- 3.3 Value chain analysis
- Value chain analysis
4 Market Sizing
- 4.1 Market definition
- Offerings of companies included in the market definition
- 4.2 Market segment analysis
- Market segments
- 4.3 Market size 2024
- 4.4 Market outlook: Forecast for 2024-2029
- Chart on Global - Market size and forecast 2024-2029 ($ million)
- Data Table on Global - Market size and forecast 2024-2029 ($ million)
- Chart on Global Market: Year-over-year growth 2024-2029 (%)
- Data Table on Global Market: Year-over-year growth 2024-2029 (%)
5 Historic Market Size
- 5.1 Global Pre-Insulated Pipes Market 2019 - 2023
- Historic Market Size - Data Table on Global Pre-Insulated Pipes Market 2019 - 2023 ($ million)
- 5.2 Product segment analysis 2019 - 2023
- Historic Market Size - Product Segment 2019 - 2023 ($ million)
- 5.3 Installation Sites segment analysis 2019 - 2023
- Historic Market Size - Installation Sites Segment 2019 - 2023 ($ million)
- 5.4 Geography segment analysis 2019 - 2023
- Historic Market Size - Geography Segment 2019 - 2023 ($ million)
- 5.5 Country segment analysis 2019 - 2023
- Historic Market Size - Country Segment 2019 - 2023 ($ million)
6 Qualitative Analysis
- 6.1 The AI impact on Global Pre-insulated Pipes Market
7 Five Forces Analysis
- 7.1 Five forces summary
- Five forces analysis - Comparison between 2024 and 2029
- 7.2 Bargaining power of buyers
- Bargaining power of buyers - Impact of key factors 2024 and 2029
- 7.3 Bargaining power of suppliers
- Bargaining power of suppliers - Impact of key factors in 2024 and 2029
- 7.4 Threat of new entrants
- Threat of new entrants - Impact of key factors in 2024 and 2029
- 7.5 Threat of substitutes
- Threat of substitutes - Impact of key factors in 2024 and 2029
- 7.6 Threat of rivalry
- Threat of rivalry - Impact of key factors in 2024 and 2029
- 7.7 Market condition
- Chart on Market condition - Five forces 2024 and 2029
8 Market Segmentation by Product
- 8.1 Market segments
- Chart on Product - Market share 2024-2029 (%)
- Data Table on Product - Market share 2024-2029 (%)
- 8.2 Comparison by Product
- Chart on Comparison by Product
- Data Table on Comparison by Product
- 8.3 Flexible pre-insulated pipes - Market size and forecast 2024-2029
- Chart on Flexible pre-insulated pipes - Market size and forecast 2024-2029 ($ million)
- Data Table on Flexible pre-insulated pipes - Market size and forecast 2024-2029 ($ million)
- Chart on Flexible pre-insulated pipes - Year-over-year growth 2024-2029 (%)
- Data Table on Flexible pre-insulated pipes - Year-over-year growth 2024-2029 (%)
- 8.4 Rigid pre-insulated pipes - Market size and forecast 2024-2029
- Chart on Rigid pre-insulated pipes - Market size and forecast 2024-2029 ($ million)
- Data Table on Rigid pre-insulated pipes - Market size and forecast 2024-2029 ($ million)
- Chart on Rigid pre-insulated pipes - Year-over-year growth 2024-2029 (%)
- Data Table on Rigid pre-insulated pipes - Year-over-year growth 2024-2029 (%)
- 8.5 Market opportunity by Product
- Market opportunity by Product ($ million)
- Data Table on Market opportunity by Product ($ million)
9 Market Segmentation by Installation Sites
- 9.1 Market segments
- Chart on Installation Sites - Market share 2024-2029 (%)
- Data Table on Installation Sites - Market share 2024-2029 (%)
- 9.2 Comparison by Installation Sites
- Chart on Comparison by Installation Sites
- Data Table on Comparison by Installation Sites
- 9.3 Below ground - Market size and forecast 2024-2029
- Chart on Below ground - Market size and forecast 2024-2029 ($ million)
- Data Table on Below ground - Market size and forecast 2024-2029 ($ million)
- Chart on Below ground - Year-over-year growth 2024-2029 (%)
- Data Table on Below ground - Year-over-year growth 2024-2029 (%)
- 9.4 Above ground - Market size and forecast 2024-2029
- Chart on Above ground - Market size and forecast 2024-2029 ($ million)
- Data Table on Above ground - Market size and forecast 2024-2029 ($ million)
- Chart on Above ground - Year-over-year growth 2024-2029 (%)
- Data Table on Above ground - Year-over-year growth 2024-2029 (%)
- 9.5 Market opportunity by Installation Sites
- Market opportunity by Installation Sites ($ million)
- Data Table on Market opportunity by Installation Sites ($ million)
10 Customer Landscape
- 10.1 Customer landscape overview
- Analysis of price sensitivity, lifecycle, customer purchase basket, adoption rates, and purchase criteria
11 Geographic Landscape
- 11.1 Geographic segmentation
- Chart on Market share By Geographical Landscape 2024-2029 (%)
- Data Table on Market share By Geographical Landscape 2024-2029 (%)
- 11.2 Geographic comparison
- Chart on Geographic comparison
- Data Table on Geographic comparison
- 11.3 APAC - Market size and forecast 2024-2029
- Chart on APAC - Market size and forecast 2024-2029 ($ million)
- Data Table on APAC - Market size and forecast 2024-2029 ($ million)
- Chart on APAC - Year-over-year growth 2024-2029 (%)
- Data Table on APAC - Year-over-year growth 2024-2029 (%)
- 11.4 Europe - Market size and forecast 2024-2029
- Chart on Europe - Market size and forecast 2024-2029 ($ million)
- Data Table on Europe - Market size and forecast 2024-2029 ($ million)
- Chart on Europe - Year-over-year growth 2024-2029 (%)
- Data Table on Europe - Year-over-year growth 2024-2029 (%)
- 11.5 North America - Market size and forecast 2024-2029
- Chart on North America - Market size and forecast 2024-2029 ($ million)
- Data Table on North America - Market size and forecast 2024-2029 ($ million)
- Chart on North America - Year-over-year growth 2024-2029 (%)
- Data Table on North America - Year-over-year growth 2024-2029 (%)
- 11.6 Middle East and Africa - Market size and forecast 2024-2029
- Chart on Middle East and Africa - Market size and forecast 2024-2029 ($ million)
- Data Table on Middle East and Africa - Market size and forecast 2024-2029 ($ million)
- Chart on Middle East and Africa - Year-over-year growth 2024-2029 (%)
- Data Table on Middle East and Africa - Year-over-year growth 2024-2029 (%)
- 11.7 South America - Market size and forecast 2024-2029
- Chart on South America - Market size and forecast 2024-2029 ($ million)
- Data Table on South America - Market size and forecast 2024-2029 ($ million)
- Chart on South America - Year-over-year growth 2024-2029 (%)
- Data Table on South America - Year-over-year growth 2024-2029 (%)
- 11.8 China - Market size and forecast 2024-2029
- Chart on China - Market size and forecast 2024-2029 ($ million)
- Data Table on China - Market size and forecast 2024-2029 ($ million)
- Chart on China - Year-over-year growth 2024-2029 (%)
- Data Table on China - Year-over-year growth 2024-2029 (%)
- 11.9 US - Market size and forecast 2024-2029
- Chart on US - Market size and forecast 2024-2029 ($ million)
- Data Table on US - Market size and forecast 2024-2029 ($ million)
- Chart on US - Year-over-year growth 2024-2029 (%)
- Data Table on US - Year-over-year growth 2024-2029 (%)
- 11.10 Germany - Market size and forecast 2024-2029
- Chart on Germany - Market size and forecast 2024-2029 ($ million)
- Data Table on Germany - Market size and forecast 2024-2029 ($ million)
- Chart on Germany - Year-over-year growth 2024-2029 (%)
- Data Table on Germany - Year-over-year growth 2024-2029 (%)
- 11.11 Japan - Market size and forecast 2024-2029
- Chart on Japan - Market size and forecast 2024-2029 ($ million)
- Data Table on Japan - Market size and forecast 2024-2029 ($ million)
- Chart on Japan - Year-over-year growth 2024-2029 (%)
- Data Table on Japan - Year-over-year growth 2024-2029 (%)
- 11.12 Canada - Market size and forecast 2024-2029
- Chart on Canada - Market size and forecast 2024-2029 ($ million)
- Data Table on Canada - Market size and forecast 2024-2029 ($ million)
- Chart on Canada - Year-over-year growth 2024-2029 (%)
- Data Table on Canada - Year-over-year growth 2024-2029 (%)
- 11.13 India - Market size and forecast 2024-2029
- Chart on India - Market size and forecast 2024-2029 ($ million)
- Data Table on India - Market size and forecast 2024-2029 ($ million)
- Chart on India - Year-over-year growth 2024-2029 (%)
- Data Table on India - Year-over-year growth 2024-2029 (%)
- 11.14 UK - Market size and forecast 2024-2029
- Chart on UK - Market size and forecast 2024-2029 ($ million)
- Data Table on UK - Market size and forecast 2024-2029 ($ million)
- Chart on UK - Year-over-year growth 2024-2029 (%)
- Data Table on UK - Year-over-year growth 2024-2029 (%)
- 11.15 France - Market size and forecast 2024-2029
- Chart on France - Market size and forecast 2024-2029 ($ million)
- Data Table on France - Market size and forecast 2024-2029 ($ million)
- Chart on France - Year-over-year growth 2024-2029 (%)
- Data Table on France - Year-over-year growth 2024-2029 (%)
- 11.16 Saudi Arabia - Market size and forecast 2024-2029
- Chart on Saudi Arabia - Market size and forecast 2024-2029 ($ million)
- Data Table on Saudi Arabia - Market size and forecast 2024-2029 ($ million)
- Chart on Saudi Arabia - Year-over-year growth 2024-2029 (%)
- Data Table on Saudi Arabia - Year-over-year growth 2024-2029 (%)
- 11.17 Brazil - Market size and forecast 2024-2029
- Chart on Brazil - Market size and forecast 2024-2029 ($ million)
- Data Table on Brazil - Market size and forecast 2024-2029 ($ million)
- Chart on Brazil - Year-over-year growth 2024-2029 (%)
- Data Table on Brazil - Year-over-year growth 2024-2029 (%)
- 11.18 Market opportunity By Geographical Landscape
- Market opportunity By Geographical Landscape ($ million)
- Data Tables on Market opportunity By Geographical Landscape ($ million)
12 Drivers, Challenges, and Opportunity/Restraints
- 12.1 Market drivers
- 12.2 Market challenges
- 12.3 Impact of drivers and challenges
- Impact of drivers and challenges in 2024 and 2029
- 12.4 Market opportunities/restraints
13 Competitive Landscape
- 13.1 Overview
- 13.2 Competitive Landscape
- Overview on criticality of inputs and factors of differentiation
- 13.3 Landscape disruption
- Overview on factors of disruption
- 13.4 Industry risks
- Impact of key risks on business
14 Competitive Analysis
- 14.1 Companies profiled
- Companies covered
- 14.2 Company ranking index
- Company ranking index
- 14.3 Market positioning of companies
- Matrix on companies position and classification
- 14.4 aquatherm GmbH
- aquatherm GmbH - Overview
- aquatherm GmbH - Product / Service
- aquatherm GmbH - Key offerings
- SWOT
- 14.5 BRUGG Rohrsystem AG
- BRUGG Rohrsystem AG - Overview
- BRUGG Rohrsystem AG - Product / Service
- BRUGG Rohrsystem AG - Key offerings
- SWOT
- 14.6 Georg Fischer Ltd.
- Georg Fischer Ltd. - Overview
- Georg Fischer Ltd. - Business segments
- Georg Fischer Ltd. - Key offerings
- Georg Fischer Ltd. - Segment focus
- SWOT
- 14.7 Hennecke GmbH
- Hennecke GmbH - Overview
- Hennecke GmbH - Product / Service
- Hennecke GmbH - Key offerings
- SWOT
- 14.8 Insul Pipe Systems
- Insul Pipe Systems - Overview
- Insul Pipe Systems - Product / Service
- Insul Pipe Systems - Key offerings
- SWOT
- 14.9 KC Polymers Pvt. Ltd.
- KC Polymers Pvt. Ltd. - Overview
- KC Polymers Pvt. Ltd. - Product / Service
- KC Polymers Pvt. Ltd. - Key offerings
- SWOT
- 14.10 LOGSTOR Denmark Holding ApS
- LOGSTOR Denmark Holding ApS - Overview
- LOGSTOR Denmark Holding ApS - Product / Service
- LOGSTOR Denmark Holding ApS - Key offerings
- SWOT
- 14.11 PEM Korea Co. Ltd.
- PEM Korea Co. Ltd. - Overview
- PEM Korea Co. Ltd. - Product / Service
- PEM Korea Co. Ltd. - Key offerings
- SWOT
- 14.12 Perma Pipe International Holdings Inc.
- Perma Pipe International Holdings Inc. - Overview
- Perma Pipe International Holdings Inc. - Product / Service
- Perma Pipe International Holdings Inc. - Key offerings
- SWOT
- 14.13 Polypipe Ltd
- Polypipe Ltd - Overview
- Polypipe Ltd - Product / Service
- Polypipe Ltd - Key offerings
- SWOT
- 14.14 Rovanco Piping Systems Inc.
- Rovanco Piping Systems Inc. - Overview
- Rovanco Piping Systems Inc. - Product / Service
- Rovanco Piping Systems Inc. - Key offerings
- SWOT
- 14.15 Thermaflex
- Thermaflex - Overview
- Thermaflex - Product / Service
- Thermaflex - Key offerings
- SWOT
- 14.16 Uponor Corp.
- Uponor Corp. - Overview
- Uponor Corp. - Business segments
- Uponor Corp. - Key offerings
- Uponor Corp. - Segment focus
- SWOT
- 14.17 Watts Water Technologies Inc.
- Watts Water Technologies Inc. - Overview
- Watts Water Technologies Inc. - Product / Service
- Watts Water Technologies Inc. - Key offerings
- SWOT
- 14.18 ZECO AIRCON Ltd.
- ZECO AIRCON Ltd. - Overview
- ZECO AIRCON Ltd. - Product / Service
- ZECO AIRCON Ltd. - Key offerings
- SWOT
15 Appendix
- 15.1 Scope of the report
- 15.2 Inclusions and exclusions checklist
- Inclusions checklist
- Exclusions checklist
- 15.3 Currency conversion rates for US$
- Currency conversion rates for US$
- 15.4 Research methodology
- Research methodology
- 15.5 Data procurement
- Information sources
- 15.6 Data validation
- Data validation
- 15.7 Validation techniques employed for market sizing
- Validation techniques employed for market sizing
- 15.8 Data synthesis
- Data synthesis
- 15.9 360 degree market analysis
- 360 degree market analysis
- 15.10 List of abbreviations
- List of abbreviations

