|
|
市場調査レポート
商品コード
1692988
自律走行バスの世界市場 2025~2029年Global Autonomous Bus Market 2025-2029 |
||||||

|
|||||||
カスタマイズ可能
|
|||||||


| 自律走行バスの世界市場 2025~2029年 |
|
出版日: 2025年03月21日
発行: TechNavio
ページ情報: 英文 222 Pages
納期: 即納可能
|

全表示
- 概要
- 図表
- 目次
自律走行バス市場は2024-2029年に28億7,700万米ドル、予測期間中のCAGRは22.4%で成長すると予測されます。
当レポートでは、自律走行バス市場の全体的な分析、市場規模・予測、動向、成長促進要因、課題、約25のベンダーを網羅したベンダー分析などを掲載しています。
現在の市場シナリオ、最新動向と促進要因、市場環境全体に関する最新分析を提供しています。市場は、自律走行車コリドーの開発拡大、自律走行モビリティへの投資拡大、自律走行車開発を支援する有利なガイドラインや政策によって牽引されています。
| 市場範囲 | |
|---|---|
| 基準年 | 2025 |
| 終了年 | 2029 |
| 予測期間 | 2025-2029 |
| 成長モメンタム | 加速 |
| 前年比2025年 | 21.4% |
| CAGR | 22.4% |
| 増分額 | 28億7,700万米ドル |
本調査は、業界の主要参加者からのインプットを含め、一次情報と二次情報を客観的に組み合わせて実施しました。レポートには、主要企業の分析に加え、包括的な市場規模データ、地域別分析によるセグメント、ベンダー情勢が含まれています。レポートには過去データと予測データがあります。
本調査では、今後数年間の自律走行バス市場の成長を促進する主な理由の1つとして、新しい自律走行バスの発売増加を挙げています。また、自律走行車のためのVehicle-to-Cloud OTAソリューションの出現と、シャトルとしての自律走行車の配備の増加は、市場の大きな需要につながります。
目次
第1章 エグゼクティブサマリー
- 市場概要
第2章 Technavio分析
- 価格・ライフサイクル・顧客購入バスケット・採用率・購入基準の分析
- インプットの重要性と差別化の要因
- 混乱の要因
- 促進要因と課題の影響
第3章 市場情勢
- 市場エコシステム
- 市場の特徴
- バリューチェーン分析
第4章 市場規模
- 市場の定義
- 市場セグメント分析
- 市場規模 2024
- 市場の見通し 2024-2029
第5章 市場規模実績
- 自律走行バスの世界市場 2019-2023
- タイプ別セグメント分析 2019-2023
- 推進力別セグメント分析 2019-2023
- エンドユーザー別セグメント分析 2019-2023
- 地域別セグメント分析 2019-2023
- 国別セグメント分析 2019-2023
第6章 定性分析
- AIの影響:自律走行バスの世界市場
第7章 ファイブフォース分析
- ファイブフォースの要約
- 買い手の交渉力
- 供給企業の交渉力
- 新規参入業者の脅威
- 代替品の脅威
- 競争の脅威
- 市況
第8章 市場セグメンテーション:タイプ別
- 市場セグメント
- 比較:タイプ別
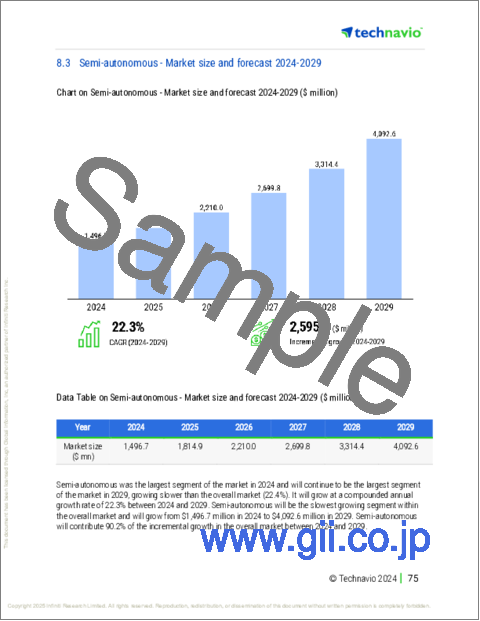
- 半自律型:市場規模と予測 2024-2029
- 完全自律型:市場規模と予測 2024-2029
- 市場機会:タイプ別
第9章 市場セグメンテーション:推進力別
- 市場セグメント
- 比較:推進力別
- ディーゼル:市場規模と予測 2024-2029
- 電気:市場規模と予測 2024-2029
- ハイブリッド:市場規模と予測 2024-2029
- 市場機会:推進力別
第10章 市場セグメンテーション:エンドユーザー別
- 市場セグメント
- 比較:エンドユーザー別
- 公共交通機関:市場規模と予測 2024-2029
- プライベートシャトルサービス:市場規模と予測 2024-2029
- 物流および貨物輸送:市場規模と予測 2024-2029
- 市場機会:エンドユーザー別
第11章 顧客情勢
- 顧客情勢の概要
第12章 地域別情勢
- 地域別セグメンテーション
- 地域別比較
- 北米:市場規模と予測 2024-2029
- アジア太平洋:市場規模と予測 2024-2029
- 欧州:市場規模と予測 2024-2029
- 中東・アフリカ:市場規模と予測 2024-2029
- 南米:市場規模と予測 2024-2029
- 米国:市場規模と予測 2024-2029
- カナダ:市場規模と予測 2024-2029
- 中国:市場規模と予測 2024-2029
- 日本:市場規模と予測 2024-2029
- インド:市場規模と予測 2024-2029
- ドイツ:市場規模と予測 2024-2029
- 英国:市場規模と予測 2024-2029
- 韓国:市場規模と予測 2024-2029
- フランス:市場規模と予測 2024-2029
- イタリア:市場規模と予測 2024-2029
- 市場機会:地域情勢別
第13章 促進要因・課題・機会・抑制要因
- 市場促進要因
- 市場の課題
- 促進要因と課題の影響
- 市場の機会・抑制要因
第14章 競合情勢
- 概要
- 競合情勢
- 混乱の状況
- 業界のリスク
第15章 競合分析
- 企業プロファイル
- 企業ランキング指数
- 企業の市場ポジショニング
- AB Volvo
- Aurrigo International plc
- Baidu Apollo Network Beijing Limited
- Continental AG
- DeepBlue Technology Shanghai Co. Ltd.
- Easymile SAS
- Mercedes Benz Group AG
- Navya SA
- Proterra Inc.
- Robert Bosch GmbH
- Toyota Motor Corp.
- Transdev Group SA
- Xiamen King Long United Automotive Industry Co. Ltd.
- Yutong Bus Co. Ltd.
- ZF Friedrichshafen AG
第16章 付録
Exhibits:
- Exhibits1: Executive Summary - Chart on Market Overview
- Exhibits2: Executive Summary - Data Table on Market Overview
- Exhibits3: Executive Summary - Chart on Global Market Characteristics
- Exhibits4: Executive Summary - Chart on Market By Geographical Landscape
- Exhibits5: Executive Summary - Chart on Market Segmentation by Type
- Exhibits6: Executive Summary - Chart on Market Segmentation by Propulsion
- Exhibits7: Executive Summary - Chart on Market Segmentation by End-user
- Exhibits8: Executive Summary - Chart on Incremental Growth
- Exhibits9: Executive Summary - Data Table on Incremental Growth
- Exhibits10: Executive Summary - Chart on Company Market Positioning
- Exhibits11: Analysis of price sensitivity, lifecycle, customer purchase basket, adoption rates, and purchase criteria
- Exhibits12: Overview on criticality of inputs and factors of differentiation
- Exhibits13: Overview on factors of disruption
- Exhibits14: Impact of drivers and challenges in 2024 and 2029
- Exhibits15: Parent Market
- Exhibits16: Data Table on - Parent Market
- Exhibits17: Market characteristics analysis
- Exhibits18: Value chain analysis
- Exhibits19: Offerings of companies included in the market definition
- Exhibits20: Market segments
- Exhibits21: Chart on Global - Market size and forecast 2024-2029 ($ million)
- Exhibits22: Data Table on Global - Market size and forecast 2024-2029 ($ million)
- Exhibits23: Chart on Global Market: Year-over-year growth 2024-2029 (%)
- Exhibits24: Data Table on Global Market: Year-over-year growth 2024-2029 (%)
- Exhibits25: Historic Market Size - Data Table on Global Autonomous Bus Market 2019 - 2023 ($ million)
- Exhibits26: Historic Market Size - Type Segment 2019 - 2023 ($ million)
- Exhibits27: Historic Market Size - Propulsion Segment 2019 - 2023 ($ million)
- Exhibits28: Historic Market Size - End-user Segment 2019 - 2023 ($ million)
- Exhibits29: Historic Market Size - Geography Segment 2019 - 2023 ($ million)
- Exhibits30: Historic Market Size - Country Segment 2019 - 2023 ($ million)
- Exhibits31: Five forces analysis - Comparison between 2024 and 2029
- Exhibits32: Bargaining power of buyers - Impact of key factors 2024 and 2029
- Exhibits33: Bargaining power of suppliers - Impact of key factors in 2024 and 2029
- Exhibits34: Threat of new entrants - Impact of key factors in 2024 and 2029
- Exhibits35: Threat of substitutes - Impact of key factors in 2024 and 2029
- Exhibits36: Threat of rivalry - Impact of key factors in 2024 and 2029
- Exhibits37: Chart on Market condition - Five forces 2024 and 2029
- Exhibits38: Chart on Type - Market share 2024-2029 (%)
- Exhibits39: Data Table on Type - Market share 2024-2029 (%)
- Exhibits40: Chart on Comparison by Type
- Exhibits41: Data Table on Comparison by Type
- Exhibits42: Chart on Semi-autonomous - Market size and forecast 2024-2029 ($ million)
- Exhibits43: Data Table on Semi-autonomous - Market size and forecast 2024-2029 ($ million)
- Exhibits44: Chart on Semi-autonomous - Year-over-year growth 2024-2029 (%)
- Exhibits45: Data Table on Semi-autonomous - Year-over-year growth 2024-2029 (%)
- Exhibits46: Chart on Fully-autonomous - Market size and forecast 2024-2029 ($ million)
- Exhibits47: Data Table on Fully-autonomous - Market size and forecast 2024-2029 ($ million)
- Exhibits48: Chart on Fully-autonomous - Year-over-year growth 2024-2029 (%)
- Exhibits49: Data Table on Fully-autonomous - Year-over-year growth 2024-2029 (%)
- Exhibits50: Market opportunity by Type ($ million)
- Exhibits51: Data Table on Market opportunity by Type ($ million)
- Exhibits52: Chart on Propulsion - Market share 2024-2029 (%)
- Exhibits53: Data Table on Propulsion - Market share 2024-2029 (%)
- Exhibits54: Chart on Comparison by Propulsion
- Exhibits55: Data Table on Comparison by Propulsion
- Exhibits56: Chart on Diesel - Market size and forecast 2024-2029 ($ million)
- Exhibits57: Data Table on Diesel - Market size and forecast 2024-2029 ($ million)
- Exhibits58: Chart on Diesel - Year-over-year growth 2024-2029 (%)
- Exhibits59: Data Table on Diesel - Year-over-year growth 2024-2029 (%)
- Exhibits60: Chart on Electric - Market size and forecast 2024-2029 ($ million)
- Exhibits61: Data Table on Electric - Market size and forecast 2024-2029 ($ million)
- Exhibits62: Chart on Electric - Year-over-year growth 2024-2029 (%)
- Exhibits63: Data Table on Electric - Year-over-year growth 2024-2029 (%)
- Exhibits64: Chart on Hybrid - Market size and forecast 2024-2029 ($ million)
- Exhibits65: Data Table on Hybrid - Market size and forecast 2024-2029 ($ million)
- Exhibits66: Chart on Hybrid - Year-over-year growth 2024-2029 (%)
- Exhibits67: Data Table on Hybrid - Year-over-year growth 2024-2029 (%)
- Exhibits68: Market opportunity by Propulsion ($ million)
- Exhibits69: Data Table on Market opportunity by Propulsion ($ million)
- Exhibits70: Chart on End-user - Market share 2024-2029 (%)
- Exhibits71: Data Table on End-user - Market share 2024-2029 (%)
- Exhibits72: Chart on Comparison by End-user
- Exhibits73: Data Table on Comparison by End-user
- Exhibits74: Chart on Public transportation - Market size and forecast 2024-2029 ($ million)
- Exhibits75: Data Table on Public transportation - Market size and forecast 2024-2029 ($ million)
- Exhibits76: Chart on Public transportation - Year-over-year growth 2024-2029 (%)
- Exhibits77: Data Table on Public transportation - Year-over-year growth 2024-2029 (%)
- Exhibits78: Chart on Private shuttle services - Market size and forecast 2024-2029 ($ million)
- Exhibits79: Data Table on Private shuttle services - Market size and forecast 2024-2029 ($ million)
- Exhibits80: Chart on Private shuttle services - Year-over-year growth 2024-2029 (%)
- Exhibits81: Data Table on Private shuttle services - Year-over-year growth 2024-2029 (%)
- Exhibits82: Chart on Logistics and goods transport - Market size and forecast 2024-2029 ($ million)
- Exhibits83: Data Table on Logistics and goods transport - Market size and forecast 2024-2029 ($ million)
- Exhibits84: Chart on Logistics and goods transport - Year-over-year growth 2024-2029 (%)
- Exhibits85: Data Table on Logistics and goods transport - Year-over-year growth 2024-2029 (%)
- Exhibits86: Market opportunity by End-user ($ million)
- Exhibits87: Data Table on Market opportunity by End-user ($ million)
- Exhibits88: Analysis of price sensitivity, lifecycle, customer purchase basket, adoption rates, and purchase criteria
- Exhibits89: Chart on Market share By Geographical Landscape 2024-2029 (%)
- Exhibits90: Data Table on Market share By Geographical Landscape 2024-2029 (%)
- Exhibits91: Chart on Geographic comparison
- Exhibits92: Data Table on Geographic comparison
- Exhibits93: Chart on North America - Market size and forecast 2024-2029 ($ million)
- Exhibits94: Data Table on North America - Market size and forecast 2024-2029 ($ million)
- Exhibits95: Chart on North America - Year-over-year growth 2024-2029 (%)
- Exhibits96: Data Table on North America - Year-over-year growth 2024-2029 (%)
- Exhibits97: Chart on APAC - Market size and forecast 2024-2029 ($ million)
- Exhibits98: Data Table on APAC - Market size and forecast 2024-2029 ($ million)
- Exhibits99: Chart on APAC - Year-over-year growth 2024-2029 (%)
- Exhibits100: Data Table on APAC - Year-over-year growth 2024-2029 (%)
- Exhibits101: Chart on Europe - Market size and forecast 2024-2029 ($ million)
- Exhibits102: Data Table on Europe - Market size and forecast 2024-2029 ($ million)
- Exhibits103: Chart on Europe - Year-over-year growth 2024-2029 (%)
- Exhibits104: Data Table on Europe - Year-over-year growth 2024-2029 (%)
- Exhibits105: Chart on Middle East and Africa - Market size and forecast 2024-2029 ($ million)
- Exhibits106: Data Table on Middle East and Africa - Market size and forecast 2024-2029 ($ million)
- Exhibits107: Chart on Middle East and Africa - Year-over-year growth 2024-2029 (%)
- Exhibits108: Data Table on Middle East and Africa - Year-over-year growth 2024-2029 (%)
- Exhibits109: Chart on South America - Market size and forecast 2024-2029 ($ million)
- Exhibits110: Data Table on South America - Market size and forecast 2024-2029 ($ million)
- Exhibits111: Chart on South America - Year-over-year growth 2024-2029 (%)
- Exhibits112: Data Table on South America - Year-over-year growth 2024-2029 (%)
- Exhibits113: Chart on US - Market size and forecast 2024-2029 ($ million)
- Exhibits114: Data Table on US - Market size and forecast 2024-2029 ($ million)
- Exhibits115: Chart on US - Year-over-year growth 2024-2029 (%)
- Exhibits116: Data Table on US - Year-over-year growth 2024-2029 (%)
- Exhibits117: Chart on Canada - Market size and forecast 2024-2029 ($ million)
- Exhibits118: Data Table on Canada - Market size and forecast 2024-2029 ($ million)
- Exhibits119: Chart on Canada - Year-over-year growth 2024-2029 (%)
- Exhibits120: Data Table on Canada - Year-over-year growth 2024-2029 (%)
- Exhibits121: Chart on China - Market size and forecast 2024-2029 ($ million)
- Exhibits122: Data Table on China - Market size and forecast 2024-2029 ($ million)
- Exhibits123: Chart on China - Year-over-year growth 2024-2029 (%)
- Exhibits124: Data Table on China - Year-over-year growth 2024-2029 (%)
- Exhibits125: Chart on Japan - Market size and forecast 2024-2029 ($ million)
- Exhibits126: Data Table on Japan - Market size and forecast 2024-2029 ($ million)
- Exhibits127: Chart on Japan - Year-over-year growth 2024-2029 (%)
- Exhibits128: Data Table on Japan - Year-over-year growth 2024-2029 (%)
- Exhibits129: Chart on India - Market size and forecast 2024-2029 ($ million)
- Exhibits130: Data Table on India - Market size and forecast 2024-2029 ($ million)
- Exhibits131: Chart on India - Year-over-year growth 2024-2029 (%)
- Exhibits132: Data Table on India - Year-over-year growth 2024-2029 (%)
- Exhibits133: Chart on Germany - Market size and forecast 2024-2029 ($ million)
- Exhibits134: Data Table on Germany - Market size and forecast 2024-2029 ($ million)
- Exhibits135: Chart on Germany - Year-over-year growth 2024-2029 (%)
- Exhibits136: Data Table on Germany - Year-over-year growth 2024-2029 (%)
- Exhibits137: Chart on UK - Market size and forecast 2024-2029 ($ million)
- Exhibits138: Data Table on UK - Market size and forecast 2024-2029 ($ million)
- Exhibits139: Chart on UK - Year-over-year growth 2024-2029 (%)
- Exhibits140: Data Table on UK - Year-over-year growth 2024-2029 (%)
- Exhibits141: Chart on South Korea - Market size and forecast 2024-2029 ($ million)
- Exhibits142: Data Table on South Korea - Market size and forecast 2024-2029 ($ million)
- Exhibits143: Chart on South Korea - Year-over-year growth 2024-2029 (%)
- Exhibits144: Data Table on South Korea - Year-over-year growth 2024-2029 (%)
- Exhibits145: Chart on France - Market size and forecast 2024-2029 ($ million)
- Exhibits146: Data Table on France - Market size and forecast 2024-2029 ($ million)
- Exhibits147: Chart on France - Year-over-year growth 2024-2029 (%)
- Exhibits148: Data Table on France - Year-over-year growth 2024-2029 (%)
- Exhibits149: Chart on Italy - Market size and forecast 2024-2029 ($ million)
- Exhibits150: Data Table on Italy - Market size and forecast 2024-2029 ($ million)
- Exhibits151: Chart on Italy - Year-over-year growth 2024-2029 (%)
- Exhibits152: Data Table on Italy - Year-over-year growth 2024-2029 (%)
- Exhibits153: Market opportunity By Geographical Landscape ($ million)
- Exhibits154: Data Tables on Market opportunity By Geographical Landscape ($ million)
- Exhibits155: Impact of drivers and challenges in 2024 and 2029
- Exhibits156: Overview on criticality of inputs and factors of differentiation
- Exhibits157: Overview on factors of disruption
- Exhibits158: Impact of key risks on business
- Exhibits159: Companies covered
- Exhibits160: Company ranking index
- Exhibits161: Matrix on companies position and classification
- Exhibits162: AB Volvo - Overview
- Exhibits163: AB Volvo - Business segments
- Exhibits164: AB Volvo - Key news
- Exhibits165: AB Volvo - Key offerings
- Exhibits166: AB Volvo - Segment focus
- Exhibits167: SWOT
- Exhibits168: Aurrigo International plc - Overview
- Exhibits169: Aurrigo International plc - Product / Service
- Exhibits170: Aurrigo International plc - Key offerings
- Exhibits171: SWOT
- Exhibits172: Baidu Apollo Network Beijing Limited - Overview
- Exhibits173: Baidu Apollo Network Beijing Limited - Product / Service
- Exhibits174: Baidu Apollo Network Beijing Limited - Key offerings
- Exhibits175: SWOT
- Exhibits176: Continental AG - Overview
- Exhibits177: Continental AG - Business segments
- Exhibits178: Continental AG - Key news
- Exhibits179: Continental AG - Key offerings
- Exhibits180: Continental AG - Segment focus
- Exhibits181: SWOT
- Exhibits182: DeepBlue Technology Shanghai Co. Ltd. - Overview
- Exhibits183: DeepBlue Technology Shanghai Co. Ltd. - Product / Service
- Exhibits184: DeepBlue Technology Shanghai Co. Ltd. - Key offerings
- Exhibits185: SWOT
- Exhibits186: Easymile SAS - Overview
- Exhibits187: Easymile SAS - Product / Service
- Exhibits188: Easymile SAS - Key offerings
- Exhibits189: SWOT
- Exhibits190: Mercedes Benz Group AG - Overview
- Exhibits191: Mercedes Benz Group AG - Product / Service
- Exhibits192: Mercedes Benz Group AG - Key offerings
- Exhibits193: SWOT
- Exhibits194: Navya SA - Overview
- Exhibits195: Navya SA - Product / Service
- Exhibits196: Navya SA - Key offerings
- Exhibits197: SWOT
- Exhibits198: Proterra Inc. - Overview
- Exhibits199: Proterra Inc. - Product / Service
- Exhibits200: Proterra Inc. - Key offerings
- Exhibits201: SWOT
- Exhibits202: Robert Bosch GmbH - Overview
- Exhibits203: Robert Bosch GmbH - Product / Service
- Exhibits204: Robert Bosch GmbH - Key news
- Exhibits205: Robert Bosch GmbH - Key offerings
- Exhibits206: SWOT
- Exhibits207: Toyota Motor Corp. - Overview
- Exhibits208: Toyota Motor Corp. - Business segments
- Exhibits209: Toyota Motor Corp. - Key news
- Exhibits210: Toyota Motor Corp. - Key offerings
- Exhibits211: Toyota Motor Corp. - Segment focus
- Exhibits212: SWOT
- Exhibits213: Transdev Group SA - Overview
- Exhibits214: Transdev Group SA - Product / Service
- Exhibits215: Transdev Group SA - Key offerings
- Exhibits216: SWOT
- Exhibits217: Xiamen King Long United Automotive Industry Co. Ltd. - Overview
- Exhibits218: Xiamen King Long United Automotive Industry Co. Ltd. - Product / Service
- Exhibits219: Xiamen King Long United Automotive Industry Co. Ltd. - Key offerings
- Exhibits220: SWOT
- Exhibits221: Yutong Bus Co. Ltd. - Overview
- Exhibits222: Yutong Bus Co. Ltd. - Product / Service
- Exhibits223: Yutong Bus Co. Ltd. - Key offerings
- Exhibits224: SWOT
- Exhibits225: ZF Friedrichshafen AG - Overview
- Exhibits226: ZF Friedrichshafen AG - Business segments
- Exhibits227: ZF Friedrichshafen AG - Key news
- Exhibits228: ZF Friedrichshafen AG - Key offerings
- Exhibits229: ZF Friedrichshafen AG - Segment focus
- Exhibits230: SWOT
- Exhibits231: Inclusions checklist
- Exhibits232: Exclusions checklist
- Exhibits233: Currency conversion rates for US$
- Exhibits234: Research methodology
- Exhibits235: Information sources
- Exhibits236: Data validation
- Exhibits237: Validation techniques employed for market sizing
- Exhibits238: Data synthesis
- Exhibits239: 360 degree market analysis
- Exhibits240: List of abbreviations
The autonomous bus market is forecasted to grow by USD 2877 million during 2024-2029, accelerating at a CAGR of 22.4% during the forecast period. The report on the autonomous bus market provides a holistic analysis, market size and forecast, trends, growth drivers, and challenges, as well as vendor analysis covering around 25 vendors.
The report offers an up-to-date analysis regarding the current market scenario, the latest trends and drivers, and the overall market environment. The market is driven by growing developments in autonomous vehicle corridors, growing investments in autonomous mobility, and favorable guidelines and policies supporting autonomous vehicle development.
| Market Scope | |
|---|---|
| Base Year | 2025 |
| End Year | 2029 |
| Series Year | 2025-2029 |
| Growth Momentum | Accelerate |
| YOY 2025 | 21.4% |
| CAGR | 22.4% |
| Incremental Value | $2877 mn |
The study was conducted using an objective combination of primary and secondary information including inputs from key participants in the industry. The report contains a comprehensive market size data, segment with regional analysis and vendor landscape in addition to an analysis of the key companies. Reports have historic and forecast data.
Technavio's autonomous bus market is segmented as below:
By Type
- Semi-autonomous
- Fully-autonomous
By Propulsion
- Diesel
- Electric
- Hybrid
By End-user
- Public transportation
- Private shuttle services
- Logistics and goods transport
By Geographical Landscape
- North America
- APAC
- Europe
- Middle East and Africa
- South America
This study identifies the increase in launch of new autonomous buses as one of the prime reasons driving the autonomous bus market growth during the next few years. Also, emergence of vehicle-to-cloud OTA solutions for autonomous vehicles and increase in deployment of autonomous vehicles as shuttles will lead to sizable demand in the market.
The report on the autonomous bus market covers the following areas:
- Autonomous Bus Market sizing
- Autonomous Bus Market forecast
- Autonomous Bus Market industry analysis
The robust vendor analysis is designed to help clients improve their market position, and in line with this, this report provides a detailed analysis of several leading autonomous bus market vendors that include AB Volvo, Aptiv PLC, Aurrigo International PLC, Baidu Apollo Network Beijing Limited, BYD Co. Ltd., Coast Autonomous Inc., Continental AG, DeepBlue Technology Shanghai Co. Ltd., Easymile SAS, Lilee Technology Inc., Mercedes Benz Group AG, Navya SA, NFI Group Inc., Proterra Inc., Robert Bosch GmbH, Toyota Motor Corp., Transdev Group SA, Xiamen King Long United Automotive Industry Co. Ltd., Yutong Bus Co. Ltd., and ZF Friedrichshafen AG. Also, the autonomous bus market analysis report includes information on upcoming trends and challenges that will influence market growth. This is to help companies strategize and leverage all forthcoming growth opportunities.
The publisher presents a detailed picture of the market by the way of study, synthesis, and summation of data from multiple sources by an analysis of key parameters such as profit, pricing, competition, and promotions. It presents various market facets by identifying the key industry influencers. The data presented is comprehensive, reliable, and a result of extensive primary and secondary research. The market research reports provide a complete competitive landscape and an in-depth vendor selection methodology and analysis using qualitative and quantitative research to forecast accurate market growth.
Table of Contents
1 Executive Summary
- 1.1 Market overview
- Executive Summary - Chart on Market Overview
- Executive Summary - Data Table on Market Overview
- Executive Summary - Chart on Global Market Characteristics
- Executive Summary - Chart on Market By Geographical Landscape
- Executive Summary - Chart on Market Segmentation by Type
- Executive Summary - Chart on Market Segmentation by Propulsion
- Executive Summary - Chart on Market Segmentation by End-user
- Executive Summary - Chart on Incremental Growth
- Executive Summary - Data Table on Incremental Growth
- Executive Summary - Chart on Company Market Positioning
2 Technavio Analysis
- 2.1 Analysis of price sensitivity, lifecycle, customer purchase basket, adoption rates, and purchase criteria
- Analysis of price sensitivity, lifecycle, customer purchase basket, adoption rates, and purchase criteria
- 2.2 Criticality of inputs and Factors of differentiation
- Overview on criticality of inputs and factors of differentiation
- 2.3 Factors of disruption
- Overview on factors of disruption
- 2.4 Impact of drivers and challenges
- Impact of drivers and challenges in 2024 and 2029
3 Market Landscape
- 3.1 Market ecosystem
- Parent Market
- Data Table on - Parent Market
- 3.2 Market characteristics
- Market characteristics analysis
- 3.3 Value chain analysis
- Value chain analysis
4 Market Sizing
- 4.1 Market definition
- Offerings of companies included in the market definition
- 4.2 Market segment analysis
- Market segments
- 4.3 Market size 2024
- 4.4 Market outlook: Forecast for 2024-2029
- Chart on Global - Market size and forecast 2024-2029 ($ million)
- Data Table on Global - Market size and forecast 2024-2029 ($ million)
- Chart on Global Market: Year-over-year growth 2024-2029 (%)
- Data Table on Global Market: Year-over-year growth 2024-2029 (%)
5 Historic Market Size
- 5.1 Global Autonomous Bus Market 2019 - 2023
- Historic Market Size - Data Table on Global Autonomous Bus Market 2019 - 2023 ($ million)
- 5.2 Type segment analysis 2019 - 2023
- Historic Market Size - Type Segment 2019 - 2023 ($ million)
- 5.3 Propulsion segment analysis 2019 - 2023
- Historic Market Size - Propulsion Segment 2019 - 2023 ($ million)
- 5.4 End-user segment analysis 2019 - 2023
- Historic Market Size - End-user Segment 2019 - 2023 ($ million)
- 5.5 Geography segment analysis 2019 - 2023
- Historic Market Size - Geography Segment 2019 - 2023 ($ million)
- 5.6 Country segment analysis 2019 - 2023
- Historic Market Size - Country Segment 2019 - 2023 ($ million)
6 Qualitative Analysis
- 6.1 AI Impact on Global Autonomous Bus Market
7 Five Forces Analysis
- 7.1 Five forces summary
- Five forces analysis - Comparison between 2024 and 2029
- 7.2 Bargaining power of buyers
- Bargaining power of buyers - Impact of key factors 2024 and 2029
- 7.3 Bargaining power of suppliers
- Bargaining power of suppliers - Impact of key factors in 2024 and 2029
- 7.4 Threat of new entrants
- Threat of new entrants - Impact of key factors in 2024 and 2029
- 7.5 Threat of substitutes
- Threat of substitutes - Impact of key factors in 2024 and 2029
- 7.6 Threat of rivalry
- Threat of rivalry - Impact of key factors in 2024 and 2029
- 7.7 Market condition
- Chart on Market condition - Five forces 2024 and 2029
8 Market Segmentation by Type
- 8.1 Market segments
- Chart on Type - Market share 2024-2029 (%)
- Data Table on Type - Market share 2024-2029 (%)
- 8.2 Comparison by Type
- Chart on Comparison by Type
- Data Table on Comparison by Type
- 8.3 Semi-autonomous - Market size and forecast 2024-2029
- Chart on Semi-autonomous - Market size and forecast 2024-2029 ($ million)
- Data Table on Semi-autonomous - Market size and forecast 2024-2029 ($ million)
- Chart on Semi-autonomous - Year-over-year growth 2024-2029 (%)
- Data Table on Semi-autonomous - Year-over-year growth 2024-2029 (%)
- 8.4 Fully-autonomous - Market size and forecast 2024-2029
- Chart on Fully-autonomous - Market size and forecast 2024-2029 ($ million)
- Data Table on Fully-autonomous - Market size and forecast 2024-2029 ($ million)
- Chart on Fully-autonomous - Year-over-year growth 2024-2029 (%)
- Data Table on Fully-autonomous - Year-over-year growth 2024-2029 (%)
- 8.5 Market opportunity by Type
- Market opportunity by Type ($ million)
- Data Table on Market opportunity by Type ($ million)
9 Market Segmentation by Propulsion
- 9.1 Market segments
- Chart on Propulsion - Market share 2024-2029 (%)
- Data Table on Propulsion - Market share 2024-2029 (%)
- 9.2 Comparison by Propulsion
- Chart on Comparison by Propulsion
- Data Table on Comparison by Propulsion
- 9.3 Diesel - Market size and forecast 2024-2029
- Chart on Diesel - Market size and forecast 2024-2029 ($ million)
- Data Table on Diesel - Market size and forecast 2024-2029 ($ million)
- Chart on Diesel - Year-over-year growth 2024-2029 (%)
- Data Table on Diesel - Year-over-year growth 2024-2029 (%)
- 9.4 Electric - Market size and forecast 2024-2029
- Chart on Electric - Market size and forecast 2024-2029 ($ million)
- Data Table on Electric - Market size and forecast 2024-2029 ($ million)
- Chart on Electric - Year-over-year growth 2024-2029 (%)
- Data Table on Electric - Year-over-year growth 2024-2029 (%)
- 9.5 Hybrid - Market size and forecast 2024-2029
- Chart on Hybrid - Market size and forecast 2024-2029 ($ million)
- Data Table on Hybrid - Market size and forecast 2024-2029 ($ million)
- Chart on Hybrid - Year-over-year growth 2024-2029 (%)
- Data Table on Hybrid - Year-over-year growth 2024-2029 (%)
- 9.6 Market opportunity by Propulsion
- Market opportunity by Propulsion ($ million)
- Data Table on Market opportunity by Propulsion ($ million)
10 Market Segmentation by End-user
- 10.1 Market segments
- Chart on End-user - Market share 2024-2029 (%)
- Data Table on End-user - Market share 2024-2029 (%)
- 10.2 Comparison by End-user
- Chart on Comparison by End-user
- Data Table on Comparison by End-user
- 10.3 Public transportation - Market size and forecast 2024-2029
- Chart on Public transportation - Market size and forecast 2024-2029 ($ million)
- Data Table on Public transportation - Market size and forecast 2024-2029 ($ million)
- Chart on Public transportation - Year-over-year growth 2024-2029 (%)
- Data Table on Public transportation - Year-over-year growth 2024-2029 (%)
- 10.4 Private shuttle services - Market size and forecast 2024-2029
- Chart on Private shuttle services - Market size and forecast 2024-2029 ($ million)
- Data Table on Private shuttle services - Market size and forecast 2024-2029 ($ million)
- Chart on Private shuttle services - Year-over-year growth 2024-2029 (%)
- Data Table on Private shuttle services - Year-over-year growth 2024-2029 (%)
- 10.5 Logistics and goods transport - Market size and forecast 2024-2029
- Chart on Logistics and goods transport - Market size and forecast 2024-2029 ($ million)
- Data Table on Logistics and goods transport - Market size and forecast 2024-2029 ($ million)
- Chart on Logistics and goods transport - Year-over-year growth 2024-2029 (%)
- Data Table on Logistics and goods transport - Year-over-year growth 2024-2029 (%)
- 10.6 Market opportunity by End-user
- Market opportunity by End-user ($ million)
- Data Table on Market opportunity by End-user ($ million)
11 Customer Landscape
- 11.1 Customer landscape overview
- Analysis of price sensitivity, lifecycle, customer purchase basket, adoption rates, and purchase criteria
12 Geographic Landscape
- 12.1 Geographic segmentation
- Chart on Market share By Geographical Landscape 2024-2029 (%)
- Data Table on Market share By Geographical Landscape 2024-2029 (%)
- 12.2 Geographic comparison
- Chart on Geographic comparison
- Data Table on Geographic comparison
- 12.3 North America - Market size and forecast 2024-2029
- Chart on North America - Market size and forecast 2024-2029 ($ million)
- Data Table on North America - Market size and forecast 2024-2029 ($ million)
- Chart on North America - Year-over-year growth 2024-2029 (%)
- Data Table on North America - Year-over-year growth 2024-2029 (%)
- 12.4 APAC - Market size and forecast 2024-2029
- Chart on APAC - Market size and forecast 2024-2029 ($ million)
- Data Table on APAC - Market size and forecast 2024-2029 ($ million)
- Chart on APAC - Year-over-year growth 2024-2029 (%)
- Data Table on APAC - Year-over-year growth 2024-2029 (%)
- 12.5 Europe - Market size and forecast 2024-2029
- Chart on Europe - Market size and forecast 2024-2029 ($ million)
- Data Table on Europe - Market size and forecast 2024-2029 ($ million)
- Chart on Europe - Year-over-year growth 2024-2029 (%)
- Data Table on Europe - Year-over-year growth 2024-2029 (%)
- 12.6 Middle East and Africa - Market size and forecast 2024-2029
- Chart on Middle East and Africa - Market size and forecast 2024-2029 ($ million)
- Data Table on Middle East and Africa - Market size and forecast 2024-2029 ($ million)
- Chart on Middle East and Africa - Year-over-year growth 2024-2029 (%)
- Data Table on Middle East and Africa - Year-over-year growth 2024-2029 (%)
- 12.7 South America - Market size and forecast 2024-2029
- Chart on South America - Market size and forecast 2024-2029 ($ million)
- Data Table on South America - Market size and forecast 2024-2029 ($ million)
- Chart on South America - Year-over-year growth 2024-2029 (%)
- Data Table on South America - Year-over-year growth 2024-2029 (%)
- 12.8 US - Market size and forecast 2024-2029
- Chart on US - Market size and forecast 2024-2029 ($ million)
- Data Table on US - Market size and forecast 2024-2029 ($ million)
- Chart on US - Year-over-year growth 2024-2029 (%)
- Data Table on US - Year-over-year growth 2024-2029 (%)
- 12.9 Canada - Market size and forecast 2024-2029
- Chart on Canada - Market size and forecast 2024-2029 ($ million)
- Data Table on Canada - Market size and forecast 2024-2029 ($ million)
- Chart on Canada - Year-over-year growth 2024-2029 (%)
- Data Table on Canada - Year-over-year growth 2024-2029 (%)
- 12.10 China - Market size and forecast 2024-2029
- Chart on China - Market size and forecast 2024-2029 ($ million)
- Data Table on China - Market size and forecast 2024-2029 ($ million)
- Chart on China - Year-over-year growth 2024-2029 (%)
- Data Table on China - Year-over-year growth 2024-2029 (%)
- 12.11 Japan - Market size and forecast 2024-2029
- Chart on Japan - Market size and forecast 2024-2029 ($ million)
- Data Table on Japan - Market size and forecast 2024-2029 ($ million)
- Chart on Japan - Year-over-year growth 2024-2029 (%)
- Data Table on Japan - Year-over-year growth 2024-2029 (%)
- 12.12 India - Market size and forecast 2024-2029
- Chart on India - Market size and forecast 2024-2029 ($ million)
- Data Table on India - Market size and forecast 2024-2029 ($ million)
- Chart on India - Year-over-year growth 2024-2029 (%)
- Data Table on India - Year-over-year growth 2024-2029 (%)
- 12.13 Germany - Market size and forecast 2024-2029
- Chart on Germany - Market size and forecast 2024-2029 ($ million)
- Data Table on Germany - Market size and forecast 2024-2029 ($ million)
- Chart on Germany - Year-over-year growth 2024-2029 (%)
- Data Table on Germany - Year-over-year growth 2024-2029 (%)
- 12.14 UK - Market size and forecast 2024-2029
- Chart on UK - Market size and forecast 2024-2029 ($ million)
- Data Table on UK - Market size and forecast 2024-2029 ($ million)
- Chart on UK - Year-over-year growth 2024-2029 (%)
- Data Table on UK - Year-over-year growth 2024-2029 (%)
- 12.15 South Korea - Market size and forecast 2024-2029
- Chart on South Korea - Market size and forecast 2024-2029 ($ million)
- Data Table on South Korea - Market size and forecast 2024-2029 ($ million)
- Chart on South Korea - Year-over-year growth 2024-2029 (%)
- Data Table on South Korea - Year-over-year growth 2024-2029 (%)
- 12.16 France - Market size and forecast 2024-2029
- Chart on France - Market size and forecast 2024-2029 ($ million)
- Data Table on France - Market size and forecast 2024-2029 ($ million)
- Chart on France - Year-over-year growth 2024-2029 (%)
- Data Table on France - Year-over-year growth 2024-2029 (%)
- 12.17 Italy - Market size and forecast 2024-2029
- Chart on Italy - Market size and forecast 2024-2029 ($ million)
- Data Table on Italy - Market size and forecast 2024-2029 ($ million)
- Chart on Italy - Year-over-year growth 2024-2029 (%)
- Data Table on Italy - Year-over-year growth 2024-2029 (%)
- 12.18 Market opportunity By Geographical Landscape
- Market opportunity By Geographical Landscape ($ million)
- Data Tables on Market opportunity By Geographical Landscape ($ million)
13 Drivers, Challenges, and Opportunity/Restraints
- 13.1 Market drivers
- 13.2 Market challenges
- 13.3 Impact of drivers and challenges
- Impact of drivers and challenges in 2024 and 2029
- 13.4 Market opportunities/restraints
14 Competitive Landscape
- 14.1 Overview
- 14.2 Competitive Landscape
- Overview on criticality of inputs and factors of differentiation
- 14.3 Landscape disruption
- Overview on factors of disruption
- 14.4 Industry risks
- Impact of key risks on business
15 Competitive Analysis
- 15.1 Companies profiled
- Companies covered
- 15.2 Company ranking index
- Company ranking index
- 15.3 Market positioning of companies
- Matrix on companies position and classification
- 15.4 AB Volvo
- AB Volvo - Overview
- AB Volvo - Business segments
- AB Volvo - Key news
- AB Volvo - Key offerings
- AB Volvo - Segment focus
- SWOT
- 15.5 Aurrigo International plc
- Aurrigo International plc - Overview
- Aurrigo International plc - Product / Service
- Aurrigo International plc - Key offerings
- SWOT
- 15.6 Baidu Apollo Network Beijing Limited
- Baidu Apollo Network Beijing Limited - Overview
- Baidu Apollo Network Beijing Limited - Product / Service
- Baidu Apollo Network Beijing Limited - Key offerings
- SWOT
- 15.7 Continental AG
- Continental AG - Overview
- Continental AG - Business segments
- Continental AG - Key news
- Continental AG - Key offerings
- Continental AG - Segment focus
- SWOT
- 15.8 DeepBlue Technology Shanghai Co. Ltd.
- DeepBlue Technology Shanghai Co. Ltd. - Overview
- DeepBlue Technology Shanghai Co. Ltd. - Product / Service
- DeepBlue Technology Shanghai Co. Ltd. - Key offerings
- SWOT
- 15.9 Easymile SAS
- Easymile SAS - Overview
- Easymile SAS - Product / Service
- Easymile SAS - Key offerings
- SWOT
- 15.10 Mercedes Benz Group AG
- Mercedes Benz Group AG - Overview
- Mercedes Benz Group AG - Product / Service
- Mercedes Benz Group AG - Key offerings
- SWOT
- 15.11 Navya SA
- Navya SA - Overview
- Navya SA - Product / Service
- Navya SA - Key offerings
- SWOT
- 15.12 Proterra Inc.
- Proterra Inc. - Overview
- Proterra Inc. - Product / Service
- Proterra Inc. - Key offerings
- SWOT
- 15.13 Robert Bosch GmbH
- Robert Bosch GmbH - Overview
- Robert Bosch GmbH - Product / Service
- Robert Bosch GmbH - Key news
- Robert Bosch GmbH - Key offerings
- SWOT
- 15.14 Toyota Motor Corp.
- Toyota Motor Corp. - Overview
- Toyota Motor Corp. - Business segments
- Toyota Motor Corp. - Key news
- Toyota Motor Corp. - Key offerings
- Toyota Motor Corp. - Segment focus
- SWOT
- 15.15 Transdev Group SA
- Transdev Group SA - Overview
- Transdev Group SA - Product / Service
- Transdev Group SA - Key offerings
- SWOT
- 15.16 Xiamen King Long United Automotive Industry Co. Ltd.
- Xiamen King Long United Automotive Industry Co. Ltd. - Overview
- Xiamen King Long United Automotive Industry Co. Ltd. - Product / Service
- Xiamen King Long United Automotive Industry Co. Ltd. - Key offerings
- SWOT
- 15.17 Yutong Bus Co. Ltd.
- Yutong Bus Co. Ltd. - Overview
- Yutong Bus Co. Ltd. - Product / Service
- Yutong Bus Co. Ltd. - Key offerings
- SWOT
- 15.18 ZF Friedrichshafen AG
- ZF Friedrichshafen AG - Overview
- ZF Friedrichshafen AG - Business segments
- ZF Friedrichshafen AG - Key news
- ZF Friedrichshafen AG - Key offerings
- ZF Friedrichshafen AG - Segment focus
- SWOT
16 Appendix
- 16.1 Scope of the report
- 16.2 Inclusions and exclusions checklist
- Inclusions checklist
- Exclusions checklist
- 16.3 Currency conversion rates for US$
- Currency conversion rates for US$
- 16.4 Research methodology
- Research methodology
- 16.5 Data procurement
- Information sources
- 16.6 Data validation
- Data validation
- 16.7 Validation techniques employed for market sizing
- Validation techniques employed for market sizing
- 16.8 Data synthesis
- Data synthesis
- 16.9 360 degree market analysis
- 360 degree market analysis
- 16.10 List of abbreviations
- List of abbreviations

