|
|
市場調査レポート
商品コード
1709633
シングルユース・バイオプロセシングシステムの世界市場 2025~2029年Global Single-use Bioprocessing System Market 2025-2029 |
||||||

|
|||||||
カスタマイズ可能
|
|||||||


| シングルユース・バイオプロセシングシステムの世界市場 2025~2029年 |
|
出版日: 2025年04月03日
発行: TechNavio
ページ情報: 英文 242 Pages
納期: 即納可能
|

全表示
- 概要
- 図表
- 目次
シングルユース・バイオプロセシングシステム市場は2024-2029年に189億9,040万米ドル、予測期間中のCAGRは20.2%で成長すると予測されます。
当レポートでは、シングルユース・バイオプロセシングシステム市場の全体的な分析、市場規模・予測、動向、成長促進要因、課題、約25のベンダーを網羅したベンダー分析などを掲載しています。
現在の市場シナリオ、最新動向と促進要因、市場環境全体に関する最新分析を提供しています。市場は、様々な疾患の治療に対するバイオ医薬品への高い需要、リアルタイムモニタリングと制御技術の統合、汚染リスクを最小化するためのシングルユース技術の使用の増加によって牽引されています。
| 市場範囲 | |
|---|---|
| 基準年 | 2025 |
| 終了年 | 2029 |
| 予測期間 | 2025-2029 |
| 成長モメンタム | 加速 |
| 前年比2025年 | 18% |
| CAGR | 20.2% |
| 増分額 | 189億9,040万米ドル |
本調査は、業界の主要参加者からのインプットを含め、一次情報と二次情報を客観的に組み合わせて実施しました。レポートには、主要企業の分析に加え、包括的な市場規模データ、地域別分析によるセグメント、ベンダー情勢が含まれています。レポートには過去データと予測データがあります。
本調査では、今後数年間のシングルユース・バイオプロセシングシステム市場の成長を促進する主な要因の1つとして、製品の進歩と自動化の拡大を挙げています。また、バイオ製造業者の間でモジュラー設備の採用が増加しており、バイオ医薬品製造における拡張性の必要性が市場の大きな需要につながります。
目次
第1章 エグゼクティブサマリー
- 市場概要
第2章 Technavio分析
- 価格・ライフサイクル・顧客購入バスケット・採用率・購入基準の分析
- インプットの重要性と差別化の要因
- 混乱の要因
- 促進要因と課題の影響
第3章 市場情勢
- 市場エコシステム
- 市場の特徴
- バリューチェーン分析
第4章 市場規模
- 市場の定義
- 市場セグメント分析
- 市場規模 2024
- 市場の見通し 2024-2029
第5章 市場規模実績
- シングルユース・バイオプロセシングシステムの世界市場 2019-2023
- 用途別セグメント分析 2019-2023
- 製品別セグメント分析 2019-2023
- エンドユーザー別セグメント分析 2019-2023
- 地域別セグメント分析 2019-2023
- 国別セグメント分析 2019-2023
第6章 定性分析
- AIの影響:シングルユース・バイオプロセシングシステムの世界市場
第7章 ファイブフォース分析
- ファイブフォースの要約
- 買い手の交渉力
- 供給企業の交渉力
- 新規参入業者の脅威
- 代替品の脅威
- 競争の脅威
- 市況
第8章 市場セグメンテーション:用途別
- 市場セグメント
- 比較:用途別
- mAb産生:市場規模と予測 2024-2029
- ワクチン製造:市場規模と予測 2024-2029
- 植物細胞培養:市場規模と予測 2024-2029
- PSCT:市場規模と予測 2024-2029
- その他:市場規模と予測 2024-2029
- 市場機会:用途別
第9章 市場セグメンテーション:製品別
- 市場セグメント
- 比較:製品別
- バッグとミキサー:市場規模と予測 2024-2029
- バイオリアクターと発酵槽:市場規模と予測 2024-2029
- ろ過装置およびサンプリングシステム:市場規模と予測 2024-2029
- バイオプロセスコンテナ:市場規模と予測 2024-2029
- その他:市場規模と予測 2024-2029
- 市場機会:製品別
第10章 市場セグメンテーション:エンドユーザー別
- 市場セグメント
- 比較:エンドユーザー別
- 製薬会社:市場規模と予測 2024-2029
- CROとCMO:市場規模と予測 2024-2029
- バイオテクノロジー企業:市場規模と予測 2024-2029
- 学術調査機関:市場規模と予測 2024-2029
- 市場機会:エンドユーザー別
第11章 顧客情勢
- 顧客情勢の概要
第12章 地域別情勢
- 地域別セグメンテーション
- 地域別比較
- 北米:市場規模と予測 2024-2029
- 欧州:市場規模と予測 2024-2029
- アジア:市場規模と予測 2024-2029
- 世界のその他の地域:市場規模と予測 2024-2029
- 米国:市場規模と予測 2024-2029
- ドイツ:市場規模と予測 2024-2029
- 中国:市場規模と予測 2024-2029
- 英国:市場規模と予測 2024-2029
- カナダ:市場規模と予測 2024-2029
- フランス:市場規模と予測 2024-2029
- 日本:市場規模と予測 2024-2029
- イタリア:市場規模と予測 2024-2029
- ブラジル:市場規模と予測 2024-2029
- インド:市場規模と予測 2024-2029
- 市場機会:地域情勢別
第13章 促進要因・課題・機会・抑制要因
- 市場促進要因
- 市場の課題
- 促進要因と課題の影響
- 市場の機会・抑制要因
第14章 競合情勢
- 概要
- 競合情勢
- 混乱の状況
- 業界のリスク
第15章 競合分析
- 企業プロファイル
- 企業ランキング指数
- 企業の市場ポジショニング
- ABEC Inc.
- Adolf Kuhner AG
- Advanced Microdevices Pvt. Ltd.
- Avantor Inc.
- Compagnie de Saint-Gobain SA
- Corning Inc.
- Cytiva
- Danaher Corp.
- Eppendorf SE
- Getinge AB
- Merck KGaA
- Sartorius AG
- Solaris Biotechnology Srl
- Thermo Fisher Scientific Inc.
第16章 付録
Exhibits:
- Exhibits1: Executive Summary - Chart on Market Overview
- Exhibits2: Executive Summary - Data Table on Market Overview
- Exhibits3: Executive Summary - Chart on Global Market Characteristics
- Exhibits4: Executive Summary - Chart on Market By Geographical Landscape
- Exhibits5: Executive Summary - Chart on Market Segmentation by Application
- Exhibits6: Executive Summary - Chart on Market Segmentation by Product
- Exhibits7: Executive Summary - Chart on Market Segmentation by End-user
- Exhibits8: Executive Summary - Chart on Incremental Growth
- Exhibits9: Executive Summary - Data Table on Incremental Growth
- Exhibits10: Executive Summary - Chart on Company Market Positioning
- Exhibits11: Analysis of price sensitivity, lifecycle, customer purchase basket, adoption rates, and purchase criteria
- Exhibits12: Overview on criticality of inputs and factors of differentiation
- Exhibits13: Overview on factors of disruption
- Exhibits14: Impact of drivers and challenges in 2024 and 2029
- Exhibits15: Parent Market
- Exhibits16: Data Table on - Parent Market
- Exhibits17: Market characteristics analysis
- Exhibits18: Value chain analysis
- Exhibits19: Offerings of companies included in the market definition
- Exhibits20: Market segments
- Exhibits21: Chart on Global - Market size and forecast 2024-2029 ($ million)
- Exhibits22: Data Table on Global - Market size and forecast 2024-2029 ($ million)
- Exhibits23: Chart on Global Market: Year-over-year growth 2024-2029 (%)
- Exhibits24: Data Table on Global Market: Year-over-year growth 2024-2029 (%)
- Exhibits25: Historic Market Size - Data Table on Global Single-Use Bioprocessing System Market 2019 - 2023 ($ million)
- Exhibits26: Historic Market Size - Application Segment 2019 - 2023 ($ million)
- Exhibits27: Historic Market Size - Product Segment 2019 - 2023 ($ million)
- Exhibits28: Historic Market Size - End-user Segment 2019 - 2023 ($ million)
- Exhibits29: Historic Market Size - Geography Segment 2019 - 2023 ($ million)
- Exhibits30: Historic Market Size - Country Segment 2019 - 2023 ($ million)
- Exhibits31: Five forces analysis - Comparison between 2024 and 2029
- Exhibits32: Bargaining power of buyers - Impact of key factors 2024 and 2029
- Exhibits33: Bargaining power of suppliers - Impact of key factors in 2024 and 2029
- Exhibits34: Threat of new entrants - Impact of key factors in 2024 and 2029
- Exhibits35: Threat of substitutes - Impact of key factors in 2024 and 2029
- Exhibits36: Threat of rivalry - Impact of key factors in 2024 and 2029
- Exhibits37: Chart on Market condition - Five forces 2024 and 2029
- Exhibits38: Chart on Application - Market share 2024-2029 (%)
- Exhibits39: Data Table on Application - Market share 2024-2029 (%)
- Exhibits40: Chart on Comparison by Application
- Exhibits41: Data Table on Comparison by Application
- Exhibits42: Chart on mAb production - Market size and forecast 2024-2029 ($ million)
- Exhibits43: Data Table on mAb production - Market size and forecast 2024-2029 ($ million)
- Exhibits44: Chart on mAb production - Year-over-year growth 2024-2029 (%)
- Exhibits45: Data Table on mAb production - Year-over-year growth 2024-2029 (%)
- Exhibits46: Chart on Vaccine production - Market size and forecast 2024-2029 ($ million)
- Exhibits47: Data Table on Vaccine production - Market size and forecast 2024-2029 ($ million)
- Exhibits48: Chart on Vaccine production - Year-over-year growth 2024-2029 (%)
- Exhibits49: Data Table on Vaccine production - Year-over-year growth 2024-2029 (%)
- Exhibits50: Chart on Plant cell cultivation - Market size and forecast 2024-2029 ($ million)
- Exhibits51: Data Table on Plant cell cultivation - Market size and forecast 2024-2029 ($ million)
- Exhibits52: Chart on Plant cell cultivation - Year-over-year growth 2024-2029 (%)
- Exhibits53: Data Table on Plant cell cultivation - Year-over-year growth 2024-2029 (%)
- Exhibits54: Chart on PSCTs - Market size and forecast 2024-2029 ($ million)
- Exhibits55: Data Table on PSCTs - Market size and forecast 2024-2029 ($ million)
- Exhibits56: Chart on PSCTs - Year-over-year growth 2024-2029 (%)
- Exhibits57: Data Table on PSCTs - Year-over-year growth 2024-2029 (%)
- Exhibits58: Chart on Others - Market size and forecast 2024-2029 ($ million)
- Exhibits59: Data Table on Others - Market size and forecast 2024-2029 ($ million)
- Exhibits60: Chart on Others - Year-over-year growth 2024-2029 (%)
- Exhibits61: Data Table on Others - Year-over-year growth 2024-2029 (%)
- Exhibits62: Market opportunity by Application ($ million)
- Exhibits63: Data Table on Market opportunity by Application ($ million)
- Exhibits64: Chart on Product - Market share 2024-2029 (%)
- Exhibits65: Data Table on Product - Market share 2024-2029 (%)
- Exhibits66: Chart on Comparison by Product
- Exhibits67: Data Table on Comparison by Product
- Exhibits68: Chart on Bags and mixers - Market size and forecast 2024-2029 ($ million)
- Exhibits69: Data Table on Bags and mixers - Market size and forecast 2024-2029 ($ million)
- Exhibits70: Chart on Bags and mixers - Year-over-year growth 2024-2029 (%)
- Exhibits71: Data Table on Bags and mixers - Year-over-year growth 2024-2029 (%)
- Exhibits72: Chart on Bioreactors and fermenters - Market size and forecast 2024-2029 ($ million)
- Exhibits73: Data Table on Bioreactors and fermenters - Market size and forecast 2024-2029 ($ million)
- Exhibits74: Chart on Bioreactors and fermenters - Year-over-year growth 2024-2029 (%)
- Exhibits75: Data Table on Bioreactors and fermenters - Year-over-year growth 2024-2029 (%)
- Exhibits76: Chart on Filtration devices and sampling systems - Market size and forecast 2024-2029 ($ million)
- Exhibits77: Data Table on Filtration devices and sampling systems - Market size and forecast 2024-2029 ($ million)
- Exhibits78: Chart on Filtration devices and sampling systems - Year-over-year growth 2024-2029 (%)
- Exhibits79: Data Table on Filtration devices and sampling systems - Year-over-year growth 2024-2029 (%)
- Exhibits80: Chart on Bioprocess containers - Market size and forecast 2024-2029 ($ million)
- Exhibits81: Data Table on Bioprocess containers - Market size and forecast 2024-2029 ($ million)
- Exhibits82: Chart on Bioprocess containers - Year-over-year growth 2024-2029 (%)
- Exhibits83: Data Table on Bioprocess containers - Year-over-year growth 2024-2029 (%)
- Exhibits84: Chart on Others - Market size and forecast 2024-2029 ($ million)
- Exhibits85: Data Table on Others - Market size and forecast 2024-2029 ($ million)
- Exhibits86: Chart on Others - Year-over-year growth 2024-2029 (%)
- Exhibits87: Data Table on Others - Year-over-year growth 2024-2029 (%)
- Exhibits88: Market opportunity by Product ($ million)
- Exhibits89: Data Table on Market opportunity by Product ($ million)
- Exhibits90: Chart on End-user - Market share 2024-2029 (%)
- Exhibits91: Data Table on End-user - Market share 2024-2029 (%)
- Exhibits92: Chart on Comparison by End-user
- Exhibits93: Data Table on Comparison by End-user
- Exhibits94: Chart on Pharmaceutical companies - Market size and forecast 2024-2029 ($ million)
- Exhibits95: Data Table on Pharmaceutical companies - Market size and forecast 2024-2029 ($ million)
- Exhibits96: Chart on Pharmaceutical companies - Year-over-year growth 2024-2029 (%)
- Exhibits97: Data Table on Pharmaceutical companies - Year-over-year growth 2024-2029 (%)
- Exhibits98: Chart on CROs and CMOs - Market size and forecast 2024-2029 ($ million)
- Exhibits99: Data Table on CROs and CMOs - Market size and forecast 2024-2029 ($ million)
- Exhibits100: Chart on CROs and CMOs - Year-over-year growth 2024-2029 (%)
- Exhibits101: Data Table on CROs and CMOs - Year-over-year growth 2024-2029 (%)
- Exhibits102: Chart on Biotechnology companies - Market size and forecast 2024-2029 ($ million)
- Exhibits103: Data Table on Biotechnology companies - Market size and forecast 2024-2029 ($ million)
- Exhibits104: Chart on Biotechnology companies - Year-over-year growth 2024-2029 (%)
- Exhibits105: Data Table on Biotechnology companies - Year-over-year growth 2024-2029 (%)
- Exhibits106: Chart on Academic and research institutions - Market size and forecast 2024-2029 ($ million)
- Exhibits107: Data Table on Academic and research institutions - Market size and forecast 2024-2029 ($ million)
- Exhibits108: Chart on Academic and research institutions - Year-over-year growth 2024-2029 (%)
- Exhibits109: Data Table on Academic and research institutions - Year-over-year growth 2024-2029 (%)
- Exhibits110: Market opportunity by End-user ($ million)
- Exhibits111: Data Table on Market opportunity by End-user ($ million)
- Exhibits112: Analysis of price sensitivity, lifecycle, customer purchase basket, adoption rates, and purchase criteria
- Exhibits113: Chart on Market share By Geographical Landscape 2024-2029 (%)
- Exhibits114: Data Table on Market share By Geographical Landscape 2024-2029 (%)
- Exhibits115: Chart on Geographic comparison
- Exhibits116: Data Table on Geographic comparison
- Exhibits117: Chart on North America - Market size and forecast 2024-2029 ($ million)
- Exhibits118: Data Table on North America - Market size and forecast 2024-2029 ($ million)
- Exhibits119: Chart on North America - Year-over-year growth 2024-2029 (%)
- Exhibits120: Data Table on North America - Year-over-year growth 2024-2029 (%)
- Exhibits121: Chart on Europe - Market size and forecast 2024-2029 ($ million)
- Exhibits122: Data Table on Europe - Market size and forecast 2024-2029 ($ million)
- Exhibits123: Chart on Europe - Year-over-year growth 2024-2029 (%)
- Exhibits124: Data Table on Europe - Year-over-year growth 2024-2029 (%)
- Exhibits125: Chart on Asia - Market size and forecast 2024-2029 ($ million)
- Exhibits126: Data Table on Asia - Market size and forecast 2024-2029 ($ million)
- Exhibits127: Chart on Asia - Year-over-year growth 2024-2029 (%)
- Exhibits128: Data Table on Asia - Year-over-year growth 2024-2029 (%)
- Exhibits129: Chart on Rest of World (ROW) - Market size and forecast 2024-2029 ($ million)
- Exhibits130: Data Table on Rest of World (ROW) - Market size and forecast 2024-2029 ($ million)
- Exhibits131: Chart on Rest of World (ROW) - Year-over-year growth 2024-2029 (%)
- Exhibits132: Data Table on Rest of World (ROW) - Year-over-year growth 2024-2029 (%)
- Exhibits133: Chart on US - Market size and forecast 2024-2029 ($ million)
- Exhibits134: Data Table on US - Market size and forecast 2024-2029 ($ million)
- Exhibits135: Chart on US - Year-over-year growth 2024-2029 (%)
- Exhibits136: Data Table on US - Year-over-year growth 2024-2029 (%)
- Exhibits137: Chart on Germany - Market size and forecast 2024-2029 ($ million)
- Exhibits138: Data Table on Germany - Market size and forecast 2024-2029 ($ million)
- Exhibits139: Chart on Germany - Year-over-year growth 2024-2029 (%)
- Exhibits140: Data Table on Germany - Year-over-year growth 2024-2029 (%)
- Exhibits141: Chart on China - Market size and forecast 2024-2029 ($ million)
- Exhibits142: Data Table on China - Market size and forecast 2024-2029 ($ million)
- Exhibits143: Chart on China - Year-over-year growth 2024-2029 (%)
- Exhibits144: Data Table on China - Year-over-year growth 2024-2029 (%)
- Exhibits145: Chart on UK - Market size and forecast 2024-2029 ($ million)
- Exhibits146: Data Table on UK - Market size and forecast 2024-2029 ($ million)
- Exhibits147: Chart on UK - Year-over-year growth 2024-2029 (%)
- Exhibits148: Data Table on UK - Year-over-year growth 2024-2029 (%)
- Exhibits149: Chart on Canada - Market size and forecast 2024-2029 ($ million)
- Exhibits150: Data Table on Canada - Market size and forecast 2024-2029 ($ million)
- Exhibits151: Chart on Canada - Year-over-year growth 2024-2029 (%)
- Exhibits152: Data Table on Canada - Year-over-year growth 2024-2029 (%)
- Exhibits153: Chart on France - Market size and forecast 2024-2029 ($ million)
- Exhibits154: Data Table on France - Market size and forecast 2024-2029 ($ million)
- Exhibits155: Chart on France - Year-over-year growth 2024-2029 (%)
- Exhibits156: Data Table on France - Year-over-year growth 2024-2029 (%)
- Exhibits157: Chart on Japan - Market size and forecast 2024-2029 ($ million)
- Exhibits158: Data Table on Japan - Market size and forecast 2024-2029 ($ million)
- Exhibits159: Chart on Japan - Year-over-year growth 2024-2029 (%)
- Exhibits160: Data Table on Japan - Year-over-year growth 2024-2029 (%)
- Exhibits161: Chart on Italy - Market size and forecast 2024-2029 ($ million)
- Exhibits162: Data Table on Italy - Market size and forecast 2024-2029 ($ million)
- Exhibits163: Chart on Italy - Year-over-year growth 2024-2029 (%)
- Exhibits164: Data Table on Italy - Year-over-year growth 2024-2029 (%)
- Exhibits165: Chart on Brazil - Market size and forecast 2024-2029 ($ million)
- Exhibits166: Data Table on Brazil - Market size and forecast 2024-2029 ($ million)
- Exhibits167: Chart on Brazil - Year-over-year growth 2024-2029 (%)
- Exhibits168: Data Table on Brazil - Year-over-year growth 2024-2029 (%)
- Exhibits169: Chart on India - Market size and forecast 2024-2029 ($ million)
- Exhibits170: Data Table on India - Market size and forecast 2024-2029 ($ million)
- Exhibits171: Chart on India - Year-over-year growth 2024-2029 (%)
- Exhibits172: Data Table on India - Year-over-year growth 2024-2029 (%)
- Exhibits173: Market opportunity By Geographical Landscape ($ million)
- Exhibits174: Data Tables on Market opportunity By Geographical Landscape ($ million)
- Exhibits175: Impact of drivers and challenges in 2024 and 2029
- Exhibits176: Overview on criticality of inputs and factors of differentiation
- Exhibits177: Overview on factors of disruption
- Exhibits178: Impact of key risks on business
- Exhibits179: Companies covered
- Exhibits180: Company ranking index
- Exhibits181: Matrix on companies position and classification
- Exhibits182: 3M Co. - Overview
- Exhibits183: 3M Co. - Business segments
- Exhibits184: 3M Co. - Key news
- Exhibits185: 3M Co. - Key offerings
- Exhibits186: 3M Co. - Segment focus
- Exhibits187: SWOT
- Exhibits188: ABEC Inc. - Overview
- Exhibits189: ABEC Inc. - Product / Service
- Exhibits190: ABEC Inc. - Key offerings
- Exhibits191: SWOT
- Exhibits192: Adolf Kuhner AG - Overview
- Exhibits193: Adolf Kuhner AG - Product / Service
- Exhibits194: Adolf Kuhner AG - Key offerings
- Exhibits195: SWOT
- Exhibits196: Advanced Microdevices Pvt. Ltd. - Overview
- Exhibits197: Advanced Microdevices Pvt. Ltd. - Product / Service
- Exhibits198: Advanced Microdevices Pvt. Ltd. - Key offerings
- Exhibits199: SWOT
- Exhibits200: Avantor Inc. - Overview
- Exhibits201: Avantor Inc. - Business segments
- Exhibits202: Avantor Inc. - Key news
- Exhibits203: Avantor Inc. - Key offerings
- Exhibits204: Avantor Inc. - Segment focus
- Exhibits205: SWOT
- Exhibits206: Compagnie de Saint-Gobain SA - Overview
- Exhibits207: Compagnie de Saint-Gobain SA - Business segments
- Exhibits208: Compagnie de Saint-Gobain SA - Key news
- Exhibits209: Compagnie de Saint-Gobain SA - Key offerings
- Exhibits210: Compagnie de Saint-Gobain SA - Segment focus
- Exhibits211: SWOT
- Exhibits212: Corning Inc. - Overview
- Exhibits213: Corning Inc. - Business segments
- Exhibits214: Corning Inc. - Key news
- Exhibits215: Corning Inc. - Key offerings
- Exhibits216: Corning Inc. - Segment focus
- Exhibits217: SWOT
- Exhibits218: Cytiva - Overview
- Exhibits219: Cytiva - Product / Service
- Exhibits220: Cytiva - Key offerings
- Exhibits221: SWOT
- Exhibits222: Danaher Corp. - Overview
- Exhibits223: Danaher Corp. - Business segments
- Exhibits224: Danaher Corp. - Key news
- Exhibits225: Danaher Corp. - Key offerings
- Exhibits226: Danaher Corp. - Segment focus
- Exhibits227: SWOT
- Exhibits228: Eppendorf SE - Overview
- Exhibits229: Eppendorf SE - Product / Service
- Exhibits230: Eppendorf SE - Key news
- Exhibits231: Eppendorf SE - Key offerings
- Exhibits232: SWOT
- Exhibits233: Getinge AB - Overview
- Exhibits234: Getinge AB - Business segments
- Exhibits235: Getinge AB - Key news
- Exhibits236: Getinge AB - Key offerings
- Exhibits237: Getinge AB - Segment focus
- Exhibits238: SWOT
- Exhibits239: Merck KGaA - Overview
- Exhibits240: Merck KGaA - Business segments
- Exhibits241: Merck KGaA - Key news
- Exhibits242: Merck KGaA - Key offerings
- Exhibits243: Merck KGaA - Segment focus
- Exhibits244: SWOT
- Exhibits245: Sartorius AG - Overview
- Exhibits246: Sartorius AG - Business segments
- Exhibits247: Sartorius AG - Key news
- Exhibits248: Sartorius AG - Key offerings
- Exhibits249: Sartorius AG - Segment focus
- Exhibits250: SWOT
- Exhibits251: Solaris Biotechnology Srl - Overview
- Exhibits252: Solaris Biotechnology Srl - Product / Service
- Exhibits253: Solaris Biotechnology Srl - Key offerings
- Exhibits254: SWOT
- Exhibits255: Thermo Fisher Scientific Inc. - Overview
- Exhibits256: Thermo Fisher Scientific Inc. - Business segments
- Exhibits257: Thermo Fisher Scientific Inc. - Key news
- Exhibits258: Thermo Fisher Scientific Inc. - Key offerings
- Exhibits259: Thermo Fisher Scientific Inc. - Segment focus
- Exhibits260: SWOT
- Exhibits261: Inclusions checklist
- Exhibits262: Exclusions checklist
- Exhibits263: Currency conversion rates for US$
- Exhibits264: Research methodology
- Exhibits265: Information sources
- Exhibits266: Data validation
- Exhibits267: Validation techniques employed for market sizing
- Exhibits268: Data synthesis
- Exhibits269: 360 degree market analysis
- Exhibits270: List of abbreviations
The single-use bioprocessing system market is forecasted to grow by USD 18990.4 mn during 2024-2029, accelerating at a CAGR of 20.2% during the forecast period. The report on the single-use bioprocessing system market provides a holistic analysis, market size and forecast, trends, growth drivers, and challenges, as well as vendor analysis covering around 25 vendors.
The report offers an up-to-date analysis regarding the current market scenario, the latest trends and drivers, and the overall market environment. The market is driven by high demand for biopharmaceuticals to treat various diseases, integration of real-time monitoring and control technologies, and increasing use of single-use technologies to minimize risk of contamination.
| Market Scope | |
|---|---|
| Base Year | 2025 |
| End Year | 2029 |
| Series Year | 2025-2029 |
| Growth Momentum | Accelerate |
| YOY 2025 | 18% |
| CAGR | 20.2% |
| Incremental Value | $18990.4 mn |
The study was conducted using an objective combination of primary and secondary information including inputs from key participants in the industry. The report contains a comprehensive market size data, segment with regional analysis and vendor landscape in addition to an analysis of the key companies. Reports have historic and forecast data.
Technavio's single-use bioprocessing system market is segmented as below:
By Application
- mAb production
- Vaccine production
- Plant cell cultivation
- PSCTs
- Others
By Product
- Bags and mixers
- Bioreactors and fermenters
- Filtration devices and sampling systems
- Bioprocess containers
- Others
By End-user
- Pharmaceutical companies
- CROs and CMOs
- Biotechnology companies
- Academic and research institutions
By Geographical Landscape
- North America
- Europe
- Asia
- Rest of World (ROW)
This study identifies the growing product advancements and automation as one of the prime reasons driving the single-use bioprocessing system market growth during the next few years. Also, increasing adoption of modular facilities among biomanufacturers and need for scalability in biopharmaceutical manufacturing will lead to sizable demand in the market.
The report on the single-use bioprocessing system market covers the following areas:
- Single-Use Bioprocessing System Market sizing
- Single-Use Bioprocessing System Market forecast
- Single-Use Bioprocessing System Market industry analysis
The robust vendor analysis is designed to help clients improve their market position, and in line with this, this report provides a detailed analysis of several leading single-use bioprocessing system market vendors that include 3M Co., ABEC Inc., Adolf Kuhner AG, Advanced Microdevices Pvt. Ltd., Avantor Inc., Celltainer, Compagnie de Saint-Gobain SA, Corning Inc., Cytiva, Danaher Corp., Eppendorf SE, GE Healthcare Technologies Inc., Getinge AB, Merck KGaA, Parker Hannifin Corp., PBS Biotech Inc., Sartorius AG, Solaris Biotechnology Srl, and Thermo Fisher Scientific Inc.. Also, the single-use bioprocessing system market analysis report includes information on upcoming trends and challenges that will influence market growth. This is to help companies strategize and leverage all forthcoming growth opportunities.
The publisher presents a detailed picture of the market by the way of study, synthesis, and summation of data from multiple sources by an analysis of key parameters such as profit, pricing, competition, and promotions. It presents various market facets by identifying the key industry influencers. The data presented is comprehensive, reliable, and a result of extensive primary and secondary research. The market research reports provide a complete competitive landscape and an in-depth vendor selection methodology and analysis using qualitative and quantitative research to forecast accurate market growth.
Table of Contents
1 Executive Summary
- 1.1 Market overview
- Executive Summary - Chart on Market Overview
- Executive Summary - Data Table on Market Overview
- Executive Summary - Chart on Global Market Characteristics
- Executive Summary - Chart on Market By Geographical Landscape
- Executive Summary - Chart on Market Segmentation by Application
- Executive Summary - Chart on Market Segmentation by Product
- Executive Summary - Chart on Market Segmentation by End-user
- Executive Summary - Chart on Incremental Growth
- Executive Summary - Data Table on Incremental Growth
- Executive Summary - Chart on Company Market Positioning
2 Technavio Analysis
- 2.1 Analysis of price sensitivity, lifecycle, customer purchase basket, adoption rates, and purchase criteria
- Analysis of price sensitivity, lifecycle, customer purchase basket, adoption rates, and purchase criteria
- 2.2 Criticality of inputs and Factors of differentiation
- Overview on criticality of inputs and factors of differentiation
- 2.3 Factors of disruption
- Overview on factors of disruption
- 2.4 Impact of drivers and challenges
- Impact of drivers and challenges in 2024 and 2029
3 Market Landscape
- 3.1 Market ecosystem
- Parent Market
- Data Table on - Parent Market
- 3.2 Market characteristics
- Market characteristics analysis
- 3.3 Value chain analysis
- Value chain analysis
4 Market Sizing
- 4.1 Market definition
- Offerings of companies included in the market definition
- 4.2 Market segment analysis
- Market segments
- 4.3 Market size 2024
- 4.4 Market outlook: Forecast for 2024-2029
- Chart on Global - Market size and forecast 2024-2029 ($ million)
- Data Table on Global - Market size and forecast 2024-2029 ($ million)
- Chart on Global Market: Year-over-year growth 2024-2029 (%)
- Data Table on Global Market: Year-over-year growth 2024-2029 (%)
5 Historic Market Size
- 5.1 Global Single-Use Bioprocessing System Market 2019 - 2023
- Historic Market Size - Data Table on Global Single-Use Bioprocessing System Market 2019 - 2023 ($ million)
- 5.2 Application segment analysis 2019 - 2023
- Historic Market Size - Application Segment 2019 - 2023 ($ million)
- 5.3 Product segment analysis 2019 - 2023
- Historic Market Size - Product Segment 2019 - 2023 ($ million)
- 5.4 End-user segment analysis 2019 - 2023
- Historic Market Size - End-user Segment 2019 - 2023 ($ million)
- 5.5 Geography segment analysis 2019 - 2023
- Historic Market Size - Geography Segment 2019 - 2023 ($ million)
- 5.6 Country segment analysis 2019 - 2023
- Historic Market Size - Country Segment 2019 - 2023 ($ million)
6 Qualitative Analysis
- 6.1 Impact of AI on the Global Single-Use Bioprocessing System Market
7 Five Forces Analysis
- 7.1 Five forces summary
- Five forces analysis - Comparison between 2024 and 2029
- 7.2 Bargaining power of buyers
- Bargaining power of buyers - Impact of key factors 2024 and 2029
- 7.3 Bargaining power of suppliers
- Bargaining power of suppliers - Impact of key factors in 2024 and 2029
- 7.4 Threat of new entrants
- Threat of new entrants - Impact of key factors in 2024 and 2029
- 7.5 Threat of substitutes
- Threat of substitutes - Impact of key factors in 2024 and 2029
- 7.6 Threat of rivalry
- Threat of rivalry - Impact of key factors in 2024 and 2029
- 7.7 Market condition
- Chart on Market condition - Five forces 2024 and 2029
8 Market Segmentation by Application
- 8.1 Market segments
- Chart on Application - Market share 2024-2029 (%)
- Data Table on Application - Market share 2024-2029 (%)
- 8.2 Comparison by Application
- Chart on Comparison by Application
- Data Table on Comparison by Application
- 8.3 mAb production - Market size and forecast 2024-2029
- Chart on mAb production - Market size and forecast 2024-2029 ($ million)
- Data Table on mAb production - Market size and forecast 2024-2029 ($ million)
- Chart on mAb production - Year-over-year growth 2024-2029 (%)
- Data Table on mAb production - Year-over-year growth 2024-2029 (%)
- 8.4 Vaccine production - Market size and forecast 2024-2029
- Chart on Vaccine production - Market size and forecast 2024-2029 ($ million)
- Data Table on Vaccine production - Market size and forecast 2024-2029 ($ million)
- Chart on Vaccine production - Year-over-year growth 2024-2029 (%)
- Data Table on Vaccine production - Year-over-year growth 2024-2029 (%)
- 8.5 Plant cell cultivation - Market size and forecast 2024-2029
- Chart on Plant cell cultivation - Market size and forecast 2024-2029 ($ million)
- Data Table on Plant cell cultivation - Market size and forecast 2024-2029 ($ million)
- Chart on Plant cell cultivation - Year-over-year growth 2024-2029 (%)
- Data Table on Plant cell cultivation - Year-over-year growth 2024-2029 (%)
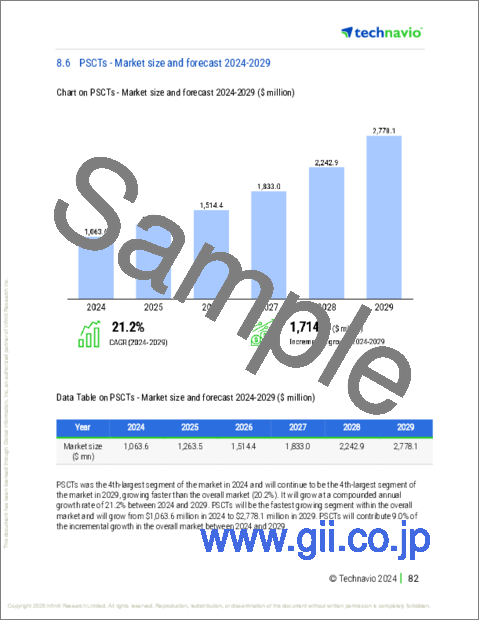
- 8.6 PSCTs - Market size and forecast 2024-2029
- Chart on PSCTs - Market size and forecast 2024-2029 ($ million)
- Data Table on PSCTs - Market size and forecast 2024-2029 ($ million)
- Chart on PSCTs - Year-over-year growth 2024-2029 (%)
- Data Table on PSCTs - Year-over-year growth 2024-2029 (%)
- 8.7 Others - Market size and forecast 2024-2029
- Chart on Others - Market size and forecast 2024-2029 ($ million)
- Data Table on Others - Market size and forecast 2024-2029 ($ million)
- Chart on Others - Year-over-year growth 2024-2029 (%)
- Data Table on Others - Year-over-year growth 2024-2029 (%)
- 8.8 Market opportunity by Application
- Market opportunity by Application ($ million)
- Data Table on Market opportunity by Application ($ million)
9 Market Segmentation by Product
- 9.1 Market segments
- Chart on Product - Market share 2024-2029 (%)
- Data Table on Product - Market share 2024-2029 (%)
- 9.2 Comparison by Product
- Chart on Comparison by Product
- Data Table on Comparison by Product
- 9.3 Bags and mixers - Market size and forecast 2024-2029
- Chart on Bags and mixers - Market size and forecast 2024-2029 ($ million)
- Data Table on Bags and mixers - Market size and forecast 2024-2029 ($ million)
- Chart on Bags and mixers - Year-over-year growth 2024-2029 (%)
- Data Table on Bags and mixers - Year-over-year growth 2024-2029 (%)
- 9.4 Bioreactors and fermenters - Market size and forecast 2024-2029
- Chart on Bioreactors and fermenters - Market size and forecast 2024-2029 ($ million)
- Data Table on Bioreactors and fermenters - Market size and forecast 2024-2029 ($ million)
- Chart on Bioreactors and fermenters - Year-over-year growth 2024-2029 (%)
- Data Table on Bioreactors and fermenters - Year-over-year growth 2024-2029 (%)
- 9.5 Filtration devices and sampling systems - Market size and forecast 2024-2029
- Chart on Filtration devices and sampling systems - Market size and forecast 2024-2029 ($ million)
- Data Table on Filtration devices and sampling systems - Market size and forecast 2024-2029 ($ million)
- Chart on Filtration devices and sampling systems - Year-over-year growth 2024-2029 (%)
- Data Table on Filtration devices and sampling systems - Year-over-year growth 2024-2029 (%)
- 9.6 Bioprocess containers - Market size and forecast 2024-2029
- Chart on Bioprocess containers - Market size and forecast 2024-2029 ($ million)
- Data Table on Bioprocess containers - Market size and forecast 2024-2029 ($ million)
- Chart on Bioprocess containers - Year-over-year growth 2024-2029 (%)
- Data Table on Bioprocess containers - Year-over-year growth 2024-2029 (%)
- 9.7 Others - Market size and forecast 2024-2029
- Chart on Others - Market size and forecast 2024-2029 ($ million)
- Data Table on Others - Market size and forecast 2024-2029 ($ million)
- Chart on Others - Year-over-year growth 2024-2029 (%)
- Data Table on Others - Year-over-year growth 2024-2029 (%)
- 9.8 Market opportunity by Product
- Market opportunity by Product ($ million)
- Data Table on Market opportunity by Product ($ million)
10 Market Segmentation by End-user
- 10.1 Market segments
- Chart on End-user - Market share 2024-2029 (%)
- Data Table on End-user - Market share 2024-2029 (%)
- 10.2 Comparison by End-user
- Chart on Comparison by End-user
- Data Table on Comparison by End-user
- 10.3 Pharmaceutical companies - Market size and forecast 2024-2029
- Chart on Pharmaceutical companies - Market size and forecast 2024-2029 ($ million)
- Data Table on Pharmaceutical companies - Market size and forecast 2024-2029 ($ million)
- Chart on Pharmaceutical companies - Year-over-year growth 2024-2029 (%)
- Data Table on Pharmaceutical companies - Year-over-year growth 2024-2029 (%)
- 10.4 CROs and CMOs - Market size and forecast 2024-2029
- Chart on CROs and CMOs - Market size and forecast 2024-2029 ($ million)
- Data Table on CROs and CMOs - Market size and forecast 2024-2029 ($ million)
- Chart on CROs and CMOs - Year-over-year growth 2024-2029 (%)
- Data Table on CROs and CMOs - Year-over-year growth 2024-2029 (%)
- 10.5 Biotechnology companies - Market size and forecast 2024-2029
- Chart on Biotechnology companies - Market size and forecast 2024-2029 ($ million)
- Data Table on Biotechnology companies - Market size and forecast 2024-2029 ($ million)
- Chart on Biotechnology companies - Year-over-year growth 2024-2029 (%)
- Data Table on Biotechnology companies - Year-over-year growth 2024-2029 (%)
- 10.6 Academic and research institutions - Market size and forecast 2024-2029
- Chart on Academic and research institutions - Market size and forecast 2024-2029 ($ million)
- Data Table on Academic and research institutions - Market size and forecast 2024-2029 ($ million)
- Chart on Academic and research institutions - Year-over-year growth 2024-2029 (%)
- Data Table on Academic and research institutions - Year-over-year growth 2024-2029 (%)
- 10.7 Market opportunity by End-user
- Market opportunity by End-user ($ million)
- Data Table on Market opportunity by End-user ($ million)
11 Customer Landscape
- 11.1 Customer landscape overview
- Analysis of price sensitivity, lifecycle, customer purchase basket, adoption rates, and purchase criteria
12 Geographic Landscape
- 12.1 Geographic segmentation
- Chart on Market share By Geographical Landscape 2024-2029 (%)
- Data Table on Market share By Geographical Landscape 2024-2029 (%)
- 12.2 Geographic comparison
- Chart on Geographic comparison
- Data Table on Geographic comparison
- 12.3 North America - Market size and forecast 2024-2029
- Chart on North America - Market size and forecast 2024-2029 ($ million)
- Data Table on North America - Market size and forecast 2024-2029 ($ million)
- Chart on North America - Year-over-year growth 2024-2029 (%)
- Data Table on North America - Year-over-year growth 2024-2029 (%)
- 12.4 Europe - Market size and forecast 2024-2029
- Chart on Europe - Market size and forecast 2024-2029 ($ million)
- Data Table on Europe - Market size and forecast 2024-2029 ($ million)
- Chart on Europe - Year-over-year growth 2024-2029 (%)
- Data Table on Europe - Year-over-year growth 2024-2029 (%)
- 12.5 Asia - Market size and forecast 2024-2029
- Chart on Asia - Market size and forecast 2024-2029 ($ million)
- Data Table on Asia - Market size and forecast 2024-2029 ($ million)
- Chart on Asia - Year-over-year growth 2024-2029 (%)
- Data Table on Asia - Year-over-year growth 2024-2029 (%)
- 12.6 Rest of World (ROW) - Market size and forecast 2024-2029
- Chart on Rest of World (ROW) - Market size and forecast 2024-2029 ($ million)
- Data Table on Rest of World (ROW) - Market size and forecast 2024-2029 ($ million)
- Chart on Rest of World (ROW) - Year-over-year growth 2024-2029 (%)
- Data Table on Rest of World (ROW) - Year-over-year growth 2024-2029 (%)
- 12.7 US - Market size and forecast 2024-2029
- Chart on US - Market size and forecast 2024-2029 ($ million)
- Data Table on US - Market size and forecast 2024-2029 ($ million)
- Chart on US - Year-over-year growth 2024-2029 (%)
- Data Table on US - Year-over-year growth 2024-2029 (%)
- 12.8 Germany - Market size and forecast 2024-2029
- Chart on Germany - Market size and forecast 2024-2029 ($ million)
- Data Table on Germany - Market size and forecast 2024-2029 ($ million)
- Chart on Germany - Year-over-year growth 2024-2029 (%)
- Data Table on Germany - Year-over-year growth 2024-2029 (%)
- 12.9 China - Market size and forecast 2024-2029
- Chart on China - Market size and forecast 2024-2029 ($ million)
- Data Table on China - Market size and forecast 2024-2029 ($ million)
- Chart on China - Year-over-year growth 2024-2029 (%)
- Data Table on China - Year-over-year growth 2024-2029 (%)
- 12.10 UK - Market size and forecast 2024-2029
- Chart on UK - Market size and forecast 2024-2029 ($ million)
- Data Table on UK - Market size and forecast 2024-2029 ($ million)
- Chart on UK - Year-over-year growth 2024-2029 (%)
- Data Table on UK - Year-over-year growth 2024-2029 (%)
- 12.11 Canada - Market size and forecast 2024-2029
- Chart on Canada - Market size and forecast 2024-2029 ($ million)
- Data Table on Canada - Market size and forecast 2024-2029 ($ million)
- Chart on Canada - Year-over-year growth 2024-2029 (%)
- Data Table on Canada - Year-over-year growth 2024-2029 (%)
- 12.12 France - Market size and forecast 2024-2029
- Chart on France - Market size and forecast 2024-2029 ($ million)
- Data Table on France - Market size and forecast 2024-2029 ($ million)
- Chart on France - Year-over-year growth 2024-2029 (%)
- Data Table on France - Year-over-year growth 2024-2029 (%)
- 12.13 Japan - Market size and forecast 2024-2029
- Chart on Japan - Market size and forecast 2024-2029 ($ million)
- Data Table on Japan - Market size and forecast 2024-2029 ($ million)
- Chart on Japan - Year-over-year growth 2024-2029 (%)
- Data Table on Japan - Year-over-year growth 2024-2029 (%)
- 12.14 Italy - Market size and forecast 2024-2029
- Chart on Italy - Market size and forecast 2024-2029 ($ million)
- Data Table on Italy - Market size and forecast 2024-2029 ($ million)
- Chart on Italy - Year-over-year growth 2024-2029 (%)
- Data Table on Italy - Year-over-year growth 2024-2029 (%)
- 12.15 Brazil - Market size and forecast 2024-2029
- Chart on Brazil - Market size and forecast 2024-2029 ($ million)
- Data Table on Brazil - Market size and forecast 2024-2029 ($ million)
- Chart on Brazil - Year-over-year growth 2024-2029 (%)
- Data Table on Brazil - Year-over-year growth 2024-2029 (%)
- 12.16 India - Market size and forecast 2024-2029
- Chart on India - Market size and forecast 2024-2029 ($ million)
- Data Table on India - Market size and forecast 2024-2029 ($ million)
- Chart on India - Year-over-year growth 2024-2029 (%)
- Data Table on India - Year-over-year growth 2024-2029 (%)
- 12.17 Market opportunity By Geographical Landscape
- Market opportunity By Geographical Landscape ($ million)
- Data Tables on Market opportunity By Geographical Landscape ($ million)
13 Drivers, Challenges, and Opportunity/Restraints
- 13.1 Market drivers
- 13.2 Market challenges
- 13.3 Impact of drivers and challenges
- Impact of drivers and challenges in 2024 and 2029
- 13.4 Market opportunities/restraints
14 Competitive Landscape
- 14.1 Overview
- 14.2 Competitive Landscape
- Overview on criticality of inputs and factors of differentiation
- 14.3 Landscape disruption
- Overview on factors of disruption
- 14.4 Industry risks
- Impact of key risks on business
15 Competitive Analysis
- 15.1 Companies profiled
- Companies covered
- 15.2 Company ranking index
- Company ranking index
- 15.3 Market positioning of companies
- Matrix on companies position and classification
- 3M Co.
- 3M Co. - Overview
- 3M Co. - Business segments
- 3M Co. - Key news
- 3M Co. - Key offerings
- 3M Co. - Segment focus
- SWOT
- 15.5 ABEC Inc.
- ABEC Inc. - Overview
- ABEC Inc. - Product / Service
- ABEC Inc. - Key offerings
- SWOT
- 15.6 Adolf Kuhner AG
- Adolf Kuhner AG - Overview
- Adolf Kuhner AG - Product / Service
- Adolf Kuhner AG - Key offerings
- SWOT
- 15.7 Advanced Microdevices Pvt. Ltd.
- Advanced Microdevices Pvt. Ltd. - Overview
- Advanced Microdevices Pvt. Ltd. - Product / Service
- Advanced Microdevices Pvt. Ltd. - Key offerings
- SWOT
- 15.8 Avantor Inc.
- Avantor Inc. - Overview
- Avantor Inc. - Business segments
- Avantor Inc. - Key news
- Avantor Inc. - Key offerings
- Avantor Inc. - Segment focus
- SWOT
- 15.9 Compagnie de Saint-Gobain SA
- Compagnie de Saint-Gobain SA - Overview
- Compagnie de Saint-Gobain SA - Business segments
- Compagnie de Saint-Gobain SA - Key news
- Compagnie de Saint-Gobain SA - Key offerings
- Compagnie de Saint-Gobain SA - Segment focus
- SWOT
- 15.10 Corning Inc.
- Corning Inc. - Overview
- Corning Inc. - Business segments
- Corning Inc. - Key news
- Corning Inc. - Key offerings
- Corning Inc. - Segment focus
- SWOT
- 15.11 Cytiva
- Cytiva - Overview
- Cytiva - Product / Service
- Cytiva - Key offerings
- SWOT
- 15.12 Danaher Corp.
- Danaher Corp. - Overview
- Danaher Corp. - Business segments
- Danaher Corp. - Key news
- Danaher Corp. - Key offerings
- Danaher Corp. - Segment focus
- SWOT
- 15.13 Eppendorf SE
- Eppendorf SE - Overview
- Eppendorf SE - Product / Service
- Eppendorf SE - Key news
- Eppendorf SE - Key offerings
- SWOT
- 15.14 Getinge AB
- Getinge AB - Overview
- Getinge AB - Business segments
- Getinge AB - Key news
- Getinge AB - Key offerings
- Getinge AB - Segment focus
- SWOT
- 15.15 Merck KGaA
- Merck KGaA - Overview
- Merck KGaA - Business segments
- Merck KGaA - Key news
- Merck KGaA - Key offerings
- Merck KGaA - Segment focus
- SWOT
- 15.16 Sartorius AG
- Sartorius AG - Overview
- Sartorius AG - Business segments
- Sartorius AG - Key news
- Sartorius AG - Key offerings
- Sartorius AG - Segment focus
- SWOT
- 15.17 Solaris Biotechnology Srl
- Solaris Biotechnology Srl - Overview
- Solaris Biotechnology Srl - Product / Service
- Solaris Biotechnology Srl - Key offerings
- SWOT
- 15.18 Thermo Fisher Scientific Inc.
- Thermo Fisher Scientific Inc. - Overview
- Thermo Fisher Scientific Inc. - Business segments
- Thermo Fisher Scientific Inc. - Key news
- Thermo Fisher Scientific Inc. - Key offerings
- Thermo Fisher Scientific Inc. - Segment focus
- SWOT
16 Appendix
- 16.1 Scope of the report
- 16.2 Inclusions and exclusions checklist
- Inclusions checklist
- Exclusions checklist
- 16.3 Currency conversion rates for US$
- Currency conversion rates for US$
- 16.4 Research methodology
- Research methodology
- 16.5 Data procurement
- Information sources
- 16.6 Data validation
- Data validation
- 16.7 Validation techniques employed for market sizing
- Validation techniques employed for market sizing
- 16.8 Data synthesis
- Data synthesis
- 16.9 360 degree market analysis
- 360 degree market analysis
- 16.10 List of abbreviations
- List of abbreviations

