|
|
市場調査レポート
商品コード
1583947
自動車用グリーンタイヤの世界市場 (2024~2028年)Global Automotive Green Tires Market 2024-2028 |
||||||

|
|||||||
カスタマイズ可能
|
|||||||


| 自動車用グリーンタイヤの世界市場 (2024~2028年) |
|
出版日: 2024年08月15日
発行: TechNavio
ページ情報: 英文 171 Pages
納期: 即納可能
|

全表示
- 概要
- 図表
- 目次
自動車用グリーンタイヤ市場 (2024~2028年)
自動車用グリーンタイヤ市場は2023年から2028年に1,675億米ドル分拡大し、予測期間中に18.58%のCAGRで成長すると予測されます。当レポートでは、自動車用グリーンタイヤ市場の全体的な分析、市場規模・予測、動向、成長促進要因、課題、約25社のベンダーを網羅したベンダー分析などを掲載しています。
当レポートでは、現在の市場シナリオ、最新動向と促進要因、市場環境全体に関する最新分析を提供しています。当市場は、入手し易さと低い維持費、グリーンタイヤを使用するメリット、グリーンタイヤの市場イネーブラーとして機能する政府の規範と義務化によって牽引されています。
| 市場範囲 | |
|---|---|
| 基準年 | 2024年 |
| 終了年 | 2028年 |
| 予測期間 | 2024~2028年 |
| 成長モメンタム | 加速 |
| 前年比 (2024年) | 14.37% |
| CAGR | 18.58% |
| 増分額 | 1,675億米ドル |
当レポートでは、自動車用グリーンタイヤの分野での開発が、今後数年間の自動車用グリーンタイヤ市場成長を牽引する主要因の1つであるとしています。またタイヤメーカーは、持続可能なゴム調達手法や、タイヤの製造・再生のための環境に優しい技術の開発に努めており、それが市場の大きな需要につながるであろう。
目次
第1章 エグゼクティブサマリー
- 市場概要
第2章 市場情勢
- 市場エコシステム
- 市場の特徴
- バリューチェーン分析
第3章 市場規模の評価
- 市場の定義
- 市場セグメント分析
- 市場規模 (2023年)
- 市場の見通し (2023~2028年)
第4章 市場規模実績
- 自動車用グリーンタイヤの世界市場 (2018~2022年)
- 用途別分析 (2018~2022年)
- 種類別分析 (2018~2022年)
- 地域別分析 (2018~2022年)
- 国別分析 (2018~2022年)
第5章 ファイブフォース分析
- ファイブフォースの要約
- 買い手の交渉力
- 供給企業の交渉力
- 新規参入業者の脅威
- 代替品の脅威
- 競争の脅威
- 市況
第6章 用途別の市場セグメンテーション
- 市場セグメンテーション
- 比較:用途別
- 乗用車:市場規模と予測 (2023~2028年)
- 商用車:市場規模と予測 (2023~2028年)
- 用途別の市場機会
第7章 種類別市場セグメンテーション
- 市場セグメンテーション
- 比較:種類別
- ラジアルタイヤ:市場規模と予測 (2023~2028年)
- バイアスタイヤ:市場規模と予測 (2023~2028年)
- 種類別の市場機会
第8章 顧客情勢
- 顧客情勢の概要
第9章 地域別情勢
- 地域別セグメンテーション
- 地域別比較
- 欧州:市場規模と予測 (2023~2028年)
- 北米:市場規模と予測 (2023~2028年)
- アジア太平洋:市場規模と予測 (2023~2028年)
- 南米:市場規模と予測 (2023~2028年)
- 中東・アフリカ:市場規模と予測 (2023~2028年)
- 米国:市場規模と予測 (2023~2028年)
- ドイツ:市場規模と予測 (2023~2028年)
- 中国:市場規模と予測 (2023~2028年)
- 日本:市場規模と予測 (2023~2028年)
- フランス:市場規模と予測 (2023~2028年)
- 地域別の市場機会
第10章 促進要因・課題・機会・抑制要因
- 市場促進要因
- 市場の課題
- 促進要因と課題の影響
- 市場の機会・抑制要因
第11章 競合情勢
- 概要
- 競合情勢
- 混乱の状況
- 業界のリスク
第12章 競合分析
- 企業プロファイル
- 企業の市場ポジショニング
- Apollo Tyres Ltd.
- Balkrishna Industries Ltd.
- Bridgestone Corp.
- DOUBLE STAR TIRE
- Giti Tire Pte. Ltd.
- Hankook Tire and Technology Co. Ltd.
- Michelin Group
- NEXEN TIRE Corp.
- Nokian Tyres Plc
- Pirelli and C S.p.A
- Sailun Group Co. Ltd.
- Schaeffler AG
- The Goodyear Tire and Rubber Co.
- Yokohama Tire Corp.
- Zhongce Rubber Group Co. Ltd.
第13章 付録
Exhibits:
- Exhibits1: Executive Summary - Chart on Market Overview
- Exhibits2: Executive Summary - Data Table on Market Overview
- Exhibits3: Executive Summary - Chart on Global Market Characteristics
- Exhibits4: Executive Summary - Chart on Market By Geographical Landscape
- Exhibits5: Executive Summary - Chart on Market Segmentation by Application
- Exhibits6: Executive Summary - Chart on Market Segmentation by Type
- Exhibits7: Executive Summary - Chart on Incremental Growth
- Exhibits8: Executive Summary - Data Table on Incremental Growth
- Exhibits9: Executive Summary - Chart on Company Market Positioning
- Exhibits10: Parent Market
- Exhibits11: Data Table on - Parent Market
- Exhibits12: Market characteristics analysis
- Exhibits13: Value Chain Analysis
- Exhibits14: Offerings of companies included in the market definition
- Exhibits15: Market segments
- Exhibits16: Chart on Global - Market size and forecast 2023-2028 ($ billion)
- Exhibits17: Data Table on Global - Market size and forecast 2023-2028 ($ billion)
- Exhibits18: Chart on Global Market: Year-over-year growth 2023-2028 (%)
- Exhibits19: Data Table on Global Market: Year-over-year growth 2023-2028 (%)
- Exhibits20: Historic Market Size - Data Table on Global Automotive Green Tires Market 2018 - 2022 ($ billion)
- Exhibits21: Historic Market Size - Application Segment 2018 - 2022 ($ billion)
- Exhibits22: Historic Market Size - Type Segment 2018 - 2022 ($ billion)
- Exhibits23: Historic Market Size - Geography Segment 2018 - 2022 ($ billion)
- Exhibits24: Historic Market Size - Country Segment 2018 - 2022 ($ billion)
- Exhibits25: Five forces analysis - Comparison between 2023 and 2028
- Exhibits26: Bargaining power of buyers - Impact of key factors 2023 and 2028
- Exhibits27: Bargaining power of suppliers - Impact of key factors in 2023 and 2028
- Exhibits28: Threat of new entrants - Impact of key factors in 2023 and 2028
- Exhibits29: Threat of substitutes - Impact of key factors in 2023 and 2028
- Exhibits30: Threat of rivalry - Impact of key factors in 2023 and 2028
- Exhibits31: Chart on Market condition - Five forces 2023 and 2028
- Exhibits32: Chart on Application - Market share 2023-2028 (%)
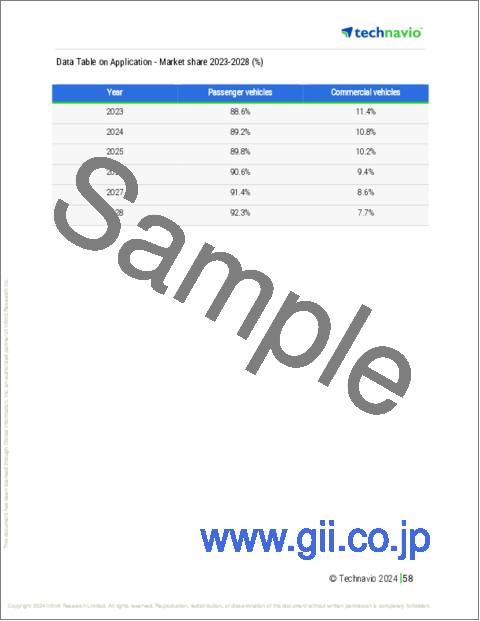
- Exhibits33: Data Table on Application - Market share 2023-2028 (%)
- Exhibits34: Chart on Comparison by Application
- Exhibits35: Data Table on Comparison by Application
- Exhibits36: Chart on Passenger vehicles - Market size and forecast 2023-2028 ($ billion)
- Exhibits37: Data Table on Passenger vehicles - Market size and forecast 2023-2028 ($ billion)
- Exhibits38: Chart on Passenger vehicles - Year-over-year growth 2023-2028 (%)
- Exhibits39: Data Table on Passenger vehicles - Year-over-year growth 2023-2028 (%)
- Exhibits40: Chart on Commercial vehicles - Market size and forecast 2023-2028 ($ billion)
- Exhibits41: Data Table on Commercial vehicles - Market size and forecast 2023-2028 ($ billion)
- Exhibits42: Chart on Commercial vehicles - Year-over-year growth 2023-2028 (%)
- Exhibits43: Data Table on Commercial vehicles - Year-over-year growth 2023-2028 (%)
- Exhibits44: Market opportunity by Application ($ billion)
- Exhibits45: Data Table on Market opportunity by Application ($ billion)
- Exhibits46: Chart on Type - Market share 2023-2028 (%)
- Exhibits47: Data Table on Type - Market share 2023-2028 (%)
- Exhibits48: Chart on Comparison by Type
- Exhibits49: Data Table on Comparison by Type
- Exhibits50: Chart on Radial tire - Market size and forecast 2023-2028 ($ billion)
- Exhibits51: Data Table on Radial tire - Market size and forecast 2023-2028 ($ billion)
- Exhibits52: Chart on Radial tire - Year-over-year growth 2023-2028 (%)
- Exhibits53: Data Table on Radial tire - Year-over-year growth 2023-2028 (%)
- Exhibits54: Chart on Bias tire - Market size and forecast 2023-2028 ($ billion)
- Exhibits55: Data Table on Bias tire - Market size and forecast 2023-2028 ($ billion)
- Exhibits56: Chart on Bias tire - Year-over-year growth 2023-2028 (%)
- Exhibits57: Data Table on Bias tire - Year-over-year growth 2023-2028 (%)
- Exhibits58: Market opportunity by Type ($ billion)
- Exhibits59: Data Table on Market opportunity by Type ($ billion)
- Exhibits60: Analysis of price sensitivity, lifecycle, customer purchase basket, adoption rates, and purchase criteria
- Exhibits61: Chart on Market share By Geographical Landscape 2023-2028 (%)
- Exhibits62: Data Table on Market share By Geographical Landscape 2023-2028 (%)
- Exhibits63: Chart on Geographic comparison
- Exhibits64: Data Table on Geographic comparison
- Exhibits65: Chart on Europe - Market size and forecast 2023-2028 ($ billion)
- Exhibits66: Data Table on Europe - Market size and forecast 2023-2028 ($ billion)
- Exhibits67: Chart on Europe - Year-over-year growth 2023-2028 (%)
- Exhibits68: Data Table on Europe - Year-over-year growth 2023-2028 (%)
- Exhibits69: Chart on North America - Market size and forecast 2023-2028 ($ billion)
- Exhibits70: Data Table on North America - Market size and forecast 2023-2028 ($ billion)
- Exhibits71: Chart on North America - Year-over-year growth 2023-2028 (%)
- Exhibits72: Data Table on North America - Year-over-year growth 2023-2028 (%)
- Exhibits73: Chart on APAC - Market size and forecast 2023-2028 ($ billion)
- Exhibits74: Data Table on APAC - Market size and forecast 2023-2028 ($ billion)
- Exhibits75: Chart on APAC - Year-over-year growth 2023-2028 (%)
- Exhibits76: Data Table on APAC - Year-over-year growth 2023-2028 (%)
- Exhibits77: Chart on South America - Market size and forecast 2023-2028 ($ billion)
- Exhibits78: Data Table on South America - Market size and forecast 2023-2028 ($ billion)
- Exhibits79: Chart on South America - Year-over-year growth 2023-2028 (%)
- Exhibits80: Data Table on South America - Year-over-year growth 2023-2028 (%)
- Exhibits81: Chart on Middle East and Africa - Market size and forecast 2023-2028 ($ billion)
- Exhibits82: Data Table on Middle East and Africa - Market size and forecast 2023-2028 ($ billion)
- Exhibits83: Chart on Middle East and Africa - Year-over-year growth 2023-2028 (%)
- Exhibits84: Data Table on Middle East and Africa - Year-over-year growth 2023-2028 (%)
- Exhibits85: Chart on US - Market size and forecast 2023-2028 ($ billion)
- Exhibits86: Data Table on US - Market size and forecast 2023-2028 ($ billion)
- Exhibits87: Chart on US - Year-over-year growth 2023-2028 (%)
- Exhibits88: Data Table on US - Year-over-year growth 2023-2028 (%)
- Exhibits89: Chart on Germany - Market size and forecast 2023-2028 ($ billion)
- Exhibits90: Data Table on Germany - Market size and forecast 2023-2028 ($ billion)
- Exhibits91: Chart on Germany - Year-over-year growth 2023-2028 (%)
- Exhibits92: Data Table on Germany - Year-over-year growth 2023-2028 (%)
- Exhibits93: Chart on China - Market size and forecast 2023-2028 ($ billion)
- Exhibits94: Data Table on China - Market size and forecast 2023-2028 ($ billion)
- Exhibits95: Chart on China - Year-over-year growth 2023-2028 (%)
- Exhibits96: Data Table on China - Year-over-year growth 2023-2028 (%)
- Exhibits97: Chart on Japan - Market size and forecast 2023-2028 ($ billion)
- Exhibits98: Data Table on Japan - Market size and forecast 2023-2028 ($ billion)
- Exhibits99: Chart on Japan - Year-over-year growth 2023-2028 (%)
- Exhibits100: Data Table on Japan - Year-over-year growth 2023-2028 (%)
- Exhibits101: Chart on France - Market size and forecast 2023-2028 ($ billion)
- Exhibits102: Data Table on France - Market size and forecast 2023-2028 ($ billion)
- Exhibits103: Chart on France - Year-over-year growth 2023-2028 (%)
- Exhibits104: Data Table on France - Year-over-year growth 2023-2028 (%)
- Exhibits105: Market opportunity By Geographical Landscape ($ billion)
- Exhibits106: Data Tables on Market opportunity By Geographical Landscape ($ billion)
- Exhibits107: Impact of drivers and challenges in 2023 and 2028
- Exhibits108: Overview on criticality of inputs and factors of differentiation
- Exhibits109: Overview on factors of disruption
- Exhibits110: Impact of key risks on business
- Exhibits111: Companies covered
- Exhibits112: Matrix on companies position and classification
- Exhibits113: Apollo Tyres Ltd. - Overview
- Exhibits114: Apollo Tyres Ltd. - Business segments
- Exhibits115: Apollo Tyres Ltd. - Key offerings
- Exhibits116: Apollo Tyres Ltd. - Segment focus
- Exhibits117: Balkrishna Industries Ltd. - Overview
- Exhibits118: Balkrishna Industries Ltd. - Product / Service
- Exhibits119: Balkrishna Industries Ltd. - Key offerings
- Exhibits120: Bridgestone Corp. - Overview
- Exhibits121: Bridgestone Corp. - Business segments
- Exhibits122: Bridgestone Corp. - Key news
- Exhibits123: Bridgestone Corp. - Key offerings
- Exhibits124: Bridgestone Corp. - Segment focus
- Exhibits125: DOUBLE STAR TIRE - Overview
- Exhibits126: DOUBLE STAR TIRE - Product / Service
- Exhibits127: DOUBLE STAR TIRE - Key offerings
- Exhibits128: Giti Tire Pte. Ltd. - Overview
- Exhibits129: Giti Tire Pte. Ltd. - Product / Service
- Exhibits130: Giti Tire Pte. Ltd. - Key offerings
- Exhibits131: Hankook Tire and Technology Co. Ltd. - Overview
- Exhibits132: Hankook Tire and Technology Co. Ltd. - Product / Service
- Exhibits133: Hankook Tire and Technology Co. Ltd. - Key offerings
- Exhibits134: Michelin Group - Overview
- Exhibits135: Michelin Group - Business segments
- Exhibits136: Michelin Group - Key news
- Exhibits137: Michelin Group - Key offerings
- Exhibits138: Michelin Group - Segment focus
- Exhibits139: NEXEN TIRE Corp. - Overview
- Exhibits140: NEXEN TIRE Corp. - Product / Service
- Exhibits141: NEXEN TIRE Corp. - Key offerings
- Exhibits142: Nokian Tyres Plc - Overview
- Exhibits143: Nokian Tyres Plc - Business segments
- Exhibits144: Nokian Tyres Plc - Key offerings
- Exhibits145: Nokian Tyres Plc - Segment focus
- Exhibits146: Pirelli and C S.p.A - Overview
- Exhibits147: Pirelli and C S.p.A - Business segments
- Exhibits148: Pirelli and C S.p.A - Key offerings
- Exhibits149: Pirelli and C S.p.A - Segment focus
- Exhibits150: Sailun Group Co. Ltd. - Overview
- Exhibits151: Sailun Group Co. Ltd. - Product / Service
- Exhibits152: Sailun Group Co. Ltd. - Key offerings
- Exhibits153: Schaeffler AG - Overview
- Exhibits154: Schaeffler AG - Business segments
- Exhibits155: Schaeffler AG - Key news
- Exhibits156: Schaeffler AG - Key offerings
- Exhibits157: Schaeffler AG - Segment focus
- Exhibits158: The Goodyear Tire and Rubber Co. - Overview
- Exhibits159: The Goodyear Tire and Rubber Co. - Business segments
- Exhibits160: The Goodyear Tire and Rubber Co. - Key news
- Exhibits161: The Goodyear Tire and Rubber Co. - Key offerings
- Exhibits162: The Goodyear Tire and Rubber Co. - Segment focus
- Exhibits163: Yokohama Tire Corp. - Overview
- Exhibits164: Yokohama Tire Corp. - Product / Service
- Exhibits165: Yokohama Tire Corp. - Key offerings
- Exhibits166: Zhongce Rubber Group Co. Ltd. - Overview
- Exhibits167: Zhongce Rubber Group Co. Ltd. - Product / Service
- Exhibits168: Zhongce Rubber Group Co. Ltd. - Key offerings
- Exhibits169: Inclusions checklist
- Exhibits170: Exclusions checklist
- Exhibits171: Currency conversion rates for US$
- Exhibits172: Research methodology
- Exhibits173: Information sources
- Exhibits174: Data validation
- Exhibits175: Validation techniques employed for market sizing
- Exhibits176: Data synthesis
- Exhibits177: 360 degree market analysis
- Exhibits178: List of abbreviations
Automotive Green Tires Market 2024-2028
The automotive green tires market is forecasted to grow by USD 167.5 bn during 2023-2028, accelerating at a CAGR of 18.58% during the forecast period. The report on the automotive green tires market provides a holistic analysis, market size and forecast, trends, growth drivers, and challenges, as well as vendor analysis covering around 25 vendors.
The report offers an up-to-date analysis regarding the current market scenario, the latest trends and drivers, and the overall market environment. The market is driven by high affordability and low maintenance cost, benefits of using green tires, and government norms and mandates acting as market enablers for green tires.
| Market Scope | |
|---|---|
| Base Year | 2024 |
| End Year | 2028 |
| Series Year | 2024-2028 |
| Growth Momentum | Accelerate |
| YOY 2024 | 14.37% |
| CAGR | 18.58% |
| Incremental Value | $167.5 bn |
Technavio's automotive green tires market is segmented as below:
By Application
- Passenger vehicles
- Commercial vehicles
By Type
- Radial tire
- Bias tire
By Geographical Landscape
- Europe
- North America
- APAC
- South America
- Middle East and Africa
This study identifies the developments in the field of automotive green tires as one of the prime reasons driving the automotive green tires market growth during the next few years. Also, tire manufacturers striving for sustainable practices for rubber sourcing and development of environment-friendly technology for manufacturing and recycling tires will lead to sizable demand in the market.
The report on the automotive green tires market covers the following areas:
- Automotive green tires market sizing
- Automotive green tires market forecast
- Automotive green tires market industry analysis
The robust vendor analysis is designed to help clients improve their market position, and in line with this, this report provides a detailed analysis of several leading automotive green tires market vendors that include Apollo Tyres Ltd., Balkrishna Industries Ltd., Bridgestone Corp., DOUBLE STAR TIRE, Emerald Resilient Tyre Manufacturers Pvt. Ltd., Giti Tire Pte. Ltd., GRI Tires, Hankook Tire and Technology Co. Ltd., Maxxis International, Michelin Group, NEXEN TIRE Corp., Nokian Tyres Plc., Pirelli and C S.p.A, RPG Enterprises, Sailun Group Co. Ltd., Schaeffler AG, The Goodyear Tire and Rubber Co., Triangle Tyres, Yokohama Tire Corp., and Zhongce Rubber Group Co. Ltd.. Also, the automotive green tires market analysis report includes information on upcoming trends and challenges that will influence market growth. This is to help companies strategize and leverage all forthcoming growth opportunities.
The study was conducted using an objective combination of primary and secondary information including inputs from key participants in the industry. The report contains a comprehensive market and vendor landscape in addition to an analysis of the key vendors.
The publisher presents a detailed picture of the market by the way of study, synthesis, and summation of data from multiple sources by an analysis of key parameters such as profit, pricing, competition, and promotions. It presents various market facets by identifying the key industry influencers. The data presented is comprehensive, reliable, and a result of extensive primary and secondary research. The market research reports provide a complete competitive landscape and an in-depth vendor selection methodology and analysis using qualitative and quantitative research to forecast accurate market growth.
Table of Contents
1 Executive Summary
- 1.1 Market overview
- Executive Summary - Chart on Market Overview
- Executive Summary - Data Table on Market Overview
- Executive Summary - Chart on Global Market Characteristics
- Executive Summary - Chart on Market By Geographical Landscape
- Executive Summary - Chart on Market Segmentation by Application
- Executive Summary - Chart on Market Segmentation by Type
- Executive Summary - Chart on Incremental Growth
- Executive Summary - Data Table on Incremental Growth
- Executive Summary - Chart on Company Market Positioning
2 Market Landscape
- 2.1 Market ecosystem
- Parent Market
- Data Table on - Parent Market
- 2.2 Market characteristics
- Market characteristics analysis
- 2.3 Value chain analysis
- Value Chain Analysis
3 Market Sizing
- 3.1 Market definition
- Offerings of companies included in the market definition
- 3.2 Market segment analysis
- Market segments
- 3.3 Market size 2023
- 3.4 Market outlook: Forecast for 2023-2028
- Chart on Global - Market size and forecast 2023-2028 ($ billion)
- Data Table on Global - Market size and forecast 2023-2028 ($ billion)
- Chart on Global Market: Year-over-year growth 2023-2028 (%)
- Data Table on Global Market: Year-over-year growth 2023-2028 (%)
4 Historic Market Size
- 4.1 Global Automotive Green Tires Market 2018 - 2022
- Historic Market Size - Data Table on Global Automotive Green Tires Market 2018 - 2022 ($ billion)
- 4.2 Application segment analysis 2018 - 2022
- Historic Market Size - Application Segment 2018 - 2022 ($ billion)
- 4.3 Type segment analysis 2018 - 2022
- Historic Market Size - Type Segment 2018 - 2022 ($ billion)
- 4.4 Geography segment analysis 2018 - 2022
- Historic Market Size - Geography Segment 2018 - 2022 ($ billion)
- 4.5 Country segment analysis 2018 - 2022
- Historic Market Size - Country Segment 2018 - 2022 ($ billion)
5 Five Forces Analysis
- 5.1 Five forces summary
- Five forces analysis - Comparison between 2023 and 2028
- 5.2 Bargaining power of buyers
- Bargaining power of buyers - Impact of key factors 2023 and 2028
- 5.3 Bargaining power of suppliers
- Bargaining power of suppliers - Impact of key factors in 2023 and 2028
- 5.4 Threat of new entrants
- Threat of new entrants - Impact of key factors in 2023 and 2028
- 5.5 Threat of substitutes
- Threat of substitutes - Impact of key factors in 2023 and 2028
- 5.6 Threat of rivalry
- Threat of rivalry - Impact of key factors in 2023 and 2028
- 5.7 Market condition
- Chart on Market condition - Five forces 2023 and 2028
6 Market Segmentation by Application
- 6.1 Market segments
- Chart on Application - Market share 2023-2028 (%)
- Data Table on Application - Market share 2023-2028 (%)
- 6.2 Comparison by Application
- Chart on Comparison by Application
- Data Table on Comparison by Application
- 6.3 Passenger vehicles - Market size and forecast 2023-2028
- Chart on Passenger vehicles - Market size and forecast 2023-2028 ($ billion)
- Data Table on Passenger vehicles - Market size and forecast 2023-2028 ($ billion)
- Chart on Passenger vehicles - Year-over-year growth 2023-2028 (%)
- Data Table on Passenger vehicles - Year-over-year growth 2023-2028 (%)
- 6.4 Commercial vehicles - Market size and forecast 2023-2028
- Chart on Commercial vehicles - Market size and forecast 2023-2028 ($ billion)
- Data Table on Commercial vehicles - Market size and forecast 2023-2028 ($ billion)
- Chart on Commercial vehicles - Year-over-year growth 2023-2028 (%)
- Data Table on Commercial vehicles - Year-over-year growth 2023-2028 (%)
- 6.5 Market opportunity by Application
- Market opportunity by Application ($ billion)
- Data Table on Market opportunity by Application ($ billion)
7 Market Segmentation by Type
- 7.1 Market segments
- Chart on Type - Market share 2023-2028 (%)
- Data Table on Type - Market share 2023-2028 (%)
- 7.2 Comparison by Type
- Chart on Comparison by Type
- Data Table on Comparison by Type
- 7.3 Radial tire - Market size and forecast 2023-2028
- Chart on Radial tire - Market size and forecast 2023-2028 ($ billion)
- Data Table on Radial tire - Market size and forecast 2023-2028 ($ billion)
- Chart on Radial tire - Year-over-year growth 2023-2028 (%)
- Data Table on Radial tire - Year-over-year growth 2023-2028 (%)
- 7.4 Bias tire - Market size and forecast 2023-2028
- Chart on Bias tire - Market size and forecast 2023-2028 ($ billion)
- Data Table on Bias tire - Market size and forecast 2023-2028 ($ billion)
- Chart on Bias tire - Year-over-year growth 2023-2028 (%)
- Data Table on Bias tire - Year-over-year growth 2023-2028 (%)
- 7.5 Market opportunity by Type
- Market opportunity by Type ($ billion)
- Data Table on Market opportunity by Type ($ billion)
8 Customer Landscape
- 8.1 Customer landscape overview
- Analysis of price sensitivity, lifecycle, customer purchase basket, adoption rates, and purchase criteria
9 Geographic Landscape
- 9.1 Geographic segmentation
- Chart on Market share By Geographical Landscape 2023-2028 (%)
- Data Table on Market share By Geographical Landscape 2023-2028 (%)
- 9.2 Geographic comparison
- Chart on Geographic comparison
- Data Table on Geographic comparison
- 9.3 Europe - Market size and forecast 2023-2028
- Chart on Europe - Market size and forecast 2023-2028 ($ billion)
- Data Table on Europe - Market size and forecast 2023-2028 ($ billion)
- Chart on Europe - Year-over-year growth 2023-2028 (%)
- Data Table on Europe - Year-over-year growth 2023-2028 (%)
- 9.4 North America - Market size and forecast 2023-2028
- Chart on North America - Market size and forecast 2023-2028 ($ billion)
- Data Table on North America - Market size and forecast 2023-2028 ($ billion)
- Chart on North America - Year-over-year growth 2023-2028 (%)
- Data Table on North America - Year-over-year growth 2023-2028 (%)
- 9.5 APAC - Market size and forecast 2023-2028
- Chart on APAC - Market size and forecast 2023-2028 ($ billion)
- Data Table on APAC - Market size and forecast 2023-2028 ($ billion)
- Chart on APAC - Year-over-year growth 2023-2028 (%)
- Data Table on APAC - Year-over-year growth 2023-2028 (%)
- 9.6 South America - Market size and forecast 2023-2028
- Chart on South America - Market size and forecast 2023-2028 ($ billion)
- Data Table on South America - Market size and forecast 2023-2028 ($ billion)
- Chart on South America - Year-over-year growth 2023-2028 (%)
- Data Table on South America - Year-over-year growth 2023-2028 (%)
- 9.7 Middle East and Africa - Market size and forecast 2023-2028
- Chart on Middle East and Africa - Market size and forecast 2023-2028 ($ billion)
- Data Table on Middle East and Africa - Market size and forecast 2023-2028 ($ billion)
- Chart on Middle East and Africa - Year-over-year growth 2023-2028 (%)
- Data Table on Middle East and Africa - Year-over-year growth 2023-2028 (%)
- 9.8 US - Market size and forecast 2023-2028
- Chart on US - Market size and forecast 2023-2028 ($ billion)
- Data Table on US - Market size and forecast 2023-2028 ($ billion)
- Chart on US - Year-over-year growth 2023-2028 (%)
- Data Table on US - Year-over-year growth 2023-2028 (%)
- 9.9 Germany - Market size and forecast 2023-2028
- Chart on Germany - Market size and forecast 2023-2028 ($ billion)
- Data Table on Germany - Market size and forecast 2023-2028 ($ billion)
- Chart on Germany - Year-over-year growth 2023-2028 (%)
- Data Table on Germany - Year-over-year growth 2023-2028 (%)
- 9.10 China - Market size and forecast 2023-2028
- Chart on China - Market size and forecast 2023-2028 ($ billion)
- Data Table on China - Market size and forecast 2023-2028 ($ billion)
- Chart on China - Year-over-year growth 2023-2028 (%)
- Data Table on China - Year-over-year growth 2023-2028 (%)
- 9.11 Japan - Market size and forecast 2023-2028
- Chart on Japan - Market size and forecast 2023-2028 ($ billion)
- Data Table on Japan - Market size and forecast 2023-2028 ($ billion)
- Chart on Japan - Year-over-year growth 2023-2028 (%)
- Data Table on Japan - Year-over-year growth 2023-2028 (%)
- 9.12 France - Market size and forecast 2023-2028
- Chart on France - Market size and forecast 2023-2028 ($ billion)
- Data Table on France - Market size and forecast 2023-2028 ($ billion)
- Chart on France - Year-over-year growth 2023-2028 (%)
- Data Table on France - Year-over-year growth 2023-2028 (%)
- 9.13 Market opportunity By Geographical Landscape
- Market opportunity By Geographical Landscape ($ billion)
- Data Tables on Market opportunity By Geographical Landscape ($ billion)
10 Drivers, Challenges, and Opportunity/Restraints
- 10.1 Market drivers
- 10.2 Market challenges
- 10.3 Impact of drivers and challenges
- Impact of drivers and challenges in 2023 and 2028
- 10.4 Market opportunities/restraints
11 Competitive Landscape
- 11.1 Overview
- 11.2 Competitive Landscape
- Overview on criticality of inputs and factors of differentiation
- 11.3 Landscape disruption
- Overview on factors of disruption
- 11.4 Industry risks
- Impact of key risks on business
12 Competitive Analysis
- 12.1 Companies profiled
- Companies covered
- 12.2 Market positioning of companies
- Matrix on companies position and classification
- 12.3 Apollo Tyres Ltd.
- Apollo Tyres Ltd. - Overview
- Apollo Tyres Ltd. - Business segments
- Apollo Tyres Ltd. - Key offerings
- Apollo Tyres Ltd. - Segment focus
- 12.4 Balkrishna Industries Ltd.
- Balkrishna Industries Ltd. - Overview
- Balkrishna Industries Ltd. - Product / Service
- Balkrishna Industries Ltd. - Key offerings
- 12.5 Bridgestone Corp.
- Bridgestone Corp. - Overview
- Bridgestone Corp. - Business segments
- Bridgestone Corp. - Key news
- Bridgestone Corp. - Key offerings
- Bridgestone Corp. - Segment focus
- 12.6 DOUBLE STAR TIRE
- DOUBLE STAR TIRE - Overview
- DOUBLE STAR TIRE - Product / Service
- DOUBLE STAR TIRE - Key offerings
- 12.7 Giti Tire Pte. Ltd.
- Giti Tire Pte. Ltd. - Overview
- Giti Tire Pte. Ltd. - Product / Service
- Giti Tire Pte. Ltd. - Key offerings
- 12.8 Hankook Tire and Technology Co. Ltd.
- Hankook Tire and Technology Co. Ltd. - Overview
- Hankook Tire and Technology Co. Ltd. - Product / Service
- Hankook Tire and Technology Co. Ltd. - Key offerings
- 12.9 Michelin Group
- Michelin Group - Overview
- Michelin Group - Business segments
- Michelin Group - Key news
- Michelin Group - Key offerings
- Michelin Group - Segment focus
- 12.10 NEXEN TIRE Corp.
- NEXEN TIRE Corp. - Overview
- NEXEN TIRE Corp. - Product / Service
- NEXEN TIRE Corp. - Key offerings
- 12.11 Nokian Tyres Plc
- Nokian Tyres Plc - Overview
- Nokian Tyres Plc - Business segments
- Nokian Tyres Plc - Key offerings
- Nokian Tyres Plc - Segment focus
- 12.12 Pirelli and C S.p.A
- Pirelli and C S.p.A - Overview
- Pirelli and C S.p.A - Business segments
- Pirelli and C S.p.A - Key offerings
- Pirelli and C S.p.A - Segment focus
- 12.13 Sailun Group Co. Ltd.
- Sailun Group Co. Ltd. - Overview
- Sailun Group Co. Ltd. - Product / Service
- Sailun Group Co. Ltd. - Key offerings
- 12.14 Schaeffler AG
- Schaeffler AG - Overview
- Schaeffler AG - Business segments
- Schaeffler AG - Key news
- Schaeffler AG - Key offerings
- Schaeffler AG - Segment focus
- 12.15 The Goodyear Tire and Rubber Co.
- The Goodyear Tire and Rubber Co. - Overview
- The Goodyear Tire and Rubber Co. - Business segments
- The Goodyear Tire and Rubber Co. - Key news
- The Goodyear Tire and Rubber Co. - Key offerings
- The Goodyear Tire and Rubber Co. - Segment focus
- 12.16 Yokohama Tire Corp.
- Yokohama Tire Corp. - Overview
- Yokohama Tire Corp. - Product / Service
- Yokohama Tire Corp. - Key offerings
- 12.17 Zhongce Rubber Group Co. Ltd.
- Zhongce Rubber Group Co. Ltd. - Overview
- Zhongce Rubber Group Co. Ltd. - Product / Service
- Zhongce Rubber Group Co. Ltd. - Key offerings
13 Appendix
- 13.1 Scope of the report
- 13.2 Inclusions and exclusions checklist
- Inclusions checklist
- Exclusions checklist
- 13.3 Currency conversion rates for US$
- Currency conversion rates for US$
- 13.4 Research methodology
- Research methodology
- 13.5 Data procurement
- Information sources
- 13.6 Data validation
- Data validation
- 13.7 Validation techniques employed for market sizing
- Validation techniques employed for market sizing
- 13.8 Data synthesis
- Data synthesis
- 13.9 360 degree market analysis
- 360 degree market analysis
- 13.10 List of abbreviations
- List of abbreviations

