|
|
市場調査レポート
商品コード
1491588
農業用収穫機の世界市場 2024-2028Global agricultural harvester market 2024-2028 |
||||||
|
|||||||
カスタマイズ可能
|
|||||||

| 農業用収穫機の世界市場 2024-2028 |
|
出版日: 2024年05月21日
発行: TechNavio
ページ情報: 英文 170 Pages
納期: 即納可能
|

全表示
- 概要
- 図表
- 目次
農業用収穫機市場は2023-2028年に253億7,360万米ドル、予測期間中のCAGRは8.39%で成長すると予測されます。
当レポートでは、農業用収穫機市場の全体的な分析、市場規模・予測、動向、成長促進要因、課題、約25のベンダーを網羅したベンダー分析などを掲載しています。
現在の市場シナリオ、最新動向と促進要因、市場環境全体に関する最新分析を提供しています。市場は、農業分野における労働力不足、収穫機械化を支援する政府の取り組み、農業用収穫機の利点と技術的進歩によって牽引されています。
| 市場範囲 | |
|---|---|
| 基準年 | 2024 |
| 終了年 | 2028 |
| 予測期間 | 2024-2028 |
| 成長モメンタム | 加速 |
| 前年比2024年 | 7.74% |
| CAGR | 8.39% |
| 増分額 | 253億7,360万米ドル |
本調査では、今後数年間の農業用収穫機市場成長を牽引する主要因の1つとして、3Dカメラ搭載自走式飼料収穫機の普及拡大を挙げています。また、高性能エンジンに対する需要の増加や、セルフクリーニング式サトウキビ収穫機に対する嗜好の高まりは、市場の大きな需要につながります。
目次
第1章 エグゼクティブサマリー
- 市場概要
第2章 市場情勢
- 市場エコシステム
- 市場の特徴
- バリューチェーン分析
第3章 市場規模の評価
- 市場の定義
- 市場セグメント分析
- 市場規模 2023
- 市場の見通し 2023-2028
第4章 市場規模実績
- 世界農業用収穫機市場 2018-2022
- 製品セグメント分析 2018-2022
- タイプセグメント分析 2018-2022
- 地域別セグメント分析 2018-2022
- 国別セグメント分析 2018-2022
第5章 ファイブフォース分析
- ファイブフォースの要約
- 買い手の交渉力
- 供給企業の交渉力
- 新規参入業者の脅威
- 代替品の脅威
- 競争の脅威
- 市況
第6章 市場セグメンテーション:製品別
- 市場セグメンテーション
- 比較:製品別
- コンバイン:市場規模と予測 2023-2028
- 飼料収穫機:市場規模と予測 2023-2028
- 市場機会:製品別
第7章 市場セグメンテーション:タイプ別
- 市場セグメンテーション
- 比較:タイプ別
- 四輪駆動収穫機:市場規模と予測 2023-2028
- 二輪駆動収穫機:市場規模と予測 2023-2028
- 市場機会:タイプ別
第8章 顧客情勢
- 顧客情勢の概要
第9章 地域別情勢
- 地域別セグメンテーション
- 地域別比較
- 欧州:市場規模と予測 2023-2028
- 北米:市場規模と予測 2023-2028
- アジア太平洋:市場規模と予測 2023-2028
- 南米:市場規模と予測 2023-2028
- 中東・アフリカ:市場規模と予測 2023-2028
- 米国:市場規模と予測 2023-2028
- ドイツ:市場規模と予測 2023-2028
- 中国:市場規模と予測 2023-2028
- 英国:市場規模と予測 2023-2028
- カナダ:市場規模と予測 2023-2028
- 市場機会:地域情勢別
第10章 促進要因・課題・機会・抑制要因
- 市場促進要因
- 市場の課題
- 促進要因と課題の影響
- 市場の機会・抑制要因
第11章 競合情勢
- 概要
- 競合情勢
- 混乱の状況
- 業界のリスク
第12章 競合分析
- 企業プロファイル
- 企業の市場ポジショニング
- AGCO Corp.
- Bucher Industries AG
- CHANGFA
- Changzhou Dongfeng Agricultural Machinery Group Co. Ltd.
- China National Machinery Industry Corp. Ltd.
- CLAAS KGaA mBH
- CNH Industrial NV
- Daedong Corp.
- Deere and Co.
- ISEKI and Co. Ltd.
- J C Bamford Excavators Ltd.
- Kubota Corp.
- Mahindra and Mahindra Ltd.
- SDF SpA
- Sonalika International Tractors Ltd.
第13章 付録
Exhibits:
- Exhibits1: Executive Summary - Chart on Market Overview
- Exhibits2: Executive Summary - Data Table on Market Overview
- Exhibits3: Executive Summary - Chart on Global Market Characteristics
- Exhibits4: Executive Summary - Chart on Market By Geographical Landscape
- Exhibits5: Executive Summary - Chart on Market Segmentation by Product
- Exhibits6: Executive Summary - Chart on Market Segmentation by Type
- Exhibits7: Executive Summary - Chart on Incremental Growth
- Exhibits8: Executive Summary - Data Table on Incremental Growth
- Exhibits9: Executive Summary - Chart on Company Market Positioning
- Exhibits10: Parent Market
- Exhibits11: Data Table on - Parent Market
- Exhibits12: Market characteristics analysis
- Exhibits13: Value Chain Analysis
- Exhibits14: Offerings of companies included in the market definition
- Exhibits15: Market segments
- Exhibits16: Chart on Global - Market size and forecast 2023-2028 ($ million)
- Exhibits17: Data Table on Global - Market size and forecast 2023-2028 ($ million)
- Exhibits18: Chart on Global Market: Year-over-year growth 2023-2028 (%)
- Exhibits19: Data Table on Global Market: Year-over-year growth 2023-2028 (%)
- Exhibits20: Historic Market Size - Data Table on Global Agricultural Harvester Market 2018 - 2022 ($ million)
- Exhibits21: Historic Market Size - Product Segment 2018 - 2022 ($ million)
- Exhibits22: Historic Market Size - Type Segment 2018 - 2022 ($ million)
- Exhibits23: Historic Market Size - Geography Segment 2018 - 2022 ($ million)
- Exhibits24: Historic Market Size - Country Segment 2018 - 2022 ($ million)
- Exhibits25: Five forces analysis - Comparison between 2023 and 2028
- Exhibits26: Bargaining power of buyers - Impact of key factors 2023 and 2028
- Exhibits27: Bargaining power of suppliers - Impact of key factors in 2023 and 2028
- Exhibits28: Threat of new entrants - Impact of key factors in 2023 and 2028
- Exhibits29: Threat of substitutes - Impact of key factors in 2023 and 2028
- Exhibits30: Threat of rivalry - Impact of key factors in 2023 and 2028
- Exhibits31: Chart on Market condition - Five forces 2023 and 2028
- Exhibits32: Chart on Product - Market share 2023-2028 (%)
- Exhibits33: Data Table on Product - Market share 2023-2028 (%)
- Exhibits34: Chart on Comparison by Product
- Exhibits35: Data Table on Comparison by Product
- Exhibits36: Chart on Combine harvesters - Market size and forecast 2023-2028 ($ million)
- Exhibits37: Data Table on Combine harvesters - Market size and forecast 2023-2028 ($ million)
- Exhibits38: Chart on Combine harvesters - Year-over-year growth 2023-2028 (%)
- Exhibits39: Data Table on Combine harvesters - Year-over-year growth 2023-2028 (%)
- Exhibits40: Chart on Forage harvesters - Market size and forecast 2023-2028 ($ million)
- Exhibits41: Data Table on Forage harvesters - Market size and forecast 2023-2028 ($ million)
- Exhibits42: Chart on Forage harvesters - Year-over-year growth 2023-2028 (%)
- Exhibits43: Data Table on Forage harvesters - Year-over-year growth 2023-2028 (%)
- Exhibits44: Market opportunity by Product ($ million)
- Exhibits45: Data Table on Market opportunity by Product ($ million)
- Exhibits46: Chart on Type - Market share 2023-2028 (%)
- Exhibits47: Data Table on Type - Market share 2023-2028 (%)
- Exhibits48: Chart on Comparison by Type
- Exhibits49: Data Table on Comparison by Type
- Exhibits50: Chart on Four-wheel drive harvesters - Market size and forecast 2023-2028 ($ million)
- Exhibits51: Data Table on Four-wheel drive harvesters - Market size and forecast 2023-2028 ($ million)
- Exhibits52: Chart on Four-wheel drive harvesters - Year-over-year growth 2023-2028 (%)
- Exhibits53: Data Table on Four-wheel drive harvesters - Year-over-year growth 2023-2028 (%)
- Exhibits54: Chart on Two-wheel drive harvesters - Market size and forecast 2023-2028 ($ million)
- Exhibits55: Data Table on Two-wheel drive harvesters - Market size and forecast 2023-2028 ($ million)
- Exhibits56: Chart on Two-wheel drive harvesters - Year-over-year growth 2023-2028 (%)
- Exhibits57: Data Table on Two-wheel drive harvesters - Year-over-year growth 2023-2028 (%)
- Exhibits58: Market opportunity by Type ($ million)
- Exhibits59: Data Table on Market opportunity by Type ($ million)
- Exhibits60: Analysis of price sensitivity, lifecycle, customer purchase basket, adoption rates, and purchase criteria
- Exhibits61: Chart on Market share By Geographical Landscape 2023-2028 (%)
- Exhibits62: Data Table on Market share By Geographical Landscape 2023-2028 (%)
- Exhibits63: Chart on Geographic comparison
- Exhibits64: Data Table on Geographic comparison
- Exhibits65: Chart on Europe - Market size and forecast 2023-2028 ($ million)
- Exhibits66: Data Table on Europe - Market size and forecast 2023-2028 ($ million)
- Exhibits67: Chart on Europe - Year-over-year growth 2023-2028 (%)
- Exhibits68: Data Table on Europe - Year-over-year growth 2023-2028 (%)
- Exhibits69: Chart on North America - Market size and forecast 2023-2028 ($ million)
- Exhibits70: Data Table on North America - Market size and forecast 2023-2028 ($ million)
- Exhibits71: Chart on North America - Year-over-year growth 2023-2028 (%)
- Exhibits72: Data Table on North America - Year-over-year growth 2023-2028 (%)
- Exhibits73: Chart on APAC - Market size and forecast 2023-2028 ($ million)
- Exhibits74: Data Table on APAC - Market size and forecast 2023-2028 ($ million)
- Exhibits75: Chart on APAC - Year-over-year growth 2023-2028 (%)
- Exhibits76: Data Table on APAC - Year-over-year growth 2023-2028 (%)
- Exhibits77: Chart on South America - Market size and forecast 2023-2028 ($ million)
- Exhibits78: Data Table on South America - Market size and forecast 2023-2028 ($ million)
- Exhibits79: Chart on South America - Year-over-year growth 2023-2028 (%)
- Exhibits80: Data Table on South America - Year-over-year growth 2023-2028 (%)
- Exhibits81: Chart on Middle East and Africa - Market size and forecast 2023-2028 ($ million)
- Exhibits82: Data Table on Middle East and Africa - Market size and forecast 2023-2028 ($ million)
- Exhibits83: Chart on Middle East and Africa - Year-over-year growth 2023-2028 (%)
- Exhibits84: Data Table on Middle East and Africa - Year-over-year growth 2023-2028 (%)
- Exhibits85: Chart on US - Market size and forecast 2023-2028 ($ million)
- Exhibits86: Data Table on US - Market size and forecast 2023-2028 ($ million)
- Exhibits87: Chart on US - Year-over-year growth 2023-2028 (%)
- Exhibits88: Data Table on US - Year-over-year growth 2023-2028 (%)
- Exhibits89: Chart on Germany - Market size and forecast 2023-2028 ($ million)
- Exhibits90: Data Table on Germany - Market size and forecast 2023-2028 ($ million)
- Exhibits91: Chart on Germany - Year-over-year growth 2023-2028 (%)
- Exhibits92: Data Table on Germany - Year-over-year growth 2023-2028 (%)
- Exhibits93: Chart on China - Market size and forecast 2023-2028 ($ million)
- Exhibits94: Data Table on China - Market size and forecast 2023-2028 ($ million)
- Exhibits95: Chart on China - Year-over-year growth 2023-2028 (%)
- Exhibits96: Data Table on China - Year-over-year growth 2023-2028 (%)
- Exhibits97: Chart on UK - Market size and forecast 2023-2028 ($ million)
- Exhibits98: Data Table on UK - Market size and forecast 2023-2028 ($ million)
- Exhibits99: Chart on UK - Year-over-year growth 2023-2028 (%)
- Exhibits100: Data Table on UK - Year-over-year growth 2023-2028 (%)
- Exhibits101: Chart on Canada - Market size and forecast 2023-2028 ($ million)
- Exhibits102: Data Table on Canada - Market size and forecast 2023-2028 ($ million)
- Exhibits103: Chart on Canada - Year-over-year growth 2023-2028 (%)
- Exhibits104: Data Table on Canada - Year-over-year growth 2023-2028 (%)
- Exhibits105: Market opportunity By Geographical Landscape ($ million)
- Exhibits106: Data Tables on Market opportunity By Geographical Landscape ($ million)
- Exhibits107: Impact of drivers and challenges in 2023 and 2028
- Exhibits108: Overview on criticality of inputs and factors of differentiation
- Exhibits109: Overview on factors of disruption
- Exhibits110: Impact of key risks on business
- Exhibits111: Companies covered
- Exhibits112: Matrix on companies position and classification
- Exhibits113: AGCO Corp. - Overview
- Exhibits114: AGCO Corp. - Business segments
- Exhibits115: AGCO Corp. - Key news
- Exhibits116: AGCO Corp. - Key offerings
- Exhibits117: AGCO Corp. - Segment focus
- Exhibits118: Bucher Industries AG - Overview
- Exhibits119: Bucher Industries AG - Business segments
- Exhibits120: Bucher Industries AG - Key offerings
- Exhibits121: Bucher Industries AG - Segment focus
- Exhibits122: CHANGFA - Overview
- Exhibits123: CHANGFA - Product / Service
- Exhibits124: CHANGFA - Key offerings
- Exhibits125: Changzhou Dongfeng Agricultural Machinery Group Co. Ltd. - Overview
- Exhibits126: Changzhou Dongfeng Agricultural Machinery Group Co. Ltd. - Product / Service
- Exhibits127: Changzhou Dongfeng Agricultural Machinery Group Co. Ltd. - Key offerings
- Exhibits128: China National Machinery Industry Corp. Ltd. - Overview
- Exhibits129: China National Machinery Industry Corp. Ltd. - Product / Service
- Exhibits130: China National Machinery Industry Corp. Ltd. - Key offerings
- Exhibits131: CLAAS KGaA mBH - Overview
- Exhibits132: CLAAS KGaA mBH - Product / Service
- Exhibits133: CLAAS KGaA mBH - Key news
- Exhibits134: CLAAS KGaA mBH - Key offerings
- Exhibits135: CNH Industrial NV - Overview
- Exhibits136: CNH Industrial NV - Business segments
- Exhibits137: CNH Industrial NV - Key offerings
- Exhibits138: CNH Industrial NV - Segment focus
- Exhibits139: Daedong Corp. - Overview
- Exhibits140: Daedong Corp. - Product / Service
- Exhibits141: Daedong Corp. - Key news
- Exhibits142: Daedong Corp. - Key offerings
- Exhibits143: Deere and Co. - Overview
- Exhibits144: Deere and Co. - Business segments
- Exhibits145: Deere and Co. - Key news
- Exhibits146: Deere and Co. - Key offerings
- Exhibits147: Deere and Co. - Segment focus
- Exhibits148: ISEKI and Co. Ltd. - Overview
- Exhibits149: ISEKI and Co. Ltd. - Product / Service
- Exhibits150: ISEKI and Co. Ltd. - Key offerings
- Exhibits151: J C Bamford Excavators Ltd. - Overview
- Exhibits152: J C Bamford Excavators Ltd. - Product / Service
- Exhibits153: J C Bamford Excavators Ltd. - Key offerings
- Exhibits154: Kubota Corp. - Overview
- Exhibits155: Kubota Corp. - Business segments
- Exhibits156: Kubota Corp. - Key news
- Exhibits157: Kubota Corp. - Key offerings
- Exhibits158: Kubota Corp. - Segment focus
- Exhibits159: Mahindra and Mahindra Ltd. - Overview
- Exhibits160: Mahindra and Mahindra Ltd. - Business segments
- Exhibits161: Mahindra and Mahindra Ltd. - Key news
- Exhibits162: Mahindra and Mahindra Ltd. - Key offerings
- Exhibits163: Mahindra and Mahindra Ltd. - Segment focus
- Exhibits164: SDF SpA - Overview
- Exhibits165: SDF SpA - Product / Service
- Exhibits166: SDF SpA - Key offerings
- Exhibits167: Sonalika International Tractors Ltd. - Overview
- Exhibits168: Sonalika International Tractors Ltd. - Product / Service
- Exhibits169: Sonalika International Tractors Ltd. - Key offerings
- Exhibits170: Inclusions checklist
- Exhibits171: Exclusions checklist
- Exhibits172: Currency conversion rates for US$
- Exhibits173: Research methodology
- Exhibits174: Information sources
- Exhibits175: Data validation
- Exhibits176: Validation techniques employed for market sizing
- Exhibits177: Data synthesis
- Exhibits178: 360 degree market analysis
- Exhibits179: List of abbreviations
The agricultural harvester market is forecasted to grow by USD 25373.6 mn during 2023-2028, accelerating at a CAGR of 8.39% during the forecast period. The report on the agricultural harvester market provides a holistic analysis, market size and forecast, trends, growth drivers, and challenges, as well as vendor analysis covering around 25 vendors.
The report offers an up-to-date analysis regarding the current market scenario, the latest trends and drivers, and the overall market environment. The market is driven by farm labor shortage in agriculture sector, government initiatives to support harvesting mechanization, and benefits of and technological advancements in agricultural harvesters.
Technavio's agricultural harvester market is segmented as below:
| Market Scope | |
|---|---|
| Base Year | 2024 |
| End Year | 2028 |
| Series Year | 2024-2028 |
| Growth Momentum | Accelerate |
| YOY 2024 | 7.74% |
| CAGR | 8.39% |
| Incremental Value | $25373.6mn |
ByProduct
- Combine harvesters
- Forage harvesters
ByType
- Four-wheel drive harvesters
- Two-wheel drive harvesters
ByGeography
- Europe
- North America
- APAC
- South America
- Middle East and Africa
This study identifies the growth in popularity of self-propelled forage harvesters with 3D cameras as one of the prime reasons driving the agricultural harvester market growth during the next few years. Also, increase in demand for high-performance engines and rise in preference for self-cleaning sugarcane harvesters will lead to sizable demand in the market.
The report on the agricultural harvester market covers the following areas:
- Agricultural harvester market sizing
- Agricultural harvester market forecast
- Agricultural harvester market industry analysis
The robust vendor analysis is designed to help clients improve their market position, and in line with this, this report provides a detailed analysis of several leading agricultural harvester market vendors that include AGCO Corp., Bernard KRONE Holding SE and Co. KG, Bucher Industries AG, CHANGFA, Changzhou Dongfeng Agricultural Machinery Group Co. Ltd., China National Machinery Industry Corp. Ltd., CLAAS KGaA mBH, CNH Industrial NV, Daedong Corp., Deere and Co., HORSCH Maschinen GmbH, ISEKI and Co. Ltd., J C Bamford Excavators Ltd., Kubota Corp., Mahindra and Mahindra Ltd., SDF SpA, Sonalika International Tractors Ltd., Tractors and Farm Equipment Ltd., Weichei Lovol Heavy Industry Co. Ltd., and Yanmar Holdings Co. Ltd.. Also, the agricultural harvester market analysis report includes information on upcoming trends and challenges that will influence market growth. This is to help companies strategize and leverage all forthcoming growth opportunities.
The study was conducted using an objective combination of primary and secondary information including inputs from key participants in the industry. The report contains a comprehensive market and vendor landscape in addition to an analysis of the key vendors.
The publisher presents a detailed picture of the market by the way of study, synthesis, and summation of data from multiple sources by an analysis of key parameters such as profit, pricing, competition, and promotions. It presents various market facets by identifying the key industry influencers. The data presented is comprehensive, reliable, and a result of extensive research - both primary and secondary. The market research reports provide a complete competitive landscape and an in-depth vendor selection methodology and analysis using qualitative and quantitative research to forecast the accurate market growth.
Table of Contents
1 Executive Summary
- 1.1 Market overview
- Executive Summary - Chart on Market Overview
- Executive Summary - Data Table on Market Overview
- Executive Summary - Chart on Global Market Characteristics
- Executive Summary - Chart on Market By Geographical Landscape
- Executive Summary - Chart on Market Segmentation by Product
- Executive Summary - Chart on Market Segmentation by Type
- Executive Summary - Chart on Incremental Growth
- Executive Summary - Data Table on Incremental Growth
- Executive Summary - Chart on Company Market Positioning
2 Market Landscape
- 2.1 Market ecosystem
- Parent Market
- Data Table on - Parent Market
- 2.2 Market characteristics
- Market characteristics analysis
- 2.3 Value chain analysis
- Value Chain Analysis
3 Market Sizing
- 3.1 Market definition
- Offerings of companies included in the market definition
- 3.2 Market segment analysis
- Market segments
- 3.3 Market size 2023
- 3.4 Market outlook: Forecast for 2023-2028
- Chart on Global - Market size and forecast 2023-2028 ($ million)
- Data Table on Global - Market size and forecast 2023-2028 ($ million)
- Chart on Global Market: Year-over-year growth 2023-2028 (%)
- Data Table on Global Market: Year-over-year growth 2023-2028 (%)
4 Historic Market Size
- 4.1 Global Agricultural Harvester Market 2018 - 2022
- Historic Market Size - Data Table on Global Agricultural Harvester Market 2018 - 2022 ($ million)
- 4.2 Product segment analysis 2018 - 2022
- Historic Market Size - Product Segment 2018 - 2022 ($ million)
- 4.3 Type segment analysis 2018 - 2022
- Historic Market Size - Type Segment 2018 - 2022 ($ million)
- 4.4 Geography segment analysis 2018 - 2022
- Historic Market Size - Geography Segment 2018 - 2022 ($ million)
- 4.5 Country segment analysis 2018 - 2022
- Historic Market Size - Country Segment 2018 - 2022 ($ million)
5 Five Forces Analysis
- 5.1 Five forces summary
- Five forces analysis - Comparison between 2023 and 2028
- 5.2 Bargaining power of buyers
- Bargaining power of buyers - Impact of key factors 2023 and 2028
- 5.3 Bargaining power of suppliers
- Bargaining power of suppliers - Impact of key factors in 2023 and 2028
- 5.4 Threat of new entrants
- Threat of new entrants - Impact of key factors in 2023 and 2028
- 5.5 Threat of substitutes
- Threat of substitutes - Impact of key factors in 2023 and 2028
- 5.6 Threat of rivalry
- Threat of rivalry - Impact of key factors in 2023 and 2028
- 5.7 Market condition
- Chart on Market condition - Five forces 2023 and 2028
6 Market Segmentation by Product
- 6.1 Market segments
- Chart on Product - Market share 2023-2028 (%)
- Data Table on Product - Market share 2023-2028 (%)
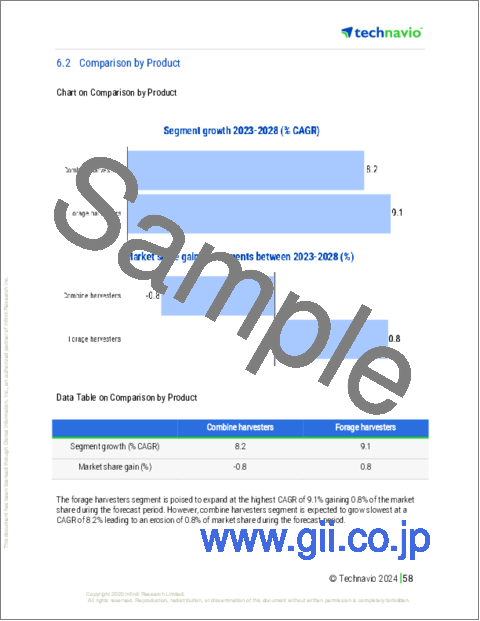
- 6.2 Comparison by Product
- Chart on Comparison by Product
- Data Table on Comparison by Product
- 6.3 Combine harvesters - Market size and forecast 2023-2028
- Chart on Combine harvesters - Market size and forecast 2023-2028 ($ million)
- Data Table on Combine harvesters - Market size and forecast 2023-2028 ($ million)
- Chart on Combine harvesters - Year-over-year growth 2023-2028 (%)
- Data Table on Combine harvesters - Year-over-year growth 2023-2028 (%)
- 6.4 Forage harvesters - Market size and forecast 2023-2028
- Chart on Forage harvesters - Market size and forecast 2023-2028 ($ million)
- Data Table on Forage harvesters - Market size and forecast 2023-2028 ($ million)
- Chart on Forage harvesters - Year-over-year growth 2023-2028 (%)
- Data Table on Forage harvesters - Year-over-year growth 2023-2028 (%)
- 6.5 Market opportunity by Product
- Market opportunity by Product ($ million)
- Data Table on Market opportunity by Product ($ million)
7 Market Segmentation by Type
- 7.1 Market segments
- Chart on Type - Market share 2023-2028 (%)
- Data Table on Type - Market share 2023-2028 (%)
- 7.2 Comparison by Type
- Chart on Comparison by Type
- Data Table on Comparison by Type
- 7.3 Four-wheel drive harvesters - Market size and forecast 2023-2028
- Chart on Four-wheel drive harvesters - Market size and forecast 2023-2028 ($ million)
- Data Table on Four-wheel drive harvesters - Market size and forecast 2023-2028 ($ million)
- Chart on Four-wheel drive harvesters - Year-over-year growth 2023-2028 (%)
- Data Table on Four-wheel drive harvesters - Year-over-year growth 2023-2028 (%)
- 7.4 Two-wheel drive harvesters - Market size and forecast 2023-2028
- Chart on Two-wheel drive harvesters - Market size and forecast 2023-2028 ($ million)
- Data Table on Two-wheel drive harvesters - Market size and forecast 2023-2028 ($ million)
- Chart on Two-wheel drive harvesters - Year-over-year growth 2023-2028 (%)
- Data Table on Two-wheel drive harvesters - Year-over-year growth 2023-2028 (%)
- 7.5 Market opportunity by Type
- Market opportunity by Type ($ million)
- Data Table on Market opportunity by Type ($ million)
8 Customer Landscape
- 8.1 Customer landscape overview
- Analysis of price sensitivity, lifecycle, customer purchase basket, adoption rates, and purchase criteria
9 Geographic Landscape
- 9.1 Geographic segmentation
- Chart on Market share By Geographical Landscape 2023-2028 (%)
- Data Table on Market share By Geographical Landscape 2023-2028 (%)
- 9.2 Geographic comparison
- Chart on Geographic comparison
- Data Table on Geographic comparison
- 9.3 Europe - Market size and forecast 2023-2028
- Chart on Europe - Market size and forecast 2023-2028 ($ million)
- Data Table on Europe - Market size and forecast 2023-2028 ($ million)
- Chart on Europe - Year-over-year growth 2023-2028 (%)
- Data Table on Europe - Year-over-year growth 2023-2028 (%)
- 9.4 North America - Market size and forecast 2023-2028
- Chart on North America - Market size and forecast 2023-2028 ($ million)
- Data Table on North America - Market size and forecast 2023-2028 ($ million)
- Chart on North America - Year-over-year growth 2023-2028 (%)
- Data Table on North America - Year-over-year growth 2023-2028 (%)
- 9.5 APAC - Market size and forecast 2023-2028
- Chart on APAC - Market size and forecast 2023-2028 ($ million)
- Data Table on APAC - Market size and forecast 2023-2028 ($ million)
- Chart on APAC - Year-over-year growth 2023-2028 (%)
- Data Table on APAC - Year-over-year growth 2023-2028 (%)
- 9.6 South America - Market size and forecast 2023-2028
- Chart on South America - Market size and forecast 2023-2028 ($ million)
- Data Table on South America - Market size and forecast 2023-2028 ($ million)
- Chart on South America - Year-over-year growth 2023-2028 (%)
- Data Table on South America - Year-over-year growth 2023-2028 (%)
- 9.7 Middle East and Africa - Market size and forecast 2023-2028
- Chart on Middle East and Africa - Market size and forecast 2023-2028 ($ million)
- Data Table on Middle East and Africa - Market size and forecast 2023-2028 ($ million)
- Chart on Middle East and Africa - Year-over-year growth 2023-2028 (%)
- Data Table on Middle East and Africa - Year-over-year growth 2023-2028 (%)
- 9.8 US - Market size and forecast 2023-2028
- Chart on US - Market size and forecast 2023-2028 ($ million)
- Data Table on US - Market size and forecast 2023-2028 ($ million)
- Chart on US - Year-over-year growth 2023-2028 (%)
- Data Table on US - Year-over-year growth 2023-2028 (%)
- 9.9 Germany - Market size and forecast 2023-2028
- Chart on Germany - Market size and forecast 2023-2028 ($ million)
- Data Table on Germany - Market size and forecast 2023-2028 ($ million)
- Chart on Germany - Year-over-year growth 2023-2028 (%)
- Data Table on Germany - Year-over-year growth 2023-2028 (%)
- 9.10 China - Market size and forecast 2023-2028
- Chart on China - Market size and forecast 2023-2028 ($ million)
- Data Table on China - Market size and forecast 2023-2028 ($ million)
- Chart on China - Year-over-year growth 2023-2028 (%)
- Data Table on China - Year-over-year growth 2023-2028 (%)
- 9.11 UK - Market size and forecast 2023-2028
- Chart on UK - Market size and forecast 2023-2028 ($ million)
- Data Table on UK - Market size and forecast 2023-2028 ($ million)
- Chart on UK - Year-over-year growth 2023-2028 (%)
- Data Table on UK - Year-over-year growth 2023-2028 (%)
- 9.12 Canada - Market size and forecast 2023-2028
- Chart on Canada - Market size and forecast 2023-2028 ($ million)
- Data Table on Canada - Market size and forecast 2023-2028 ($ million)
- Chart on Canada - Year-over-year growth 2023-2028 (%)
- Data Table on Canada - Year-over-year growth 2023-2028 (%)
- 9.13 Market opportunity By Geographical Landscape
- Market opportunity By Geographical Landscape ($ million)
- Data Tables on Market opportunity By Geographical Landscape ($ million)
10 Drivers, Challenges, and Opportunity/Restraints
- 10.1 Market drivers
- 10.2 Market challenges
- 10.3 Impact of drivers and challenges
- Impact of drivers and challenges in 2023 and 2028
- 10.4 Market opportunities/restraints
11 Competitive Landscape
- 11.1 Overview
- 11.2 Competitive Landscape
- Overview on criticality of inputs and factors of differentiation
- 11.3 Landscape disruption
- Overview on factors of disruption
- 11.4 Industry risks
- Impact of key risks on business
12 Competitive Analysis
- 12.1 Companies profiled
- Companies covered
- 12.2 Market positioning of companies
- Matrix on companies position and classification
- 12.3 AGCO Corp.
- AGCO Corp. - Overview
- AGCO Corp. - Business segments
- AGCO Corp. - Key news
- AGCO Corp. - Key offerings
- AGCO Corp. - Segment focus
- 12.4 Bucher Industries AG
- Bucher Industries AG - Overview
- Bucher Industries AG - Business segments
- Bucher Industries AG - Key offerings
- Bucher Industries AG - Segment focus
- 12.5 CHANGFA
- CHANGFA - Overview
- CHANGFA - Product / Service
- CHANGFA - Key offerings
- 12.6 Changzhou Dongfeng Agricultural Machinery Group Co. Ltd.
- Changzhou Dongfeng Agricultural Machinery Group Co. Ltd. - Overview
- Changzhou Dongfeng Agricultural Machinery Group Co. Ltd. - Product / Service
- Changzhou Dongfeng Agricultural Machinery Group Co. Ltd. - Key offerings
- 12.7 China National Machinery Industry Corp. Ltd.
- China National Machinery Industry Corp. Ltd. - Overview
- China National Machinery Industry Corp. Ltd. - Product / Service
- China National Machinery Industry Corp. Ltd. - Key offerings
- 12.8 CLAAS KGaA mBH
- CLAAS KGaA mBH - Overview
- CLAAS KGaA mBH - Product / Service
- CLAAS KGaA mBH - Key news
- CLAAS KGaA mBH - Key offerings
- 12.9 CNH Industrial NV
- CNH Industrial NV - Overview
- CNH Industrial NV - Business segments
- CNH Industrial NV - Key offerings
- CNH Industrial NV - Segment focus
- 12.10 Daedong Corp.
- Daedong Corp. - Overview
- Daedong Corp. - Product / Service
- Daedong Corp. - Key news
- Daedong Corp. - Key offerings
- 12.11 Deere and Co.
- Deere and Co. - Overview
- Deere and Co. - Business segments
- Deere and Co. - Key news
- Deere and Co. - Key offerings
- Deere and Co. - Segment focus
- 12.12 ISEKI and Co. Ltd.
- ISEKI and Co. Ltd. - Overview
- ISEKI and Co. Ltd. - Product / Service
- ISEKI and Co. Ltd. - Key offerings
- 12.13 J C Bamford Excavators Ltd.
- J C Bamford Excavators Ltd. - Overview
- J C Bamford Excavators Ltd. - Product / Service
- J C Bamford Excavators Ltd. - Key offerings
- 12.14 Kubota Corp.
- Kubota Corp. - Overview
- Kubota Corp. - Business segments
- Kubota Corp. - Key news
- Kubota Corp. - Key offerings
- Kubota Corp. - Segment focus
- 12.15 Mahindra and Mahindra Ltd.
- Mahindra and Mahindra Ltd. - Overview
- Mahindra and Mahindra Ltd. - Business segments
- Mahindra and Mahindra Ltd. - Key news
- Mahindra and Mahindra Ltd. - Key offerings
- Mahindra and Mahindra Ltd. - Segment focus
- 12.16 SDF SpA
- SDF SpA - Overview
- SDF SpA - Product / Service
- SDF SpA - Key offerings
- 12.17 Sonalika International Tractors Ltd.
- Sonalika International Tractors Ltd. - Overview
- Sonalika International Tractors Ltd. - Product / Service
- Sonalika International Tractors Ltd. - Key offerings
13 Appendix
- 13.1 Scope of the report
- 13.2 Inclusions and exclusions checklist
- Inclusions checklist
- Exclusions checklist
- 13.3 Currency conversion rates for US$
- Currency conversion rates for US$
- 13.4 Research methodology
- Research methodology
- 13.5 Data procurement
- Information sources
- 13.6 Data validation
- Data validation
- 13.7 Validation techniques employed for market sizing
- Validation techniques employed for market sizing
- 13.8 Data synthesis
- Data synthesis
- 13.9 360 degree market analysis
- 360 degree market analysis
- 13.10 List of abbreviations
- List of abbreviations

