|
|
市場調査レポート
商品コード
1652860
急性呼吸窮迫症候群(ARDS)治療の世界市場(2025年~2029年)Global Acute Respiratory Distress Syndrome Treatment Market 2025-2029 |
||||||

|
|||||||
カスタマイズ可能
|
|||||||


| 急性呼吸窮迫症候群(ARDS)治療の世界市場(2025年~2029年) |
|
出版日: 2025年01月24日
発行: TechNavio
ページ情報: 英文 193 Pages
納期: 即納可能
|

全表示
- 概要
- 目次
世界の急性呼吸窮迫症候群(ARDS)治療の市場規模は、2024年~2029年に12億9,540万米ドルに達し、予測期間中のCAGRは6.9%で成長すると予測されます。
当レポートでは、急性呼吸窮迫症候群(ARDS)治療市場の全体的な分析、市場規模・予測、動向、成長促進要因、課題、約25のベンダーを網羅したベンダー分析などを掲載しています。
当レポートは、現在の市場シナリオ、最新動向と促進要因、市場環境全体に関する最新分析を提供しています。市場は、肺保護換気戦略への注目の高まり、精密医療とバイオマーカー研究の進歩、ECMO療法の利用増加などが牽引しています。
| 市場範囲 | |
|---|---|
| 基準年 | 2025年 |
| 終了年 | 2029年 |
| 予測期間 | 2025年~2029年 |
| 成長モメンタム | 加速 |
| 前年比2025年 | 6.3% |
| CAGR | 6.9% |
| 増分額 | 12億9,540万米ドル |
本調査では、今後数年間における急性呼吸窮迫症候群(ARDS)治療市場の成長を牽引する主な要因の一つとして、ARDSに対する免疫調節療法への関心の高まりを挙げています。また、ARDS治療薬のドラッグリポジショニング戦略の台頭や、ARDSにおける多剤併用療法に対する認識の高まりも、市場の大きな需要につながると思われます。
目次
第1章 エグゼクティブサマリー
- 市場概要
第2章 Technavioの分析
- 価格感度・ライフサイクル・顧客購入バスケット・採用率・購入基準の分析
- インプットの重要性と差別化の要因
- ディスラプションの要因
- 促進要因と課題の影響
第3章 市場情勢
- 市場エコシステム
- 市場の特徴
- バリューチェーン分析
第4章 市場規模
- 市場の定義
- 市場セグメント分析
- 市場規模(2024年)
- 市場の見通し(2024年~2029年)
第5章 市場規模実績
- 急性呼吸窮迫症候群(ARDS)治療の世界市場(2019年~2023年)
- 流通チャネルセグメント分析(2019年~2023年)
- 投与経路セグメント分析(2019年~2023年)
- 地域セグメント分析(2019年~2023年)
- 国セグメント分析(2019年~2023年)
第6章 定性分析
- AIの影響:急性呼吸窮迫症候群(ARDS)治療の世界市場
第7章 ファイブフォース分析
- ファイブフォースの要約
- 買い手の交渉力
- 供給企業の交渉力
- 新規参入業者の脅威
- 代替品の脅威
- 競争の脅威
- 市況
第8章 市場セグメンテーション:流通チャネル別
- 市場セグメント
- 比較:流通チャネル別
- 院内薬局:市場規模と予測(2024年~2029年)
- 小売薬局:市場規模と予測(2024年~2029年)
- オンライン薬局:市場規模と予測(2024年~2029年)
- 市場機会:流通チャネル別
第9章 市場セグメンテーション:投与経路別
- 市場セグメント
- 比較:投与経路別
- 経口:市場規模と予測(2024年~2029年)
- 注射:市場規模と予測(2024年~2029年)
- 吸入:市場規模と予測(2024年~2029年)
- 市場機会:投与経路別
第10章 顧客情勢
- 顧客情勢の概要
第11章 地域別情勢
- 地域別セグメンテーション
- 地域別比較
- 北米:市場規模と予測(2024年~2029年)
- 欧州:市場規模と予測(2024年~2029年)
- アジア:市場規模と予測(2024年~2029年)
- 世界のその他の地域:市場規模と予測(2024年~2029年)
- 米国:市場規模と予測(2024年~2029年)
- カナダ:市場規模と予測(2024年~2029年)
- ドイツ:市場規模と予測(2024年~2029年)
- 中国:市場規模と予測(2024年~2029年)
- フランス:市場規模と予測(2024年~2029年)
- 日本:市場規模と予測(2024年~2029年)
- 英国:市場規模と予測(2024年~2029年)
- イタリア:市場規模と予測(2024年~2029年)
- インド:市場規模と予測(2024年~2029年)
- 韓国:市場規模と予測(2024年~2029年)
- 市場機会:地域情勢別
第12章 促進要因・課題・機会・抑制要因
- 市場促進要因
- 市場の課題
- 促進要因と課題の影響
- 市場の機会・抑制要因
第13章 競合情勢
- 概要
- 競合情勢
- ディスラプションの状況
- 業界のリスク
第14章 競合分析
- 企業プロファイル
- 企業ランキング指数
- 企業の市場ポジショニング
- APEPTICO Forschung and Entwicklung GmbH
- Athersys Inc.
- Dragerwerk AG and Co. KGaA
- Edesa Biotech Inc.
- Fisher and Paykel Healthcare Corp. Ltd.
- GE Healthcare Technologies Inc.
- Getinge AB
- Hamilton Medical AG
- Koninklijke Philips NV
- LivaNova PLC
- Medtronic Plc
- Nihon Kohden Corp.
- ResMed Inc.
- Smiths Group Plc
- Vyaire Medical Inc.
第15章 付録
The acute respiratory distress syndrome treatment market is forecasted to grow by USD 1295.4 mn during 2024-2029, accelerating at a CAGR of 6.9% during the forecast period. The report on the acute respiratory distress syndrome treatment market provides a holistic analysis, market size and forecast, trends, growth drivers, and challenges, as well as vendor analysis covering around 25 vendors.
The report offers an up-to-date analysis regarding the current market scenario, the latest trends and drivers, and the overall market environment. The market is driven by growing focus on lung-protective ventilation strategies, advances in precision medicine and biomarker research, and increasing utilization of ecmo therapy.
| Market Scope | |
|---|---|
| Base Year | 2025 |
| End Year | 2029 |
| Series Year | 2025-2029 |
| Growth Momentum | Accelerate |
| YOY 2025 | 6.3% |
| CAGR | 6.9% |
| Incremental Value | $1295.4 mn |
Technavio's acute respiratory distress syndrome treatment market is segmented as below:
By Distribution Channel
- Hospitals pharmacies
- Retail pharmacies
- Online pharmacies
By Route Of Administration
- Oral
- Injection
- Inhalation
By Geographical Landscape
- North America
- Europe
- Asia
- Rest of World (ROW)
This study identifies the growing interest in immunomodulatory therapies for ards as one of the prime reasons driving the acute respiratory distress syndrome treatment market growth during the next few years. Also, emergence of ards drug repurposing strategies and increasing recognition of multimodal supportive care for ards will lead to sizable demand in the market.
The report on the acute respiratory distress syndrome treatment market covers the following areas:
- Acute Respiratory Distress Syndrome Treatment Market sizing
- Acute Respiratory Distress Syndrome Treatment Market forecast
- Acute Respiratory Distress Syndrome Treatment Market industry analysis
The robust vendor analysis is designed to help clients improve their market position, and in line with this, this report provides a detailed analysis of several leading acute respiratory distress syndrome treatment market vendors that include Air Liquide SA, APEPTICO Forschung and Entwicklung GmbH, Athersys Inc., Boston Scientific Corp., Dragerwerk AG and Co. KGaA, Edesa Biotech Inc., Fisher and Paykel Healthcare Corp. Ltd., GE Healthcare Technologies Inc., Getinge AB, Hamilton Medical AG, Koninklijke Philips NV, LivaNova PLC, Medtronic Plc, Nihon Kohden Corp., ResMed Inc., SCHILLER AG, Sleepnet Corp., Smiths Group Plc, Stryker Corp., and Vyaire Medical Inc.. Also, the acute respiratory distress syndrome treatment market analysis report includes information on upcoming trends and challenges that will influence market growth. This is to help companies strategize and leverage all forthcoming growth opportunities.
The study was conducted using an objective combination of primary and secondary information including inputs from key participants in the industry. The report contains a comprehensive market and vendor landscape in addition to an analysis of the key vendors.
The publisher presents a detailed picture of the market by the way of study, synthesis, and summation of data from multiple sources by an analysis of key parameters such as profit, pricing, competition, and promotions. It presents various market facets by identifying the key industry influencers. The data presented is comprehensive, reliable, and a result of extensive primary and secondary research. The market research reports provide a complete competitive landscape and an in-depth vendor selection methodology and analysis using qualitative and quantitative research to forecast accurate market growth.
Table of Contents
1 Executive Summary
- 1.1 Market overview
- Executive Summary - Chart on Market Overview
- Executive Summary - Data Table on Market Overview
- Executive Summary - Chart on Global Market Characteristics
- Executive Summary - Chart on Market By Geographical Landscape
- Executive Summary - Chart on Market Segmentation by Distribution Channel
- Executive Summary - Chart on Market Segmentation by Route of Administration
- Executive Summary - Chart on Incremental Growth
- Executive Summary - Data Table on Incremental Growth
- Executive Summary - Chart on Company Market Positioning
2 Technavio Analysis
- 2.1 Analysis of price sensitivity, lifecycle, customer purchase basket, adoption rates, and purchase criteria
- Analysis of price sensitivity, lifecycle, customer purchase basket, adoption rates, and purchase criteria
- 2.2 Criticality of inputs and Factors of differentiation
- Overview on criticality of inputs and factors of differentiation
- 2.3 Factors of disruption
- Overview on factors of disruption
- 2.4 Impact of drivers and challenges
- Impact of drivers and challenges in 2024 and 2029
3 Market Landscape
- 3.1 Market ecosystem
- Parent Market
- Data Table on - Parent Market
- 3.2 Market characteristics
- Market characteristics analysis
- 3.3 Value chain analysis
- Value chain analysis
4 Market Sizing
- 4.1 Market definition
- Offerings of companies included in the market definition
- 4.2 Market segment analysis
- Market segments
- 4.3 Market size 2024
- 4.4 Market outlook: Forecast for 2024-2029
- Chart on Global - Market size and forecast 2024-2029 ($ million)
- Data Table on Global - Market size and forecast 2024-2029 ($ million)
- Chart on Global Market: Year-over-year growth 2024-2029 (%)
- Data Table on Global Market: Year-over-year growth 2024-2029 (%)
5 Historic Market Size
- 5.1 Global Acute Respiratory Distress Syndrome Treatment Market 2019 - 2023
- Historic Market Size - Data Table on Global Acute Respiratory Distress Syndrome Treatment Market 2019 - 2023 ($ million)
- 5.2 Distribution Channel segment analysis 2019 - 2023
- Historic Market Size - Distribution Channel Segment 2019 - 2023 ($ million)
- 5.3 Route of Administration segment analysis 2019 - 2023
- Historic Market Size - Route of Administration Segment 2019 - 2023 ($ million)
- 5.4 Geography segment analysis 2019 - 2023
- Historic Market Size - Geography Segment 2019 - 2023 ($ million)
- 5.5 Country segment analysis 2019 - 2023
- Historic Market Size - Country Segment 2019 - 2023 ($ million)
6 Qualitative Analysis
- 6.1 Impact of AI in the Global Acute Respiratory Distress Syndrome Treatment Market
7 Five Forces Analysis
- 7.1 Five forces summary
- Five forces analysis - Comparison between 2024 and 2029
- 7.2 Bargaining power of buyers
- Bargaining power of buyers - Impact of key factors 2024 and 2029
- 7.3 Bargaining power of suppliers
- Bargaining power of suppliers - Impact of key factors in 2024 and 2029
- 7.4 Threat of new entrants
- Threat of new entrants - Impact of key factors in 2024 and 2029
- 7.5 Threat of substitutes
- Threat of substitutes - Impact of key factors in 2024 and 2029
- 7.6 Threat of rivalry
- Threat of rivalry - Impact of key factors in 2024 and 2029
- 7.7 Market condition
- Chart on Market condition - Five forces 2024 and 2029
8 Market Segmentation by Distribution Channel
- 8.1 Market segments
- Chart on Distribution Channel - Market share 2024-2029 (%)
- Data Table on Distribution Channel - Market share 2024-2029 (%)
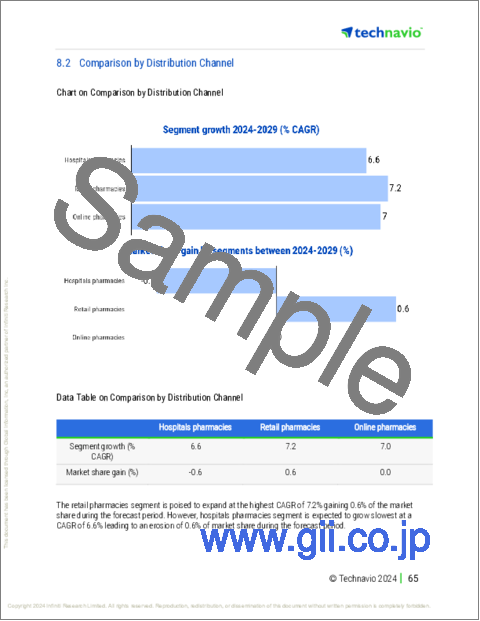
- 8.2 Comparison by Distribution Channel
- Chart on Comparison by Distribution Channel
- Data Table on Comparison by Distribution Channel
- 8.3 Hospitals pharmacies - Market size and forecast 2024-2029
- Chart on Hospitals pharmacies - Market size and forecast 2024-2029 ($ million)
- Data Table on Hospitals pharmacies - Market size and forecast 2024-2029 ($ million)
- Chart on Hospitals pharmacies - Year-over-year growth 2024-2029 (%)
- Data Table on Hospitals pharmacies - Year-over-year growth 2024-2029 (%)
- 8.4 Retail pharmacies - Market size and forecast 2024-2029
- Chart on Retail pharmacies - Market size and forecast 2024-2029 ($ million)
- Data Table on Retail pharmacies - Market size and forecast 2024-2029 ($ million)
- Chart on Retail pharmacies - Year-over-year growth 2024-2029 (%)
- Data Table on Retail pharmacies - Year-over-year growth 2024-2029 (%)
- 8.5 Online pharmacies - Market size and forecast 2024-2029
- Chart on Online pharmacies - Market size and forecast 2024-2029 ($ million)
- Data Table on Online pharmacies - Market size and forecast 2024-2029 ($ million)
- Chart on Online pharmacies - Year-over-year growth 2024-2029 (%)
- Data Table on Online pharmacies - Year-over-year growth 2024-2029 (%)
- 8.6 Market opportunity by Distribution Channel
- Market opportunity by Distribution Channel ($ million)
- Data Table on Market opportunity by Distribution Channel ($ million)
9 Market Segmentation by Route of Administration
- 9.1 Market segments
- Chart on Route of Administration - Market share 2024-2029 (%)
- Data Table on Route of Administration - Market share 2024-2029 (%)
- 9.2 Comparison by Route of Administration
- Chart on Comparison by Route of Administration
- Data Table on Comparison by Route of Administration
- 9.3 Oral - Market size and forecast 2024-2029
- Chart on Oral - Market size and forecast 2024-2029 ($ million)
- Data Table on Oral - Market size and forecast 2024-2029 ($ million)
- Chart on Oral - Year-over-year growth 2024-2029 (%)
- Data Table on Oral - Year-over-year growth 2024-2029 (%)
- 9.4 Injection - Market size and forecast 2024-2029
- Chart on Injection - Market size and forecast 2024-2029 ($ million)
- Data Table on Injection - Market size and forecast 2024-2029 ($ million)
- Chart on Injection - Year-over-year growth 2024-2029 (%)
- Data Table on Injection - Year-over-year growth 2024-2029 (%)
- 9.5 Inhalation - Market size and forecast 2024-2029
- Chart on Inhalation - Market size and forecast 2024-2029 ($ million)
- Data Table on Inhalation - Market size and forecast 2024-2029 ($ million)
- Chart on Inhalation - Year-over-year growth 2024-2029 (%)
- Data Table on Inhalation - Year-over-year growth 2024-2029 (%)
- 9.6 Market opportunity by Route of Administration
- Market opportunity by Route of Administration ($ million)
- Data Table on Market opportunity by Route of Administration ($ million)
10 Customer Landscape
- 10.1 Customer landscape overview
- Analysis of price sensitivity, lifecycle, customer purchase basket, adoption rates, and purchase criteria
11 Geographic Landscape
- 11.1 Geographic segmentation
- Chart on Market share By Geographical Landscape 2024-2029 (%)
- Data Table on Market share By Geographical Landscape 2024-2029 (%)
- 11.2 Geographic comparison
- Chart on Geographic comparison
- Data Table on Geographic comparison
- 11.3 North America - Market size and forecast 2024-2029
- Chart on North America - Market size and forecast 2024-2029 ($ million)
- Data Table on North America - Market size and forecast 2024-2029 ($ million)
- Chart on North America - Year-over-year growth 2024-2029 (%)
- Data Table on North America - Year-over-year growth 2024-2029 (%)
- 11.4 Europe - Market size and forecast 2024-2029
- Chart on Europe - Market size and forecast 2024-2029 ($ million)
- Data Table on Europe - Market size and forecast 2024-2029 ($ million)
- Chart on Europe - Year-over-year growth 2024-2029 (%)
- Data Table on Europe - Year-over-year growth 2024-2029 (%)
- 11.5 Asia - Market size and forecast 2024-2029
- Chart on Asia - Market size and forecast 2024-2029 ($ million)
- Data Table on Asia - Market size and forecast 2024-2029 ($ million)
- Chart on Asia - Year-over-year growth 2024-2029 (%)
- Data Table on Asia - Year-over-year growth 2024-2029 (%)
- 11.6 Rest of World (ROW) - Market size and forecast 2024-2029
- Chart on Rest of World (ROW) - Market size and forecast 2024-2029 ($ million)
- Data Table on Rest of World (ROW) - Market size and forecast 2024-2029 ($ million)
- Chart on Rest of World (ROW) - Year-over-year growth 2024-2029 (%)
- Data Table on Rest of World (ROW) - Year-over-year growth 2024-2029 (%)
- 11.7 US - Market size and forecast 2024-2029
- Chart on US - Market size and forecast 2024-2029 ($ million)
- Data Table on US - Market size and forecast 2024-2029 ($ million)
- Chart on US - Year-over-year growth 2024-2029 (%)
- Data Table on US - Year-over-year growth 2024-2029 (%)
- 11.8 Canada - Market size and forecast 2024-2029
- Chart on Canada - Market size and forecast 2024-2029 ($ million)
- Data Table on Canada - Market size and forecast 2024-2029 ($ million)
- Chart on Canada - Year-over-year growth 2024-2029 (%)
- Data Table on Canada - Year-over-year growth 2024-2029 (%)
- 11.9 Germany - Market size and forecast 2024-2029
- Chart on Germany - Market size and forecast 2024-2029 ($ million)
- Data Table on Germany - Market size and forecast 2024-2029 ($ million)
- Chart on Germany - Year-over-year growth 2024-2029 (%)
- Data Table on Germany - Year-over-year growth 2024-2029 (%)
- 11.10 China - Market size and forecast 2024-2029
- Chart on China - Market size and forecast 2024-2029 ($ million)
- Data Table on China - Market size and forecast 2024-2029 ($ million)
- Chart on China - Year-over-year growth 2024-2029 (%)
- Data Table on China - Year-over-year growth 2024-2029 (%)
- 11.11 France - Market size and forecast 2024-2029
- Chart on France - Market size and forecast 2024-2029 ($ million)
- Data Table on France - Market size and forecast 2024-2029 ($ million)
- Chart on France - Year-over-year growth 2024-2029 (%)
- Data Table on France - Year-over-year growth 2024-2029 (%)
- 11.12 Japan - Market size and forecast 2024-2029
- Chart on Japan - Market size and forecast 2024-2029 ($ million)
- Data Table on Japan - Market size and forecast 2024-2029 ($ million)
- Chart on Japan - Year-over-year growth 2024-2029 (%)
- Data Table on Japan - Year-over-year growth 2024-2029 (%)
- 11.13 UK - Market size and forecast 2024-2029
- Chart on UK - Market size and forecast 2024-2029 ($ million)
- Data Table on UK - Market size and forecast 2024-2029 ($ million)
- Chart on UK - Year-over-year growth 2024-2029 (%)
- Data Table on UK - Year-over-year growth 2024-2029 (%)
- 11.14 Italy - Market size and forecast 2024-2029
- Chart on Italy - Market size and forecast 2024-2029 ($ million)
- Data Table on Italy - Market size and forecast 2024-2029 ($ million)
- Chart on Italy - Year-over-year growth 2024-2029 (%)
- Data Table on Italy - Year-over-year growth 2024-2029 (%)
- 11.15 India - Market size and forecast 2024-2029
- Chart on India - Market size and forecast 2024-2029 ($ million)
- Data Table on India - Market size and forecast 2024-2029 ($ million)
- Chart on India - Year-over-year growth 2024-2029 (%)
- Data Table on India - Year-over-year growth 2024-2029 (%)
- 11.16 South Korea - Market size and forecast 2024-2029
- Chart on South Korea - Market size and forecast 2024-2029 ($ million)
- Data Table on South Korea - Market size and forecast 2024-2029 ($ million)
- Chart on South Korea - Year-over-year growth 2024-2029 (%)
- Data Table on South Korea - Year-over-year growth 2024-2029 (%)
- 11.17 Market opportunity By Geographical Landscape
- Market opportunity By Geographical Landscape ($ million)
- Data Tables on Market opportunity By Geographical Landscape ($ million)
12 Drivers, Challenges, and Opportunity/Restraints
- 12.1 Market drivers
- 12.2 Market challenges
- 12.3 Impact of drivers and challenges
- Impact of drivers and challenges in 2024 and 2029
- 12.4 Market opportunities/restraints
13 Competitive Landscape
- 13.1 Overview
- 13.2 Competitive Landscape
- Overview on criticality of inputs and factors of differentiation
- 13.3 Landscape disruption
- Overview on factors of disruption
- 13.4 Industry risks
- Impact of key risks on business
14 Competitive Analysis
- 14.1 Companies profiled
- Companies covered
- 14.2 Company ranking index
- Company ranking index
- 14.3 Market positioning of companies
- Matrix on companies position and classification
- 14.4 APEPTICO Forschung and Entwicklung GmbH
- APEPTICO Forschung and Entwicklung GmbH - Overview
- APEPTICO Forschung and Entwicklung GmbH - Product / Service
- APEPTICO Forschung and Entwicklung GmbH - Key offerings
- SWOT
- 14.5 Athersys Inc.
- Athersys Inc. - Overview
- Athersys Inc. - Product / Service
- Athersys Inc. - Key offerings
- SWOT
- 14.6 Dragerwerk AG and Co. KGaA
- Dragerwerk AG and Co. KGaA - Overview
- Dragerwerk AG and Co. KGaA - Business segments
- Dragerwerk AG and Co. KGaA - Key news
- Dragerwerk AG and Co. KGaA - Key offerings
- Dragerwerk AG and Co. KGaA - Segment focus
- SWOT
- 14.7 Edesa Biotech Inc.
- Edesa Biotech Inc. - Overview
- Edesa Biotech Inc. - Product / Service
- Edesa Biotech Inc. - Key offerings
- SWOT
- 14.8 Fisher and Paykel Healthcare Corp. Ltd.
- Fisher and Paykel Healthcare Corp. Ltd. - Overview
- Fisher and Paykel Healthcare Corp. Ltd. - Product / Service
- Fisher and Paykel Healthcare Corp. Ltd. - Key news
- Fisher and Paykel Healthcare Corp. Ltd. - Key offerings
- SWOT
- 14.9 GE Healthcare Technologies Inc.
- GE Healthcare Technologies Inc. - Overview
- GE Healthcare Technologies Inc. - Business segments
- GE Healthcare Technologies Inc. - Key news
- GE Healthcare Technologies Inc. - Key offerings
- GE Healthcare Technologies Inc. - Segment focus
- SWOT
- 14.10 Getinge AB
- Getinge AB - Overview
- Getinge AB - Business segments
- Getinge AB - Key news
- Getinge AB - Key offerings
- Getinge AB - Segment focus
- SWOT
- 14.11 Hamilton Medical AG
- Hamilton Medical AG - Overview
- Hamilton Medical AG - Product / Service
- Hamilton Medical AG - Key offerings
- SWOT
- 14.12 Koninklijke Philips NV
- Koninklijke Philips NV - Overview
- Koninklijke Philips NV - Business segments
- Koninklijke Philips NV - Key news
- Koninklijke Philips NV - Key offerings
- Koninklijke Philips NV - Segment focus
- SWOT
- 14.13 LivaNova PLC
- LivaNova PLC - Overview
- LivaNova PLC - Business segments
- LivaNova PLC - Key news
- LivaNova PLC - Key offerings
- LivaNova PLC - Segment focus
- SWOT
- 14.14 Medtronic Plc
- Medtronic Plc - Overview
- Medtronic Plc - Business segments
- Medtronic Plc - Key news
- Medtronic Plc - Key offerings
- Medtronic Plc - Segment focus
- SWOT
- 14.15 Nihon Kohden Corp.
- Nihon Kohden Corp. - Overview
- Nihon Kohden Corp. - Business segments
- Nihon Kohden Corp. - Key news
- Nihon Kohden Corp. - Key offerings
- Nihon Kohden Corp. - Segment focus
- SWOT
- 14.16 ResMed Inc.
- ResMed Inc. - Overview
- ResMed Inc. - Business segments
- ResMed Inc. - Key news
- ResMed Inc. - Key offerings
- ResMed Inc. - Segment focus
- SWOT
- 14.17 Smiths Group Plc
- Smiths Group Plc - Overview
- Smiths Group Plc - Business segments
- Smiths Group Plc - Key news
- Smiths Group Plc - Key offerings
- Smiths Group Plc - Segment focus
- SWOT
- 14.18 Vyaire Medical Inc.
- Vyaire Medical Inc. - Overview
- Vyaire Medical Inc. - Product / Service
- Vyaire Medical Inc. - Key offerings
- SWOT
15 Appendix
- 15.1 Scope of the report
- 15.2 Inclusions and exclusions checklist
- Inclusions checklist
- Exclusions checklist
- 15.3 Currency conversion rates for US$
- Currency conversion rates for US$
- 15.4 Research methodology
- Research methodology
- 15.5 Data procurement
- Information sources
- 15.6 Data validation
- Data validation
- 15.7 Validation techniques employed for market sizing
- Validation techniques employed for market sizing
- 15.8 Data synthesis
- Data synthesis
- 15.9 360 degree market analysis
- 360 degree market analysis
- 15.10 List of abbreviations
- List of abbreviations

