|
|
市場調査レポート
商品コード
1719433
自動・スマートペットフィーダーの世界市場 2025~2029年Global Automatic and Smart Pet Feeder Market 2025-2029 |
||||||
|
|||||||
カスタマイズ可能
|
|||||||


| 自動・スマートペットフィーダーの世界市場 2025~2029年 |
|
出版日: 2025年04月24日
発行: TechNavio
ページ情報: 英文 222 Pages
納期: 即納可能
|

全表示
- 概要
- 図表
- 目次
自動・スマートペットフィーダー市場は2024-2029年に22億320万米ドル、予測期間中のCAGRは14.8%で成長すると予測されます。
当レポートでは、自動・スマートペットフィーダー市場の全体的な分析、市場規模・予測、動向、成長促進要因、課題、約25のベンダーを網羅したベンダー分析などを掲載しています。
現在の市場シナリオ、最新動向と促進要因、市場環境全体に関する最新分析を提供しています。市場は、都市住民のライフスタイルパターンの変化や多忙な労働生活、オンライン小売による製品の知名度やアクセシビリティの上昇、効果的なブランディングのためのマルチチャネルマーケティング戦略の導入などによって牽引されています。
| 市場範囲 | |
|---|---|
| 基準年 | 2025 |
| 終了年 | 2029 |
| 予測期間 | 2025-2029 |
| 成長モメンタム | 加速 |
| 前年比2025年 | 11.8% |
| CAGR | 14.8% |
| 増分額 | 22億320万米ドル |
本調査は、業界の主要参加者からのインプットを含め、一次情報と二次情報を客観的に組み合わせて実施しました。本レポートには、主要企業の分析に加え、包括的な市場規模データ、地域分析によるセグメント、ベンダー情勢が含まれています。レポートには過去データと予測データがあります。
本調査では、今後数年間の自動・スマートペットフィーダー市場の成長を促進する主な要因の1つとして、スマートホームがスマートペットフィーダーの需要を増大させていることを挙げています。また、ペット用給餌器における餌の電子計量や、より良いコミュニケーションのための内蔵マイクと遠隔ビデオカメラの導入は、市場の大きな需要につながります。
目次
第1章 エグゼクティブサマリー
- 市場概要
第2章 Technavio分析
- 価格・ライフサイクル・顧客購入バスケット・採用率・購入基準の分析
- インプットの重要性と差別化の要因
- 混乱の要因
- 促進要因と課題の影響
第3章 市場情勢
- 市場エコシステム
- 市場の特徴
- バリューチェーン分析
第4章 市場規模
- 市場の定義
- 市場セグメント分析
- 市場規模 2024
- 市場の見通し 2024-2029
第5章 市場規模実績
- 自動・スマートペットフィーダーの世界市場 2019-2023
- 流通チャネル別セグメント分析 2019-2023
- タイプ別セグメント分析 2019-2023
- エンドユーザー別セグメント分析 2019-2023
- 価格別セグメント分析 2019-2023
- 地域別セグメント分析 2019-2023
- 国別セグメント分析 2019-2023
第6章 定性分析
- AIの影響:自動・スマートペットフィーダーの世界市場
第7章 ファイブフォース分析
- ファイブフォースの要約
- 買い手の交渉力
- 供給企業の交渉力
- 新規参入業者の脅威
- 代替品の脅威
- 競争の脅威
- 市況
第8章 市場セグメンテーション:流通チャネル別
- 市場セグメント
- 比較:流通チャネル別
- オフライン:市場規模と予測 2024-2029
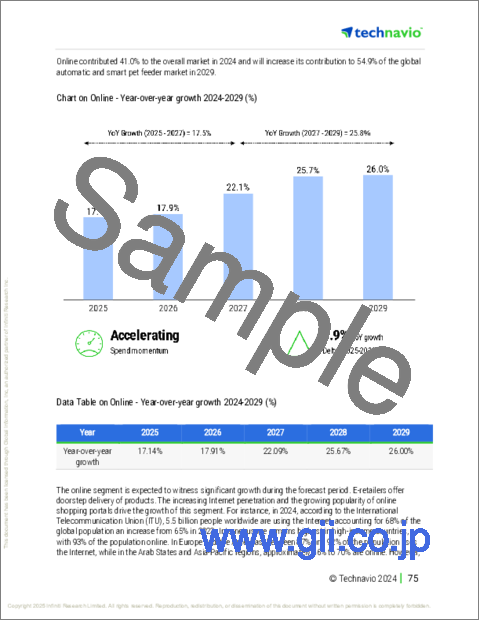
- オンライン:市場規模と予測 2024-2029
- 市場機会:流通チャネル別
第9章 市場セグメンテーション:タイプ別
- 市場セグメント
- 比較:タイプ別
- 自動:市場規模と予測 2024-2029
- スマート:市場規模と予測 2024-2029
- 市場機会:タイプ別
第10章 市場セグメンテーション:エンドユーザー別
- 市場セグメント
- 比較:エンドユーザー別
- 犬:市場規模と予測 2024-2029
- 猫:市場規模と予測 2024-2029
- 市場機会:エンドユーザー別
第11章 市場セグメンテーション:価格別
- 市場セグメント
- 比較:価格別
- 中価格帯フィーダー:市場規模と予測 2024-2029
- 低価格帯フィーダー:市場規模と予測 2024-2029
- 高価格帯フィーダー:市場規模と予測 2024-2029
- 市場機会:価格別
第12章 顧客情勢
- 顧客情勢の概要
第13章 地域別情勢
- 地域別セグメンテーション
- 地域別比較
- 北米:市場規模と予測 2024-2029
- 欧州:市場規模と予測 2024-2029
- アジア太平洋:市場規模と予測 2024-2029
- 南米:市場規模と予測 2024-2029
- 中東・アフリカ:市場規模と予測 2024-2029
- 米国:市場規模と予測 2024-2029
- 中国:市場規模と予測 2024-2029
- ドイツ:市場規模と予測 2024-2029
- カナダ:市場規模と予測 2024-2029
- 英国:市場規模と予測 2024-2029
- 日本:市場規模と予測 2024-2029
- フランス:市場規模と予測 2024-2029
- イタリア:市場規模と予測 2024-2029
- 韓国:市場規模と予測 2024-2029
- スペイン:市場規模と予測 2024-2029
- 市場機会:地域情勢別
第14章 促進要因・課題・機会・抑制要因
- 市場促進要因
- 市場の課題
- 促進要因と課題の影響
- 市場の機会・抑制要因
第15章 競合情勢
- 概要
- 競合情勢
- 混乱の状況
- 業界のリスク
第16章 競合分析
- 企業プロファイル
- 企業ランキング指数
- 企業の市場ポジショニング
- C and A Marketing Inc.
- CEVA SANTE ANIMALE S.A
- Dogness International Co. Ltd.
- Doskocil Manufacturing Co. Inc.
- Encaya Corp.
- Paiwang Pet APP
- PetKeen
- PETKIT Ltd.
- Pets at Home Group Plc
- Qpets Inc.
- Radio Systems Corp.
- SureFlap Ltd.
- Tuya Inc
- Vet Innovations Inc.
- Wopet
第17章 付録
Exhibits:
- Exhibits1: Executive Summary - Chart on Market Overview
- Exhibits2: Executive Summary - Data Table on Market Overview
- Exhibits3: Executive Summary - Chart on Global Market Characteristics
- Exhibits4: Executive Summary - Chart on Market By Geographical Landscape
- Exhibits5: Executive Summary - Chart on Market Segmentation by Distribution Channel
- Exhibits6: Executive Summary - Chart on Market Segmentation by Type
- Exhibits7: Executive Summary - Chart on Market Segmentation by End-user
- Exhibits8: Executive Summary - Chart on Market Segmentation by Price
- Exhibits9: Executive Summary - Chart on Incremental Growth
- Exhibits10: Executive Summary - Data Table on Incremental Growth
- Exhibits11: Executive Summary - Chart on Company Market Positioning
- Exhibits12: Analysis of price sensitivity, lifecycle, customer purchase basket, adoption rates, and purchase criteria
- Exhibits13: Overview on criticality of inputs and factors of differentiation
- Exhibits14: Overview on factors of disruption
- Exhibits15: Impact of drivers and challenges in 2024 and 2029
- Exhibits16: Parent Market
- Exhibits17: Data Table on - Parent Market
- Exhibits18: Market characteristics analysis
- Exhibits19: Value chain analysis
- Exhibits20: Offerings of companies included in the market definition
- Exhibits21: Market segments
- Exhibits22: Chart on Global - Market size and forecast 2024-2029 ($ million)
- Exhibits23: Data Table on Global - Market size and forecast 2024-2029 ($ million)
- Exhibits24: Chart on Global Market: Year-over-year growth 2024-2029 (%)
- Exhibits25: Data Table on Global Market: Year-over-year growth 2024-2029 (%)
- Exhibits26: Historic Market Size - Data Table on Global Automatic And Smart Pet Feeder Market 2019 - 2023 ($ million)
- Exhibits27: Historic Market Size - Distribution Channel Segment 2019 - 2023 ($ million)
- Exhibits28: Historic Market Size - Type Segment 2019 - 2023 ($ million)
- Exhibits29: Historic Market Size - End-user Segment 2019 - 2023 ($ million)
- Exhibits30: Historic Market Size - Price Segment 2019 - 2023 ($ million)
- Exhibits31: Historic Market Size - Geography Segment 2019 - 2023 ($ million)
- Exhibits32: Historic Market Size - Country Segment 2019 - 2023 ($ million)
- Exhibits33: Five forces analysis - Comparison between 2024 and 2029
- Exhibits34: Bargaining power of buyers - Impact of key factors 2024 and 2029
- Exhibits35: Bargaining power of suppliers - Impact of key factors in 2024 and 2029
- Exhibits36: Threat of new entrants - Impact of key factors in 2024 and 2029
- Exhibits37: Threat of substitutes - Impact of key factors in 2024 and 2029
- Exhibits38: Threat of rivalry - Impact of key factors in 2024 and 2029
- Exhibits39: Chart on Market condition - Five forces 2024 and 2029
- Exhibits40: Chart on Distribution Channel - Market share 2024-2029 (%)
- Exhibits41: Data Table on Distribution Channel - Market share 2024-2029 (%)
- Exhibits42: Chart on Comparison by Distribution Channel
- Exhibits43: Data Table on Comparison by Distribution Channel
- Exhibits44: Chart on Offline - Market size and forecast 2024-2029 ($ million)
- Exhibits45: Data Table on Offline - Market size and forecast 2024-2029 ($ million)
- Exhibits46: Chart on Offline - Year-over-year growth 2024-2029 (%)
- Exhibits47: Data Table on Offline - Year-over-year growth 2024-2029 (%)
- Exhibits48: Chart on Online - Market size and forecast 2024-2029 ($ million)
- Exhibits49: Data Table on Online - Market size and forecast 2024-2029 ($ million)
- Exhibits50: Chart on Online - Year-over-year growth 2024-2029 (%)
- Exhibits51: Data Table on Online - Year-over-year growth 2024-2029 (%)
- Exhibits52: Market opportunity by Distribution Channel ($ million)
- Exhibits53: Data Table on Market opportunity by Distribution Channel ($ million)
- Exhibits54: Chart on Type - Market share 2024-2029 (%)
- Exhibits55: Data Table on Type - Market share 2024-2029 (%)
- Exhibits56: Chart on Comparison by Type
- Exhibits57: Data Table on Comparison by Type
- Exhibits58: Chart on Automatic - Market size and forecast 2024-2029 ($ million)
- Exhibits59: Data Table on Automatic - Market size and forecast 2024-2029 ($ million)
- Exhibits60: Chart on Automatic - Year-over-year growth 2024-2029 (%)
- Exhibits61: Data Table on Automatic - Year-over-year growth 2024-2029 (%)
- Exhibits62: Chart on Smart - Market size and forecast 2024-2029 ($ million)
- Exhibits63: Data Table on Smart - Market size and forecast 2024-2029 ($ million)
- Exhibits64: Chart on Smart - Year-over-year growth 2024-2029 (%)
- Exhibits65: Data Table on Smart - Year-over-year growth 2024-2029 (%)
- Exhibits66: Market opportunity by Type ($ million)
- Exhibits67: Data Table on Market opportunity by Type ($ million)
- Exhibits68: Chart on End-user - Market share 2024-2029 (%)
- Exhibits69: Data Table on End-user - Market share 2024-2029 (%)
- Exhibits70: Chart on Comparison by End-user
- Exhibits71: Data Table on Comparison by End-user
- Exhibits72: Chart on Dogs - Market size and forecast 2024-2029 ($ million)
- Exhibits73: Data Table on Dogs - Market size and forecast 2024-2029 ($ million)
- Exhibits74: Chart on Dogs - Year-over-year growth 2024-2029 (%)
- Exhibits75: Data Table on Dogs - Year-over-year growth 2024-2029 (%)
- Exhibits76: Chart on Cats - Market size and forecast 2024-2029 ($ million)
- Exhibits77: Data Table on Cats - Market size and forecast 2024-2029 ($ million)
- Exhibits78: Chart on Cats - Year-over-year growth 2024-2029 (%)
- Exhibits79: Data Table on Cats - Year-over-year growth 2024-2029 (%)
- Exhibits80: Market opportunity by End-user ($ million)
- Exhibits81: Data Table on Market opportunity by End-user ($ million)
- Exhibits82: Chart on Price - Market share 2024-2029 (%)
- Exhibits83: Data Table on Price - Market share 2024-2029 (%)
- Exhibits84: Chart on Comparison by Price
- Exhibits85: Data Table on Comparison by Price
- Exhibits86: Chart on Mid-range feeder - Market size and forecast 2024-2029 ($ million)
- Exhibits87: Data Table on Mid-range feeder - Market size and forecast 2024-2029 ($ million)
- Exhibits88: Chart on Mid-range feeder - Year-over-year growth 2024-2029 (%)
- Exhibits89: Data Table on Mid-range feeder - Year-over-year growth 2024-2029 (%)
- Exhibits90: Chart on Low-cost feeder - Market size and forecast 2024-2029 ($ million)
- Exhibits91: Data Table on Low-cost feeder - Market size and forecast 2024-2029 ($ million)
- Exhibits92: Chart on Low-cost feeder - Year-over-year growth 2024-2029 (%)
- Exhibits93: Data Table on Low-cost feeder - Year-over-year growth 2024-2029 (%)
- Exhibits94: Chart on Premium feeder - Market size and forecast 2024-2029 ($ million)
- Exhibits95: Data Table on Premium feeder - Market size and forecast 2024-2029 ($ million)
- Exhibits96: Chart on Premium feeder - Year-over-year growth 2024-2029 (%)
- Exhibits97: Data Table on Premium feeder - Year-over-year growth 2024-2029 (%)
- Exhibits98: Market opportunity by Price ($ million)
- Exhibits99: Data Table on Market opportunity by Price ($ million)
- Exhibits100: Analysis of price sensitivity, lifecycle, customer purchase basket, adoption rates, and purchase criteria
- Exhibits101: Chart on Market share By Geographical Landscape 2024-2029 (%)
- Exhibits102: Data Table on Market share By Geographical Landscape 2024-2029 (%)
- Exhibits103: Chart on Geographic comparison
- Exhibits104: Data Table on Geographic comparison
- Exhibits105: Chart on North America - Market size and forecast 2024-2029 ($ million)
- Exhibits106: Data Table on North America - Market size and forecast 2024-2029 ($ million)
- Exhibits107: Chart on North America - Year-over-year growth 2024-2029 (%)
- Exhibits108: Data Table on North America - Year-over-year growth 2024-2029 (%)
- Exhibits109: Chart on Europe - Market size and forecast 2024-2029 ($ million)
- Exhibits110: Data Table on Europe - Market size and forecast 2024-2029 ($ million)
- Exhibits111: Chart on Europe - Year-over-year growth 2024-2029 (%)
- Exhibits112: Data Table on Europe - Year-over-year growth 2024-2029 (%)
- Exhibits113: Chart on APAC - Market size and forecast 2024-2029 ($ million)
- Exhibits114: Data Table on APAC - Market size and forecast 2024-2029 ($ million)
- Exhibits115: Chart on APAC - Year-over-year growth 2024-2029 (%)
- Exhibits116: Data Table on APAC - Year-over-year growth 2024-2029 (%)
- Exhibits117: Chart on South America - Market size and forecast 2024-2029 ($ million)
- Exhibits118: Data Table on South America - Market size and forecast 2024-2029 ($ million)
- Exhibits119: Chart on South America - Year-over-year growth 2024-2029 (%)
- Exhibits120: Data Table on South America - Year-over-year growth 2024-2029 (%)
- Exhibits121: Chart on Middle East and Africa - Market size and forecast 2024-2029 ($ million)
- Exhibits122: Data Table on Middle East and Africa - Market size and forecast 2024-2029 ($ million)
- Exhibits123: Chart on Middle East and Africa - Year-over-year growth 2024-2029 (%)
- Exhibits124: Data Table on Middle East and Africa - Year-over-year growth 2024-2029 (%)
- Exhibits125: Chart on US - Market size and forecast 2024-2029 ($ million)
- Exhibits126: Data Table on US - Market size and forecast 2024-2029 ($ million)
- Exhibits127: Chart on US - Year-over-year growth 2024-2029 (%)
- Exhibits128: Data Table on US - Year-over-year growth 2024-2029 (%)
- Exhibits129: Chart on China - Market size and forecast 2024-2029 ($ million)
- Exhibits130: Data Table on China - Market size and forecast 2024-2029 ($ million)
- Exhibits131: Chart on China - Year-over-year growth 2024-2029 (%)
- Exhibits132: Data Table on China - Year-over-year growth 2024-2029 (%)
- Exhibits133: Chart on Germany - Market size and forecast 2024-2029 ($ million)
- Exhibits134: Data Table on Germany - Market size and forecast 2024-2029 ($ million)
- Exhibits135: Chart on Germany - Year-over-year growth 2024-2029 (%)
- Exhibits136: Data Table on Germany - Year-over-year growth 2024-2029 (%)
- Exhibits137: Chart on Canada - Market size and forecast 2024-2029 ($ million)
- Exhibits138: Data Table on Canada - Market size and forecast 2024-2029 ($ million)
- Exhibits139: Chart on Canada - Year-over-year growth 2024-2029 (%)
- Exhibits140: Data Table on Canada - Year-over-year growth 2024-2029 (%)
- Exhibits141: Chart on UK - Market size and forecast 2024-2029 ($ million)
- Exhibits142: Data Table on UK - Market size and forecast 2024-2029 ($ million)
- Exhibits143: Chart on UK - Year-over-year growth 2024-2029 (%)
- Exhibits144: Data Table on UK - Year-over-year growth 2024-2029 (%)
- Exhibits145: Chart on Japan - Market size and forecast 2024-2029 ($ million)
- Exhibits146: Data Table on Japan - Market size and forecast 2024-2029 ($ million)
- Exhibits147: Chart on Japan - Year-over-year growth 2024-2029 (%)
- Exhibits148: Data Table on Japan - Year-over-year growth 2024-2029 (%)
- Exhibits149: Chart on France - Market size and forecast 2024-2029 ($ million)
- Exhibits150: Data Table on France - Market size and forecast 2024-2029 ($ million)
- Exhibits151: Chart on France - Year-over-year growth 2024-2029 (%)
- Exhibits152: Data Table on France - Year-over-year growth 2024-2029 (%)
- Exhibits153: Chart on Italy - Market size and forecast 2024-2029 ($ million)
- Exhibits154: Data Table on Italy - Market size and forecast 2024-2029 ($ million)
- Exhibits155: Chart on Italy - Year-over-year growth 2024-2029 (%)
- Exhibits156: Data Table on Italy - Year-over-year growth 2024-2029 (%)
- Exhibits157: Chart on South Korea - Market size and forecast 2024-2029 ($ million)
- Exhibits158: Data Table on South Korea - Market size and forecast 2024-2029 ($ million)
- Exhibits159: Chart on South Korea - Year-over-year growth 2024-2029 (%)
- Exhibits160: Data Table on South Korea - Year-over-year growth 2024-2029 (%)
- Exhibits161: Chart on Spain - Market size and forecast 2024-2029 ($ million)
- Exhibits162: Data Table on Spain - Market size and forecast 2024-2029 ($ million)
- Exhibits163: Chart on Spain - Year-over-year growth 2024-2029 (%)
- Exhibits164: Data Table on Spain - Year-over-year growth 2024-2029 (%)
- Exhibits165: Market opportunity By Geographical Landscape ($ million)
- Exhibits166: Data Tables on Market opportunity By Geographical Landscape ($ million)
- Exhibits167: Impact of drivers and challenges in 2024 and 2029
- Exhibits168: Overview on criticality of inputs and factors of differentiation
- Exhibits169: Overview on factors of disruption
- Exhibits170: Impact of key risks on business
- Exhibits171: Companies covered
- Exhibits172: Company ranking index
- Exhibits173: Matrix on companies position and classification
- Exhibits174: C and A Marketing Inc. - Overview
- Exhibits175: C and A Marketing Inc. - Product / Service
- Exhibits176: C and A Marketing Inc. - Key offerings
- Exhibits177: SWOT
- Exhibits178: CEVA SANTE ANIMALE S.A - Overview
- Exhibits179: CEVA SANTE ANIMALE S.A - Product / Service
- Exhibits180: CEVA SANTE ANIMALE S.A - Key offerings
- Exhibits181: SWOT
- Exhibits182: Dogness International Co. Ltd. - Overview
- Exhibits183: Dogness International Co. Ltd. - Product / Service
- Exhibits184: Dogness International Co. Ltd. - Key offerings
- Exhibits185: SWOT
- Exhibits186: Doskocil Manufacturing Co. Inc. - Overview
- Exhibits187: Doskocil Manufacturing Co. Inc. - Product / Service
- Exhibits188: Doskocil Manufacturing Co. Inc. - Key offerings
- Exhibits189: SWOT
- Exhibits190: Encaya Corp. - Overview
- Exhibits191: Encaya Corp. - Product / Service
- Exhibits192: Encaya Corp. - Key offerings
- Exhibits193: SWOT
- Exhibits194: Paiwang Pet APP - Overview
- Exhibits195: Paiwang Pet APP - Product / Service
- Exhibits196: Paiwang Pet APP - Key offerings
- Exhibits197: SWOT
- Exhibits198: PetKeen - Overview
- Exhibits199: PetKeen - Product / Service
- Exhibits200: PetKeen - Key offerings
- Exhibits201: SWOT
- Exhibits202: PETKIT Ltd. - Overview
- Exhibits203: PETKIT Ltd. - Product / Service
- Exhibits204: PETKIT Ltd. - Key offerings
- Exhibits205: SWOT
- Exhibits206: Pets at Home Group Plc - Overview
- Exhibits207: Pets at Home Group Plc - Business segments
- Exhibits208: Pets at Home Group Plc - Key offerings
- Exhibits209: Pets at Home Group Plc - Segment focus
- Exhibits210: SWOT
- Exhibits211: Qpets Inc. - Overview
- Exhibits212: Qpets Inc. - Product / Service
- Exhibits213: Qpets Inc. - Key offerings
- Exhibits214: SWOT
- Exhibits215: Radio Systems Corp. - Overview
- Exhibits216: Radio Systems Corp. - Product / Service
- Exhibits217: Radio Systems Corp. - Key offerings
- Exhibits218: SWOT
- Exhibits219: SureFlap Ltd. - Overview
- Exhibits220: SureFlap Ltd. - Product / Service
- Exhibits221: SureFlap Ltd. - Key offerings
- Exhibits222: SWOT
- Exhibits223: Tuya Inc - Overview
- Exhibits224: Tuya Inc - Product / Service
- Exhibits225: Tuya Inc - Key news
- Exhibits226: Tuya Inc - Key offerings
- Exhibits227: SWOT
- Exhibits228: Vet Innovations Inc. - Overview
- Exhibits229: Vet Innovations Inc. - Product / Service
- Exhibits230: Vet Innovations Inc. - Key offerings
- Exhibits231: SWOT
- Exhibits232: Wopet - Overview
- Exhibits233: Wopet - Product / Service
- Exhibits234: Wopet - Key offerings
- Exhibits235: SWOT
- Exhibits236: Inclusions checklist
- Exhibits237: Exclusions checklist
- Exhibits238: Currency conversion rates for US$
- Exhibits239: Research methodology
- Exhibits240: Information sources
- Exhibits241: Data validation
- Exhibits242: Validation techniques employed for market sizing
- Exhibits243: Data synthesis
- Exhibits244: 360 degree market analysis
- Exhibits245: List of abbreviations
The automatic and smart pet feeder market is forecasted to grow by USD 2203.2 mn during 2024-2029, accelerating at a CAGR of 14.8% during the forecast period. The report on the automatic and smart pet feeder market provides a holistic analysis, market size and forecast, trends, growth drivers, and challenges, as well as vendor analysis covering around 25 vendors.
The report offers an up-to-date analysis regarding the current market scenario, the latest trends and drivers, and the overall market environment. The market is driven by changing lifestyle patterns and busy work lives of urban populace, rise in product visibility and accessibility through online retailing, and introduction of multichannel marketing strategies for effective branding.
| Market Scope | |
|---|---|
| Base Year | 2025 |
| End Year | 2029 |
| Series Year | 2025-2029 |
| Growth Momentum | Accelerate |
| YOY 2025 | 11.8% |
| CAGR | 14.8% |
| Incremental Value | $2203.2 mn |
The study was conducted using an objective combination of primary and secondary information including inputs from key participants in the industry. The report contains a comprehensive market size data, segment with regional analysis and vendor landscape in addition to an analysis of the key companies. Reports have historic and forecast data.
Technavio's automatic and smart pet feeder market is segmented as below:
By Distribution Channel
- Offline
- Online
By Type
- Automatic
- Smart
By End-user
- Dogs
- Cats
By Price
- Mid-range feeder
- Low-cost feeder
- Premium feeder
By Geographical Landscape
- North America
- Europe
- APAC
- South America
- Middle East and Africa
This study identifies the smart homes augmenting demand for smart pet feeders as one of the prime reasons driving the automatic and smart pet feeder market growth during the next few years. Also, introduction of electronic weighing of food in pet feeders and built-in microphone and remote video camera for better communication will lead to sizable demand in the market.
The report on the automatic and smart pet feeder market covers the following areas:
- Automatic And Smart Pet Feeder Market sizing
- Automatic And Smart Pet Feeder Market forecast
- Automatic And Smart Pet Feeder Market industry analysis
The robust vendor analysis is designed to help clients improve their market position, and in line with this, this report provides a detailed analysis of several leading automatic and smart pet feeder market vendors that include C and A Marketing Inc., CEVA SANTE ANIMALE S.A, Dogness International Co. Ltd., Doskocil Manufacturing Co. Inc., Encaya Corp., Faroro, OWON Technology Inc., Paiwang Pet APP, Petcube Inc., PetKeen, PETKIT Ltd., Pets at Home Group Plc, Qpets Inc., Radio Systems Corp., Shenzhen Skymee Technology Co. Ltd., SureFlap Ltd., Tuya Inc, Vet Innovations Inc., and Wopet. Also, the automatic and smart pet feeder market analysis report includes information on upcoming trends and challenges that will influence market growth. This is to help companies strategize and leverage all forthcoming growth opportunities.
The publisher presents a detailed picture of the market by the way of study, synthesis, and summation of data from multiple sources by an analysis of key parameters such as profit, pricing, competition, and promotions. It presents various market facets by identifying the key industry influencers. The data presented is comprehensive, reliable, and a result of extensive primary and secondary research. The market research reports provide a complete competitive landscape and an in-depth vendor selection methodology and analysis using qualitative and quantitative research to forecast accurate market growth.
Table of Contents
1 Executive Summary
- 1.1 Market overview
- Executive Summary - Chart on Market Overview
- Executive Summary - Data Table on Market Overview
- Executive Summary - Chart on Global Market Characteristics
- Executive Summary - Chart on Market By Geographical Landscape
- Executive Summary - Chart on Market Segmentation by Distribution Channel
- Executive Summary - Chart on Market Segmentation by Type
- Executive Summary - Chart on Market Segmentation by End-user
- Executive Summary - Chart on Market Segmentation by Price
- Executive Summary - Chart on Incremental Growth
- Executive Summary - Data Table on Incremental Growth
- Executive Summary - Chart on Company Market Positioning
2 Technavio Analysis
- 2.1 Analysis of price sensitivity, lifecycle, customer purchase basket, adoption rates, and purchase criteria
- Analysis of price sensitivity, lifecycle, customer purchase basket, adoption rates, and purchase criteria
- 2.2 Criticality of inputs and Factors of differentiation
- Overview on criticality of inputs and factors of differentiation
- 2.3 Factors of disruption
- Overview on factors of disruption
- 2.4 Impact of drivers and challenges
- Impact of drivers and challenges in 2024 and 2029
3 Market Landscape
- 3.1 Market ecosystem
- Parent Market
- Data Table on - Parent Market
- 3.2 Market characteristics
- Market characteristics analysis
- 3.3 Value chain analysis
- Value chain analysis
4 Market Sizing
- 4.1 Market definition
- Offerings of companies included in the market definition
- 4.2 Market segment analysis
- Market segments
- 4.3 Market size 2024
- 4.4 Market outlook: Forecast for 2024-2029
- Chart on Global - Market size and forecast 2024-2029 ($ million)
- Data Table on Global - Market size and forecast 2024-2029 ($ million)
- Chart on Global Market: Year-over-year growth 2024-2029 (%)
- Data Table on Global Market: Year-over-year growth 2024-2029 (%)
5 Historic Market Size
- 5.1 Global Automatic And Smart Pet Feeder Market 2019 - 2023
- Historic Market Size - Data Table on Global Automatic And Smart Pet Feeder Market 2019 - 2023 ($ million)
- 5.2 Distribution Channel segment analysis 2019 - 2023
- Historic Market Size - Distribution Channel Segment 2019 - 2023 ($ million)
- 5.3 Type segment analysis 2019 - 2023
- Historic Market Size - Type Segment 2019 - 2023 ($ million)
- 5.4 End-user segment analysis 2019 - 2023
- Historic Market Size - End-user Segment 2019 - 2023 ($ million)
- 5.5 Price segment analysis 2019 - 2023
- Historic Market Size - Price Segment 2019 - 2023 ($ million)
- 5.6 Geography segment analysis 2019 - 2023
- Historic Market Size - Geography Segment 2019 - 2023 ($ million)
- 5.7 Country segment analysis 2019 - 2023
- Historic Market Size - Country Segment 2019 - 2023 ($ million)
6 Qualitative Analysis
- 6.1 Impact of AI in global automatic and smart pet feeder market
7 Five Forces Analysis
- 7.1 Five forces summary
- Five forces analysis - Comparison between 2024 and 2029
- 7.2 Bargaining power of buyers
- Bargaining power of buyers - Impact of key factors 2024 and 2029
- 7.3 Bargaining power of suppliers
- Bargaining power of suppliers - Impact of key factors in 2024 and 2029
- 7.4 Threat of new entrants
- Threat of new entrants - Impact of key factors in 2024 and 2029
- 7.5 Threat of substitutes
- Threat of substitutes - Impact of key factors in 2024 and 2029
- 7.6 Threat of rivalry
- Threat of rivalry - Impact of key factors in 2024 and 2029
- 7.7 Market condition
- Chart on Market condition - Five forces 2024 and 2029
8 Market Segmentation by Distribution Channel
- 8.1 Market segments
- Chart on Distribution Channel - Market share 2024-2029 (%)
- Data Table on Distribution Channel - Market share 2024-2029 (%)
- 8.2 Comparison by Distribution Channel
- Chart on Comparison by Distribution Channel
- Data Table on Comparison by Distribution Channel
- 8.3 Offline - Market size and forecast 2024-2029
- Chart on Offline - Market size and forecast 2024-2029 ($ million)
- Data Table on Offline - Market size and forecast 2024-2029 ($ million)
- Chart on Offline - Year-over-year growth 2024-2029 (%)
- Data Table on Offline - Year-over-year growth 2024-2029 (%)
- 8.4 Online - Market size and forecast 2024-2029
- Chart on Online - Market size and forecast 2024-2029 ($ million)
- Data Table on Online - Market size and forecast 2024-2029 ($ million)
- Chart on Online - Year-over-year growth 2024-2029 (%)
- Data Table on Online - Year-over-year growth 2024-2029 (%)
- 8.5 Market opportunity by Distribution Channel
- Market opportunity by Distribution Channel ($ million)
- Data Table on Market opportunity by Distribution Channel ($ million)
9 Market Segmentation by Type
- 9.1 Market segments
- Chart on Type - Market share 2024-2029 (%)
- Data Table on Type - Market share 2024-2029 (%)
- 9.2 Comparison by Type
- Chart on Comparison by Type
- Data Table on Comparison by Type
- 9.3 Automatic - Market size and forecast 2024-2029
- Chart on Automatic - Market size and forecast 2024-2029 ($ million)
- Data Table on Automatic - Market size and forecast 2024-2029 ($ million)
- Chart on Automatic - Year-over-year growth 2024-2029 (%)
- Data Table on Automatic - Year-over-year growth 2024-2029 (%)
- 9.4 Smart - Market size and forecast 2024-2029
- Chart on Smart - Market size and forecast 2024-2029 ($ million)
- Data Table on Smart - Market size and forecast 2024-2029 ($ million)
- Chart on Smart - Year-over-year growth 2024-2029 (%)
- Data Table on Smart - Year-over-year growth 2024-2029 (%)
- 9.5 Market opportunity by Type
- Market opportunity by Type ($ million)
- Data Table on Market opportunity by Type ($ million)
10 Market Segmentation by End-user
- 10.1 Market segments
- Chart on End-user - Market share 2024-2029 (%)
- Data Table on End-user - Market share 2024-2029 (%)
- 10.2 Comparison by End-user
- Chart on Comparison by End-user
- Data Table on Comparison by End-user
- 10.3 Dogs - Market size and forecast 2024-2029
- Chart on Dogs - Market size and forecast 2024-2029 ($ million)
- Data Table on Dogs - Market size and forecast 2024-2029 ($ million)
- Chart on Dogs - Year-over-year growth 2024-2029 (%)
- Data Table on Dogs - Year-over-year growth 2024-2029 (%)
- 10.4 Cats - Market size and forecast 2024-2029
- Chart on Cats - Market size and forecast 2024-2029 ($ million)
- Data Table on Cats - Market size and forecast 2024-2029 ($ million)
- Chart on Cats - Year-over-year growth 2024-2029 (%)
- Data Table on Cats - Year-over-year growth 2024-2029 (%)
- 10.5 Market opportunity by End-user
- Market opportunity by End-user ($ million)
- Data Table on Market opportunity by End-user ($ million)
11 Market Segmentation by Price
- 11.1 Market segments
- Chart on Price - Market share 2024-2029 (%)
- Data Table on Price - Market share 2024-2029 (%)
- 11.2 Comparison by Price
- Chart on Comparison by Price
- Data Table on Comparison by Price
- 11.3 Mid-range feeder - Market size and forecast 2024-2029
- Chart on Mid-range feeder - Market size and forecast 2024-2029 ($ million)
- Data Table on Mid-range feeder - Market size and forecast 2024-2029 ($ million)
- Chart on Mid-range feeder - Year-over-year growth 2024-2029 (%)
- Data Table on Mid-range feeder - Year-over-year growth 2024-2029 (%)
- 11.4 Low-cost feeder - Market size and forecast 2024-2029
- Chart on Low-cost feeder - Market size and forecast 2024-2029 ($ million)
- Data Table on Low-cost feeder - Market size and forecast 2024-2029 ($ million)
- Chart on Low-cost feeder - Year-over-year growth 2024-2029 (%)
- Data Table on Low-cost feeder - Year-over-year growth 2024-2029 (%)
- 11.5 Premium feeder - Market size and forecast 2024-2029
- Chart on Premium feeder - Market size and forecast 2024-2029 ($ million)
- Data Table on Premium feeder - Market size and forecast 2024-2029 ($ million)
- Chart on Premium feeder - Year-over-year growth 2024-2029 (%)
- Data Table on Premium feeder - Year-over-year growth 2024-2029 (%)
- 11.6 Market opportunity by Price
- Market opportunity by Price ($ million)
- Data Table on Market opportunity by Price ($ million)
12 Customer Landscape
- 12.1 Customer landscape overview
- Analysis of price sensitivity, lifecycle, customer purchase basket, adoption rates, and purchase criteria
13 Geographic Landscape
- 13.1 Geographic segmentation
- Chart on Market share By Geographical Landscape 2024-2029 (%)
- Data Table on Market share By Geographical Landscape 2024-2029 (%)
- 13.2 Geographic comparison
- Chart on Geographic comparison
- Data Table on Geographic comparison
- 13.3 North America - Market size and forecast 2024-2029
- Chart on North America - Market size and forecast 2024-2029 ($ million)
- Data Table on North America - Market size and forecast 2024-2029 ($ million)
- Chart on North America - Year-over-year growth 2024-2029 (%)
- Data Table on North America - Year-over-year growth 2024-2029 (%)
- 13.4 Europe - Market size and forecast 2024-2029
- Chart on Europe - Market size and forecast 2024-2029 ($ million)
- Data Table on Europe - Market size and forecast 2024-2029 ($ million)
- Chart on Europe - Year-over-year growth 2024-2029 (%)
- Data Table on Europe - Year-over-year growth 2024-2029 (%)
- 13.5 APAC - Market size and forecast 2024-2029
- Chart on APAC - Market size and forecast 2024-2029 ($ million)
- Data Table on APAC - Market size and forecast 2024-2029 ($ million)
- Chart on APAC - Year-over-year growth 2024-2029 (%)
- Data Table on APAC - Year-over-year growth 2024-2029 (%)
- 13.6 South America - Market size and forecast 2024-2029
- Chart on South America - Market size and forecast 2024-2029 ($ million)
- Data Table on South America - Market size and forecast 2024-2029 ($ million)
- Chart on South America - Year-over-year growth 2024-2029 (%)
- Data Table on South America - Year-over-year growth 2024-2029 (%)
- 13.7 Middle East and Africa - Market size and forecast 2024-2029
- Chart on Middle East and Africa - Market size and forecast 2024-2029 ($ million)
- Data Table on Middle East and Africa - Market size and forecast 2024-2029 ($ million)
- Chart on Middle East and Africa - Year-over-year growth 2024-2029 (%)
- Data Table on Middle East and Africa - Year-over-year growth 2024-2029 (%)
- 13.8 US - Market size and forecast 2024-2029
- Chart on US - Market size and forecast 2024-2029 ($ million)
- Data Table on US - Market size and forecast 2024-2029 ($ million)
- Chart on US - Year-over-year growth 2024-2029 (%)
- Data Table on US - Year-over-year growth 2024-2029 (%)
- 13.9 China - Market size and forecast 2024-2029
- Chart on China - Market size and forecast 2024-2029 ($ million)
- Data Table on China - Market size and forecast 2024-2029 ($ million)
- Chart on China - Year-over-year growth 2024-2029 (%)
- Data Table on China - Year-over-year growth 2024-2029 (%)
- 13.10 Germany - Market size and forecast 2024-2029
- Chart on Germany - Market size and forecast 2024-2029 ($ million)
- Data Table on Germany - Market size and forecast 2024-2029 ($ million)
- Chart on Germany - Year-over-year growth 2024-2029 (%)
- Data Table on Germany - Year-over-year growth 2024-2029 (%)
- 13.11 Canada - Market size and forecast 2024-2029
- Chart on Canada - Market size and forecast 2024-2029 ($ million)
- Data Table on Canada - Market size and forecast 2024-2029 ($ million)
- Chart on Canada - Year-over-year growth 2024-2029 (%)
- Data Table on Canada - Year-over-year growth 2024-2029 (%)
- 13.12 UK - Market size and forecast 2024-2029
- Chart on UK - Market size and forecast 2024-2029 ($ million)
- Data Table on UK - Market size and forecast 2024-2029 ($ million)
- Chart on UK - Year-over-year growth 2024-2029 (%)
- Data Table on UK - Year-over-year growth 2024-2029 (%)
- 13.13 Japan - Market size and forecast 2024-2029
- Chart on Japan - Market size and forecast 2024-2029 ($ million)
- Data Table on Japan - Market size and forecast 2024-2029 ($ million)
- Chart on Japan - Year-over-year growth 2024-2029 (%)
- Data Table on Japan - Year-over-year growth 2024-2029 (%)
- 13.14 France - Market size and forecast 2024-2029
- Chart on France - Market size and forecast 2024-2029 ($ million)
- Data Table on France - Market size and forecast 2024-2029 ($ million)
- Chart on France - Year-over-year growth 2024-2029 (%)
- Data Table on France - Year-over-year growth 2024-2029 (%)
- 13.15 Italy - Market size and forecast 2024-2029
- Chart on Italy - Market size and forecast 2024-2029 ($ million)
- Data Table on Italy - Market size and forecast 2024-2029 ($ million)
- Chart on Italy - Year-over-year growth 2024-2029 (%)
- Data Table on Italy - Year-over-year growth 2024-2029 (%)
- 13.16 South Korea - Market size and forecast 2024-2029
- Chart on South Korea - Market size and forecast 2024-2029 ($ million)
- Data Table on South Korea - Market size and forecast 2024-2029 ($ million)
- Chart on South Korea - Year-over-year growth 2024-2029 (%)
- Data Table on South Korea - Year-over-year growth 2024-2029 (%)
- 13.17 Spain - Market size and forecast 2024-2029
- Chart on Spain - Market size and forecast 2024-2029 ($ million)
- Data Table on Spain - Market size and forecast 2024-2029 ($ million)
- Chart on Spain - Year-over-year growth 2024-2029 (%)
- Data Table on Spain - Year-over-year growth 2024-2029 (%)
- 13.18 Market opportunity By Geographical Landscape
- Market opportunity By Geographical Landscape ($ million)
- Data Tables on Market opportunity By Geographical Landscape ($ million)
14 Drivers, Challenges, and Opportunity/Restraints
- 14.1 Market drivers
- 14.2 Market challenges
- 14.3 Impact of drivers and challenges
- Impact of drivers and challenges in 2024 and 2029
- 14.4 Market opportunities/restraints
15 Competitive Landscape
- 15.1 Overview
- 15.2 Competitive Landscape
- Overview on criticality of inputs and factors of differentiation
- 15.3 Landscape disruption
- Overview on factors of disruption
- 15.4 Industry risks
- Impact of key risks on business
16 Competitive Analysis
- 16.1 Companies profiled
- Companies covered
- 16.2 Company ranking index
- Company ranking index
- 16.3 Market positioning of companies
- Matrix on companies position and classification
- 16.4 C and A Marketing Inc.
- C and A Marketing Inc. - Overview
- C and A Marketing Inc. - Product / Service
- C and A Marketing Inc. - Key offerings
- SWOT
- 16.5 CEVA SANTE ANIMALE S.A
- CEVA SANTE ANIMALE S.A - Overview
- CEVA SANTE ANIMALE S.A - Product / Service
- CEVA SANTE ANIMALE S.A - Key offerings
- SWOT
- 16.6 Dogness International Co. Ltd.
- Dogness International Co. Ltd. - Overview
- Dogness International Co. Ltd. - Product / Service
- Dogness International Co. Ltd. - Key offerings
- SWOT
- 16.7 Doskocil Manufacturing Co. Inc.
- Doskocil Manufacturing Co. Inc. - Overview
- Doskocil Manufacturing Co. Inc. - Product / Service
- Doskocil Manufacturing Co. Inc. - Key offerings
- SWOT
- 16.8 Encaya Corp.
- Encaya Corp. - Overview
- Encaya Corp. - Product / Service
- Encaya Corp. - Key offerings
- SWOT
- 16.9 Paiwang Pet APP
- Paiwang Pet APP - Overview
- Paiwang Pet APP - Product / Service
- Paiwang Pet APP - Key offerings
- SWOT
- 16.10 PetKeen
- PetKeen - Overview
- PetKeen - Product / Service
- PetKeen - Key offerings
- SWOT
- 16.11 PETKIT Ltd.
- PETKIT Ltd. - Overview
- PETKIT Ltd. - Product / Service
- PETKIT Ltd. - Key offerings
- SWOT
- 16.12 Pets at Home Group Plc
- Pets at Home Group Plc - Overview
- Pets at Home Group Plc - Business segments
- Pets at Home Group Plc - Key offerings
- Pets at Home Group Plc - Segment focus
- SWOT
- 16.13 Qpets Inc.
- Qpets Inc. - Overview
- Qpets Inc. - Product / Service
- Qpets Inc. - Key offerings
- SWOT
- 16.14 Radio Systems Corp.
- Radio Systems Corp. - Overview
- Radio Systems Corp. - Product / Service
- Radio Systems Corp. - Key offerings
- SWOT
- 16.15 SureFlap Ltd.
- SureFlap Ltd. - Overview
- SureFlap Ltd. - Product / Service
- SureFlap Ltd. - Key offerings
- SWOT
- 16.16 Tuya Inc
- Tuya Inc - Overview
- Tuya Inc - Product / Service
- Tuya Inc - Key news
- Tuya Inc - Key offerings
- SWOT
- 16.17 Vet Innovations Inc.
- Vet Innovations Inc. - Overview
- Vet Innovations Inc. - Product / Service
- Vet Innovations Inc. - Key offerings
- SWOT
- 16.18 Wopet
- Wopet - Overview
- Wopet - Product / Service
- Wopet - Key offerings
- SWOT
17 Appendix
- 17.1 Scope of the report
- 17.2 Inclusions and exclusions checklist
- Inclusions checklist
- Exclusions checklist
- 17.3 Currency conversion rates for US$
- Currency conversion rates for US$
- 17.4 Research methodology
- Research methodology
- 17.5 Data procurement
- Information sources
- 17.6 Data validation
- Data validation
- 17.7 Validation techniques employed for market sizing
- Validation techniques employed for market sizing
- 17.8 Data synthesis
- Data synthesis
- 17.9 360 degree market analysis
- 360 degree market analysis
- 17.10 List of abbreviations
- List of abbreviations

