|
|
市場調査レポート
商品コード
1626744
植物・植物由来医薬品の世界市場 2025-2029年Global Botanical and Plant-derived Drugs Market 2025-2029 |
||||||

|
|||||||
カスタマイズ可能
|
|||||||


| 植物・植物由来医薬品の世界市場 2025-2029年 |
|
出版日: 2024年12月19日
発行: TechNavio
ページ情報: 英文 207 Pages
納期: 即納可能
|

全表示
- 概要
- 図表
- 目次
植物・植物由来医薬品市場 2025-2029年
植物・植物由来医薬品市場は2024-2029年に186億6,000万米ドル、予測期間中のCAGRは7.4%で成長すると予測されます。当レポートでは、植物・植物由来医薬品市場の全体的な分析、市場規模・予測、動向、成長促進要因、課題、約25のベンダーを網羅したベンダー分析などを掲載しています。
現在の市場シナリオ、最新動向と促進要因、市場環境全体に関する最新分析を提供しています。市場は、植物由来医薬品の使用を促進する政府のイニシアティブの高まり、従来の医薬品に関連する制限、慢性疾患の効果的な治療に対する需要の高まりによって牽引されています。
| 市場範囲 | |
|---|---|
| 基準年 | 2025 |
| 終了年 | 2029 |
| 予測期間 | 2025-2029 |
| 成長モメンタム | 加速 |
| 前年比2025年 | 6.9% |
| CAGR | 7.4% |
| 増分額 | 186億6,000万米ドル |
本調査では、米国における規制状況の変化が、今後数年間の市場情勢を牽引する主な要因の一つであるとしています。また、新たな医療分野に向けた医薬品開発への注目の高まりや、革新的な製品を持つ新規参入企業の出現は、市場の大きな需要につながります。
目次
第1章 エグゼクティブサマリー
- 市場概要
第2章 Technavio別分析
- 価格・ライフサイクル・顧客購入バスケット・採用率・購入基準の分析
- インプットの重要性と差別化の要因
- 混乱の要因
- 促進要因と課題の影響
第3章 市場情勢
- 市場エコシステム
- 市場の特徴
- バリューチェーン分析
第4章 市場規模
- 市場の定義
- 市場セグメント分析
- 市場規模 2024
- 市場の見通し 2024-2029
第5章 市場規模実績
- 植物・植物由来医薬品の世界市場 2019-2023
- タイプ別セグメント分析 2019-2023
- 用途別セグメント分析 2019-2023
- 地域別セグメント分析 2019-2023
- 国別セグメント分析 2019-2023
第6章 定性分析
- AIの影響:植物・植物由来医薬品の世界市場
第7章 ファイブフォース分析
- ファイブフォースの要約
- 買い手の交渉力
- 供給企業の交渉力
- 新規参入業者の脅威
- 代替品の脅威
- 競争の脅威
- 市況
第8章 市場セグメンテーション:タイプ別
- 市場セグメント
- 比較:タイプ別
- 経口:市場規模と予測 2024-2029
- 注射:市場規模と予測 2024-2029
- 外用:市場規模と予測 2024-2029
- 市場機会:タイプ別
第9章 市場セグメンテーション:用途別
- 市場セグメント
- 比較:用途別
- 感染症:市場規模と予測 2024-2029
- 中枢神経系:市場規模と予測 2024-2029
- 心血管疾患:市場規模と予測 2024-2029
- 呼吸器疾患:市場規模と予測 2024-2029
- その他:市場規模と予測 2024-2029
- 市場機会:用途別
第10章 顧客情勢
- 顧客情勢の概要
第11章 地域別情勢
- 地域別セグメンテーション
- 地域別比較
- アジア:市場規模と予測 2024-2029
- 欧州:市場規模と予測 2024-2029
- 北米:市場規模と予測 2024-2029
- 世界のその他の地域:市場規模と予測 2024-2029
- 米国:市場規模と予測 2024-2029
- 中国:市場規模と予測 2024-2029
- ドイツ:市場規模と予測 2024-2029
- 英国:市場規模と予測 2024-2029
- 日本:市場規模と予測 2024-2029
- カナダ:市場規模と予測 2024-2029
- インド:市場規模と予測 2024-2029
- 韓国:市場規模と予測 2024-2029
- フランス:市場規模と予測 2024-2029
- イタリア:市場規模と予測 2024-2029
- 市場機会:地域情勢別
第12章 促進要因・課題・機会・抑制要因
- 市場促進要因
- 市場の課題
- 促進要因と課題の影響
- 市場の機会・抑制要因
第13章 競合情勢
- 概要
- 競合情勢
- 混乱の状況
- 業界のリスク
第14章 競合分析
- 企業プロファイル
- 企業ランキング指数
- 企業の市場ポジショニング
- Bausch Health Companies Inc.
- Bayer AG
- Boehringer Ingelheim International GmbH
- Devonian Health Group Inc.
- Dr. Willmar Schwabe GmbH and Co. KG
- F. Hoffmann La Roche Ltd.
- Jaguar Health Inc.
- Jazz Pharmaceuticals Plc
- Merck KGaA
- Novartis AG
- Pfizer Inc.
- Pierre Fabre SA
- Protalix Biotherapeutics Inc.
- Sanofi SA
- Sun Pharmaceutical Industries Ltd.
第15章 付録
Exhibits:
- Exhibits1: Executive Summary - Chart on Market Overview
- Exhibits2: Executive Summary - Data Table on Market Overview
- Exhibits3: Executive Summary - Chart on Global Market Characteristics
- Exhibits4: Executive Summary - Chart on Market By Geographical Landscape
- Exhibits5: Executive Summary - Chart on Market Segmentation by Type
- Exhibits6: Executive Summary - Chart on Market Segmentation by Application
- Exhibits7: Executive Summary - Chart on Incremental Growth
- Exhibits8: Executive Summary - Data Table on Incremental Growth
- Exhibits9: Executive Summary - Chart on Company Market Positioning
- Exhibits10: Analysis of price sensitivity, lifecycle, customer purchase basket, adoption rates, and purchase criteria
- Exhibits11: Overview on criticality of inputs and factors of differentiation
- Exhibits12: Overview on factors of disruption
- Exhibits13: Impact of drivers and challenges in 2024 and 2029
- Exhibits14: Parent Market
- Exhibits15: Data Table on - Parent Market
- Exhibits16: Market characteristics analysis
- Exhibits17: Value chain analysis
- Exhibits18: Offerings of companies included in the market definition
- Exhibits19: Market segments
- Exhibits20: Chart on Global - Market size and forecast 2024-2029 ($ billion)
- Exhibits21: Data Table on Global - Market size and forecast 2024-2029 ($ billion)
- Exhibits22: Chart on Global Market: Year-over-year growth 2024-2029 (%)
- Exhibits23: Data Table on Global Market: Year-over-year growth 2024-2029 (%)
- Exhibits24: Historic Market Size - Data Table on Global Botanical And Plant-Derived Drugs Market 2019 - 2023 ($ billion)
- Exhibits25: Historic Market Size - Type Segment 2019 - 2023 ($ billion)
- Exhibits26: Historic Market Size - Application Segment 2019 - 2023 ($ billion)
- Exhibits27: Historic Market Size - Geography Segment 2019 - 2023 ($ billion)
- Exhibits28: Historic Market Size - Country Segment 2019 - 2023 ($ billion)
- Exhibits29: Five forces analysis - Comparison between 2024 and 2029
- Exhibits30: Bargaining power of buyers - Impact of key factors 2024 and 2029
- Exhibits31: Bargaining power of suppliers - Impact of key factors in 2024 and 2029
- Exhibits32: Threat of new entrants - Impact of key factors in 2024 and 2029
- Exhibits33: Threat of substitutes - Impact of key factors in 2024 and 2029
- Exhibits34: Threat of rivalry - Impact of key factors in 2024 and 2029
- Exhibits35: Chart on Market condition - Five forces 2024 and 2029
- Exhibits36: Chart on Type - Market share 2024-2029 (%)
- Exhibits37: Data Table on Type - Market share 2024-2029 (%)
- Exhibits38: Chart on Comparison by Type
- Exhibits39: Data Table on Comparison by Type
- Exhibits40: Chart on Oral - Market size and forecast 2024-2029 ($ billion)
- Exhibits41: Data Table on Oral - Market size and forecast 2024-2029 ($ billion)
- Exhibits42: Chart on Oral - Year-over-year growth 2024-2029 (%)
- Exhibits43: Data Table on Oral - Year-over-year growth 2024-2029 (%)
- Exhibits44: Chart on Injectables - Market size and forecast 2024-2029 ($ billion)
- Exhibits45: Data Table on Injectables - Market size and forecast 2024-2029 ($ billion)
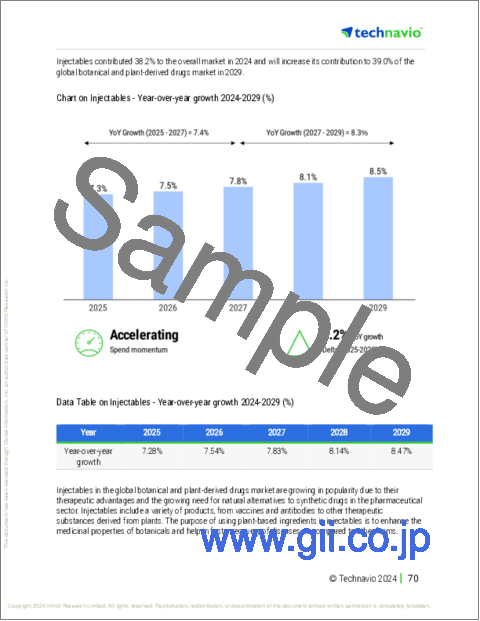
- Exhibits46: Chart on Injectables - Year-over-year growth 2024-2029 (%)
- Exhibits47: Data Table on Injectables - Year-over-year growth 2024-2029 (%)
- Exhibits48: Chart on Topicals - Market size and forecast 2024-2029 ($ billion)
- Exhibits49: Data Table on Topicals - Market size and forecast 2024-2029 ($ billion)
- Exhibits50: Chart on Topicals - Year-over-year growth 2024-2029 (%)
- Exhibits51: Data Table on Topicals - Year-over-year growth 2024-2029 (%)
- Exhibits52: Market opportunity by Type ($ billion)
- Exhibits53: Data Table on Market opportunity by Type ($ billion)
- Exhibits54: Chart on Application - Market share 2024-2029 (%)
- Exhibits55: Data Table on Application - Market share 2024-2029 (%)
- Exhibits56: Chart on Comparison by Application
- Exhibits57: Data Table on Comparison by Application
- Exhibits58: Chart on Infectious diseases - Market size and forecast 2024-2029 ($ billion)
- Exhibits59: Data Table on Infectious diseases - Market size and forecast 2024-2029 ($ billion)
- Exhibits60: Chart on Infectious diseases - Year-over-year growth 2024-2029 (%)
- Exhibits61: Data Table on Infectious diseases - Year-over-year growth 2024-2029 (%)
- Exhibits62: Chart on Central nervous system - Market size and forecast 2024-2029 ($ billion)
- Exhibits63: Data Table on Central nervous system - Market size and forecast 2024-2029 ($ billion)
- Exhibits64: Chart on Central nervous system - Year-over-year growth 2024-2029 (%)
- Exhibits65: Data Table on Central nervous system - Year-over-year growth 2024-2029 (%)
- Exhibits66: Chart on Cardiovascular diseases - Market size and forecast 2024-2029 ($ billion)
- Exhibits67: Data Table on Cardiovascular diseases - Market size and forecast 2024-2029 ($ billion)
- Exhibits68: Chart on Cardiovascular diseases - Year-over-year growth 2024-2029 (%)
- Exhibits69: Data Table on Cardiovascular diseases - Year-over-year growth 2024-2029 (%)
- Exhibits70: Chart on Respiratory diseases - Market size and forecast 2024-2029 ($ billion)
- Exhibits71: Data Table on Respiratory diseases - Market size and forecast 2024-2029 ($ billion)
- Exhibits72: Chart on Respiratory diseases - Year-over-year growth 2024-2029 (%)
- Exhibits73: Data Table on Respiratory diseases - Year-over-year growth 2024-2029 (%)
- Exhibits74: Chart on Others - Market size and forecast 2024-2029 ($ billion)
- Exhibits75: Data Table on Others - Market size and forecast 2024-2029 ($ billion)
- Exhibits76: Chart on Others - Year-over-year growth 2024-2029 (%)
- Exhibits77: Data Table on Others - Year-over-year growth 2024-2029 (%)
- Exhibits78: Market opportunity by Application ($ billion)
- Exhibits79: Data Table on Market opportunity by Application ($ billion)
- Exhibits80: Analysis of price sensitivity, lifecycle, customer purchase basket, adoption rates, and purchase criteria
- Exhibits81: Chart on Market share By Geographical Landscape 2024-2029 (%)
- Exhibits82: Data Table on Market share By Geographical Landscape 2024-2029 (%)
- Exhibits83: Chart on Geographic comparison
- Exhibits84: Data Table on Geographic comparison
- Exhibits85: Chart on Asia - Market size and forecast 2024-2029 ($ billion)
- Exhibits86: Data Table on Asia - Market size and forecast 2024-2029 ($ billion)
- Exhibits87: Chart on Asia - Year-over-year growth 2024-2029 (%)
- Exhibits88: Data Table on Asia - Year-over-year growth 2024-2029 (%)
- Exhibits89: Chart on Europe - Market size and forecast 2024-2029 ($ billion)
- Exhibits90: Data Table on Europe - Market size and forecast 2024-2029 ($ billion)
- Exhibits91: Chart on Europe - Year-over-year growth 2024-2029 (%)
- Exhibits92: Data Table on Europe - Year-over-year growth 2024-2029 (%)
- Exhibits93: Chart on North America - Market size and forecast 2024-2029 ($ billion)
- Exhibits94: Data Table on North America - Market size and forecast 2024-2029 ($ billion)
- Exhibits95: Chart on North America - Year-over-year growth 2024-2029 (%)
- Exhibits96: Data Table on North America - Year-over-year growth 2024-2029 (%)
- Exhibits97: Chart on Rest of World (ROW) - Market size and forecast 2024-2029 ($ billion)
- Exhibits98: Data Table on Rest of World (ROW) - Market size and forecast 2024-2029 ($ billion)
- Exhibits99: Chart on Rest of World (ROW) - Year-over-year growth 2024-2029 (%)
- Exhibits100: Data Table on Rest of World (ROW) - Year-over-year growth 2024-2029 (%)
- Exhibits101: Chart on US - Market size and forecast 2024-2029 ($ billion)
- Exhibits102: Data Table on US - Market size and forecast 2024-2029 ($ billion)
- Exhibits103: Chart on US - Year-over-year growth 2024-2029 (%)
- Exhibits104: Data Table on US - Year-over-year growth 2024-2029 (%)
- Exhibits105: Chart on China - Market size and forecast 2024-2029 ($ billion)
- Exhibits106: Data Table on China - Market size and forecast 2024-2029 ($ billion)
- Exhibits107: Chart on China - Year-over-year growth 2024-2029 (%)
- Exhibits108: Data Table on China - Year-over-year growth 2024-2029 (%)
- Exhibits109: Chart on Germany - Market size and forecast 2024-2029 ($ billion)
- Exhibits110: Data Table on Germany - Market size and forecast 2024-2029 ($ billion)
- Exhibits111: Chart on Germany - Year-over-year growth 2024-2029 (%)
- Exhibits112: Data Table on Germany - Year-over-year growth 2024-2029 (%)
- Exhibits113: Chart on UK - Market size and forecast 2024-2029 ($ billion)
- Exhibits114: Data Table on UK - Market size and forecast 2024-2029 ($ billion)
- Exhibits115: Chart on UK - Year-over-year growth 2024-2029 (%)
- Exhibits116: Data Table on UK - Year-over-year growth 2024-2029 (%)
- Exhibits117: Chart on Japan - Market size and forecast 2024-2029 ($ billion)
- Exhibits118: Data Table on Japan - Market size and forecast 2024-2029 ($ billion)
- Exhibits119: Chart on Japan - Year-over-year growth 2024-2029 (%)
- Exhibits120: Data Table on Japan - Year-over-year growth 2024-2029 (%)
- Exhibits121: Chart on Canada - Market size and forecast 2024-2029 ($ billion)
- Exhibits122: Data Table on Canada - Market size and forecast 2024-2029 ($ billion)
- Exhibits123: Chart on Canada - Year-over-year growth 2024-2029 (%)
- Exhibits124: Data Table on Canada - Year-over-year growth 2024-2029 (%)
- Exhibits125: Chart on India - Market size and forecast 2024-2029 ($ billion)
- Exhibits126: Data Table on India - Market size and forecast 2024-2029 ($ billion)
- Exhibits127: Chart on India - Year-over-year growth 2024-2029 (%)
- Exhibits128: Data Table on India - Year-over-year growth 2024-2029 (%)
- Exhibits129: Chart on South Korea - Market size and forecast 2024-2029 ($ billion)
- Exhibits130: Data Table on South Korea - Market size and forecast 2024-2029 ($ billion)
- Exhibits131: Chart on South Korea - Year-over-year growth 2024-2029 (%)
- Exhibits132: Data Table on South Korea - Year-over-year growth 2024-2029 (%)
- Exhibits133: Chart on France - Market size and forecast 2024-2029 ($ billion)
- Exhibits134: Data Table on France - Market size and forecast 2024-2029 ($ billion)
- Exhibits135: Chart on France - Year-over-year growth 2024-2029 (%)
- Exhibits136: Data Table on France - Year-over-year growth 2024-2029 (%)
- Exhibits137: Chart on Italy - Market size and forecast 2024-2029 ($ billion)
- Exhibits138: Data Table on Italy - Market size and forecast 2024-2029 ($ billion)
- Exhibits139: Chart on Italy - Year-over-year growth 2024-2029 (%)
- Exhibits140: Data Table on Italy - Year-over-year growth 2024-2029 (%)
- Exhibits141: Market opportunity By Geographical Landscape ($ billion)
- Exhibits142: Data Tables on Market opportunity By Geographical Landscape ($ billion)
- Exhibits143: Impact of drivers and challenges in 2024 and 2029
- Exhibits144: Overview on criticality of inputs and factors of differentiation
- Exhibits145: Overview on factors of disruption
- Exhibits146: Impact of key risks on business
- Exhibits147: Companies covered
- Exhibits148: Company ranking index
- Exhibits149: Matrix on companies position and classification
- Exhibits150: Bausch Health Companies Inc. - Overview
- Exhibits151: Bausch Health Companies Inc. - Business segments
- Exhibits152: Bausch Health Companies Inc. - Key news
- Exhibits153: Bausch Health Companies Inc. - Key offerings
- Exhibits154: Bausch Health Companies Inc. - Segment focus
- Exhibits155: SWOT
- Exhibits156: Bayer AG - Overview
- Exhibits157: Bayer AG - Business segments
- Exhibits158: Bayer AG - Key news
- Exhibits159: Bayer AG - Key offerings
- Exhibits160: Bayer AG - Segment focus
- Exhibits161: SWOT
- Exhibits162: Boehringer Ingelheim International GmbH - Overview
- Exhibits163: Boehringer Ingelheim International GmbH - Product / Service
- Exhibits164: Boehringer Ingelheim International GmbH - Key news
- Exhibits165: Boehringer Ingelheim International GmbH - Key offerings
- Exhibits166: SWOT
- Exhibits167: Devonian Health Group Inc. - Overview
- Exhibits168: Devonian Health Group Inc. - Product / Service
- Exhibits169: Devonian Health Group Inc. - Key offerings
- Exhibits170: SWOT
- Exhibits171: Dr. Willmar Schwabe GmbH and Co. KG - Overview
- Exhibits172: Dr. Willmar Schwabe GmbH and Co. KG - Product / Service
- Exhibits173: Dr. Willmar Schwabe GmbH and Co. KG - Key offerings
- Exhibits174: SWOT
- Exhibits175: F. Hoffmann La Roche Ltd. - Overview
- Exhibits176: F. Hoffmann La Roche Ltd. - Business segments
- Exhibits177: F. Hoffmann La Roche Ltd. - Key news
- Exhibits178: F. Hoffmann La Roche Ltd. - Key offerings
- Exhibits179: F. Hoffmann La Roche Ltd. - Segment focus
- Exhibits180: SWOT
- Exhibits181: Jaguar Health Inc. - Overview
- Exhibits182: Jaguar Health Inc. - Business segments
- Exhibits183: Jaguar Health Inc. - Key offerings
- Exhibits184: Jaguar Health Inc. - Segment focus
- Exhibits185: SWOT
- Exhibits186: Jazz Pharmaceuticals Plc - Overview
- Exhibits187: Jazz Pharmaceuticals Plc - Product / Service
- Exhibits188: Jazz Pharmaceuticals Plc - Key news
- Exhibits189: Jazz Pharmaceuticals Plc - Key offerings
- Exhibits190: SWOT
- Exhibits191: Merck KGaA - Overview
- Exhibits192: Merck KGaA - Business segments
- Exhibits193: Merck KGaA - Key news
- Exhibits194: Merck KGaA - Key offerings
- Exhibits195: Merck KGaA - Segment focus
- Exhibits196: SWOT
- Exhibits197: Novartis AG - Overview
- Exhibits198: Novartis AG - Business segments
- Exhibits199: Novartis AG - Key news
- Exhibits200: Novartis AG - Key offerings
- Exhibits201: Novartis AG - Segment focus
- Exhibits202: SWOT
- Exhibits203: Pfizer Inc. - Overview
- Exhibits204: Pfizer Inc. - Product / Service
- Exhibits205: Pfizer Inc. - Key news
- Exhibits206: Pfizer Inc. - Key offerings
- Exhibits207: SWOT
- Exhibits208: Pierre Fabre SA - Overview
- Exhibits209: Pierre Fabre SA - Product / Service
- Exhibits210: Pierre Fabre SA - Key offerings
- Exhibits211: SWOT
- Exhibits212: Protalix Biotherapeutics Inc. - Overview
- Exhibits213: Protalix Biotherapeutics Inc. - Product / Service
- Exhibits214: Protalix Biotherapeutics Inc. - Key offerings
- Exhibits215: SWOT
- Exhibits216: Sanofi SA - Overview
- Exhibits217: Sanofi SA - Business segments
- Exhibits218: Sanofi SA - Key news
- Exhibits219: Sanofi SA - Key offerings
- Exhibits220: Sanofi SA - Segment focus
- Exhibits221: SWOT
- Exhibits222: Sun Pharmaceutical Industries Ltd. - Overview
- Exhibits223: Sun Pharmaceutical Industries Ltd. - Product / Service
- Exhibits224: Sun Pharmaceutical Industries Ltd. - Key news
- Exhibits225: Sun Pharmaceutical Industries Ltd. - Key offerings
- Exhibits226: SWOT
- Exhibits227: Inclusions checklist
- Exhibits228: Exclusions checklist
- Exhibits229: Currency conversion rates for US$
- Exhibits230: Research methodology
- Exhibits231: Information sources
- Exhibits232: Data validation
- Exhibits233: Validation techniques employed for market sizing
- Exhibits234: Data synthesis
- Exhibits235: 360 degree market analysis
- Exhibits236: List of abbreviations
Botanical And Plant-Derived Drugs Market 2025-2029
The botanical and plant-derived drugs market is forecasted to grow by USD 18.66 bn during 2024-2029, accelerating at a CAGR of 7.4% during the forecast period. The report on the botanical and plant-derived drugs market provides a holistic analysis, market size and forecast, trends, growth drivers, and challenges, as well as vendor analysis covering around 25 vendors.
The report offers an up-to-date analysis regarding the current market scenario, the latest trends and drivers, and the overall market environment. The market is driven by rising government initiatives to promote use of plant-derived drugs, limitations associated with conventional drugs, and growing demand for effective treatment of chronic disorders.
| Market Scope | |
|---|---|
| Base Year | 2025 |
| End Year | 2029 |
| Series Year | 2025-2029 |
| Growth Momentum | Accelerate |
| YOY 2025 | 6.9% |
| CAGR | 7.4% |
| Incremental Value | $18.66 bn |
Technavio's botanical and plant-derived drugs market is segmented as below:
By Type
- Oral
- Injectables
- Topicals
By Application
- Infectious diseases
- Central nervous system
- Cardiovascular diseases
- Respiratory diseases
- Others
By Geographical Landscape
- Asia
- Europe
- North America
- Rest of World (ROW)
This study identifies the transformation of regulatory landscape in us as one of the prime reasons driving the botanical and plant-derived drugs market growth during the next few years. Also, growing focus on development of drugs for new medical fields and emergence of new entrants with innovative products will lead to sizable demand in the market.
The report on the botanical and plant-derived drugs market covers the following areas:
- Botanical And Plant-Derived Drugs Market sizing
- Botanical And Plant-Derived Drugs Market forecast
- Botanical And Plant-Derived Drugs Market industry analysis
The robust vendor analysis is designed to help clients improve their market position, and in line with this, this report provides a detailed analysis of several leading botanical and plant-derived drugs market vendors that include Bausch Health Companies Inc., Bayer AG, Boehringer Ingelheim International GmbH, Devonian Health Group Inc., Dr. Willmar Schwabe GmbH and Co. KG, F. Hoffmann La Roche Ltd., Hetero Labs Ltd., Jaguar Health Inc., Jazz Pharmaceuticals Plc, Medigene AG, Merck KGaA, Novartis AG, Pfizer Inc., Pierre Fabre SA, Protalix Biotherapeutics Inc., Riaan Wellness Pvt. Ltd., Sanofi SA, Sun Pharmaceutical Industries Ltd., and Vertex Pharmaceuticals Inc.. Also, the botanical and plant-derived drugs market analysis report includes information on upcoming trends and challenges that will influence market growth. This is to help companies strategize and leverage all forthcoming growth opportunities.
The study was conducted using an objective combination of primary and secondary information including inputs from key participants in the industry. The report contains a comprehensive market and vendor landscape in addition to an analysis of the key vendors.
The publisher presents a detailed picture of the market by the way of study, synthesis, and summation of data from multiple sources by an analysis of key parameters such as profit, pricing, competition, and promotions. It presents various market facets by identifying the key industry influencers. The data presented is comprehensive, reliable, and a result of extensive primary and secondary research. The market research reports provide a complete competitive landscape and an in-depth vendor selection methodology and analysis using qualitative and quantitative research to forecast accurate market growth.
Table of Contents
1 Executive Summary
- 1.1 Market overview
- Executive Summary - Chart on Market Overview
- Executive Summary - Data Table on Market Overview
- Executive Summary - Chart on Global Market Characteristics
- Executive Summary - Chart on Market By Geographical Landscape
- Executive Summary - Chart on Market Segmentation by Type
- Executive Summary - Chart on Market Segmentation by Application
- Executive Summary - Chart on Incremental Growth
- Executive Summary - Data Table on Incremental Growth
- Executive Summary - Chart on Company Market Positioning
2 Technavio Analysis
- 2.1 Analysis of price sensitivity, lifecycle, customer purchase basket, adoption rates, and purchase criteria
- Analysis of price sensitivity, lifecycle, customer purchase basket, adoption rates, and purchase criteria
- 2.2 Criticality of inputs and Factors of differentiation
- Overview on criticality of inputs and factors of differentiation
- 2.3 Factors of disruption
- Overview on factors of disruption
- 2.4 Impact of drivers and challenges
- Impact of drivers and challenges in 2024 and 2029
3 Market Landscape
- 3.1 Market ecosystem
- Parent Market
- Data Table on - Parent Market
- 3.2 Market characteristics
- Market characteristics analysis
- 3.3 Value chain analysis
- Value chain analysis
4 Market Sizing
- 4.1 Market definition
- Offerings of companies included in the market definition
- 4.2 Market segment analysis
- Market segments
- 4.3 Market size 2024
- 4.4 Market outlook: Forecast for 2024-2029
- Chart on Global - Market size and forecast 2024-2029 ($ billion)
- Data Table on Global - Market size and forecast 2024-2029 ($ billion)
- Chart on Global Market: Year-over-year growth 2024-2029 (%)
- Data Table on Global Market: Year-over-year growth 2024-2029 (%)
5 Historic Market Size
- 5.1 Global Botanical And Plant-Derived Drugs Market 2019 - 2023
- Historic Market Size - Data Table on Global Botanical And Plant-Derived Drugs Market 2019 - 2023 ($ billion)
- 5.2 Type segment analysis 2019 - 2023
- Historic Market Size - Type Segment 2019 - 2023 ($ billion)
- 5.3 Application segment analysis 2019 - 2023
- Historic Market Size - Application Segment 2019 - 2023 ($ billion)
- 5.4 Geography segment analysis 2019 - 2023
- Historic Market Size - Geography Segment 2019 - 2023 ($ billion)
- 5.5 Country segment analysis 2019 - 2023
- Historic Market Size - Country Segment 2019 - 2023 ($ billion)
6 Qualitative Analysis
- 6.1 Impact of AI on the global botanical and plant-derived drugs market
7 Five Forces Analysis
- 7.1 Five forces summary
- Five forces analysis - Comparison between 2024 and 2029
- 7.2 Bargaining power of buyers
- Bargaining power of buyers - Impact of key factors 2024 and 2029
- 7.3 Bargaining power of suppliers
- Bargaining power of suppliers - Impact of key factors in 2024 and 2029
- 7.4 Threat of new entrants
- Threat of new entrants - Impact of key factors in 2024 and 2029
- 7.5 Threat of substitutes
- Threat of substitutes - Impact of key factors in 2024 and 2029
- 7.6 Threat of rivalry
- Threat of rivalry - Impact of key factors in 2024 and 2029
- 7.7 Market condition
- Chart on Market condition - Five forces 2024 and 2029
8 Market Segmentation by Type
- 8.1 Market segments
- Chart on Type - Market share 2024-2029 (%)
- Data Table on Type - Market share 2024-2029 (%)
- 8.2 Comparison by Type
- Chart on Comparison by Type
- Data Table on Comparison by Type
- 8.3 Oral - Market size and forecast 2024-2029
- Chart on Oral - Market size and forecast 2024-2029 ($ billion)
- Data Table on Oral - Market size and forecast 2024-2029 ($ billion)
- Chart on Oral - Year-over-year growth 2024-2029 (%)
- Data Table on Oral - Year-over-year growth 2024-2029 (%)
- 8.4 Injectables - Market size and forecast 2024-2029
- Chart on Injectables - Market size and forecast 2024-2029 ($ billion)
- Data Table on Injectables - Market size and forecast 2024-2029 ($ billion)
- Chart on Injectables - Year-over-year growth 2024-2029 (%)
- Data Table on Injectables - Year-over-year growth 2024-2029 (%)
- 8.5 Topicals - Market size and forecast 2024-2029
- Chart on Topicals - Market size and forecast 2024-2029 ($ billion)
- Data Table on Topicals - Market size and forecast 2024-2029 ($ billion)
- Chart on Topicals - Year-over-year growth 2024-2029 (%)
- Data Table on Topicals - Year-over-year growth 2024-2029 (%)
- 8.6 Market opportunity by Type
- Market opportunity by Type ($ billion)
- Data Table on Market opportunity by Type ($ billion)
9 Market Segmentation by Application
- 9.1 Market segments
- Chart on Application - Market share 2024-2029 (%)
- Data Table on Application - Market share 2024-2029 (%)
- 9.2 Comparison by Application
- Chart on Comparison by Application
- Data Table on Comparison by Application
- 9.3 Infectious diseases - Market size and forecast 2024-2029
- Chart on Infectious diseases - Market size and forecast 2024-2029 ($ billion)
- Data Table on Infectious diseases - Market size and forecast 2024-2029 ($ billion)
- Chart on Infectious diseases - Year-over-year growth 2024-2029 (%)
- Data Table on Infectious diseases - Year-over-year growth 2024-2029 (%)
- 9.4 Central nervous system - Market size and forecast 2024-2029
- Chart on Central nervous system - Market size and forecast 2024-2029 ($ billion)
- Data Table on Central nervous system - Market size and forecast 2024-2029 ($ billion)
- Chart on Central nervous system - Year-over-year growth 2024-2029 (%)
- Data Table on Central nervous system - Year-over-year growth 2024-2029 (%)
- 9.5 Cardiovascular diseases - Market size and forecast 2024-2029
- Chart on Cardiovascular diseases - Market size and forecast 2024-2029 ($ billion)
- Data Table on Cardiovascular diseases - Market size and forecast 2024-2029 ($ billion)
- Chart on Cardiovascular diseases - Year-over-year growth 2024-2029 (%)
- Data Table on Cardiovascular diseases - Year-over-year growth 2024-2029 (%)
- 9.6 Respiratory diseases - Market size and forecast 2024-2029
- Chart on Respiratory diseases - Market size and forecast 2024-2029 ($ billion)
- Data Table on Respiratory diseases - Market size and forecast 2024-2029 ($ billion)
- Chart on Respiratory diseases - Year-over-year growth 2024-2029 (%)
- Data Table on Respiratory diseases - Year-over-year growth 2024-2029 (%)
- 9.7 Others - Market size and forecast 2024-2029
- Chart on Others - Market size and forecast 2024-2029 ($ billion)
- Data Table on Others - Market size and forecast 2024-2029 ($ billion)
- Chart on Others - Year-over-year growth 2024-2029 (%)
- Data Table on Others - Year-over-year growth 2024-2029 (%)
- 9.8 Market opportunity by Application
- Market opportunity by Application ($ billion)
- Data Table on Market opportunity by Application ($ billion)
10 Customer Landscape
- 10.1 Customer landscape overview
- Analysis of price sensitivity, lifecycle, customer purchase basket, adoption rates, and purchase criteria
11 Geographic Landscape
- 11.1 Geographic segmentation
- Chart on Market share By Geographical Landscape 2024-2029 (%)
- Data Table on Market share By Geographical Landscape 2024-2029 (%)
- 11.2 Geographic comparison
- Chart on Geographic comparison
- Data Table on Geographic comparison
- 11.3 Asia - Market size and forecast 2024-2029
- Chart on Asia - Market size and forecast 2024-2029 ($ billion)
- Data Table on Asia - Market size and forecast 2024-2029 ($ billion)
- Chart on Asia - Year-over-year growth 2024-2029 (%)
- Data Table on Asia - Year-over-year growth 2024-2029 (%)
- 11.4 Europe - Market size and forecast 2024-2029
- Chart on Europe - Market size and forecast 2024-2029 ($ billion)
- Data Table on Europe - Market size and forecast 2024-2029 ($ billion)
- Chart on Europe - Year-over-year growth 2024-2029 (%)
- Data Table on Europe - Year-over-year growth 2024-2029 (%)
- 11.5 North America - Market size and forecast 2024-2029
- Chart on North America - Market size and forecast 2024-2029 ($ billion)
- Data Table on North America - Market size and forecast 2024-2029 ($ billion)
- Chart on North America - Year-over-year growth 2024-2029 (%)
- Data Table on North America - Year-over-year growth 2024-2029 (%)
- 11.6 Rest of World (ROW) - Market size and forecast 2024-2029
- Chart on Rest of World (ROW) - Market size and forecast 2024-2029 ($ billion)
- Data Table on Rest of World (ROW) - Market size and forecast 2024-2029 ($ billion)
- Chart on Rest of World (ROW) - Year-over-year growth 2024-2029 (%)
- Data Table on Rest of World (ROW) - Year-over-year growth 2024-2029 (%)
- 11.7 US - Market size and forecast 2024-2029
- Chart on US - Market size and forecast 2024-2029 ($ billion)
- Data Table on US - Market size and forecast 2024-2029 ($ billion)
- Chart on US - Year-over-year growth 2024-2029 (%)
- Data Table on US - Year-over-year growth 2024-2029 (%)
- 11.8 China - Market size and forecast 2024-2029
- Chart on China - Market size and forecast 2024-2029 ($ billion)
- Data Table on China - Market size and forecast 2024-2029 ($ billion)
- Chart on China - Year-over-year growth 2024-2029 (%)
- Data Table on China - Year-over-year growth 2024-2029 (%)
- 11.9 Germany - Market size and forecast 2024-2029
- Chart on Germany - Market size and forecast 2024-2029 ($ billion)
- Data Table on Germany - Market size and forecast 2024-2029 ($ billion)
- Chart on Germany - Year-over-year growth 2024-2029 (%)
- Data Table on Germany - Year-over-year growth 2024-2029 (%)
- 11.10 UK - Market size and forecast 2024-2029
- Chart on UK - Market size and forecast 2024-2029 ($ billion)
- Data Table on UK - Market size and forecast 2024-2029 ($ billion)
- Chart on UK - Year-over-year growth 2024-2029 (%)
- Data Table on UK - Year-over-year growth 2024-2029 (%)
- 11.11 Japan - Market size and forecast 2024-2029
- Chart on Japan - Market size and forecast 2024-2029 ($ billion)
- Data Table on Japan - Market size and forecast 2024-2029 ($ billion)
- Chart on Japan - Year-over-year growth 2024-2029 (%)
- Data Table on Japan - Year-over-year growth 2024-2029 (%)
- 11.12 Canada - Market size and forecast 2024-2029
- Chart on Canada - Market size and forecast 2024-2029 ($ billion)
- Data Table on Canada - Market size and forecast 2024-2029 ($ billion)
- Chart on Canada - Year-over-year growth 2024-2029 (%)
- Data Table on Canada - Year-over-year growth 2024-2029 (%)
- 11.13 India - Market size and forecast 2024-2029
- Chart on India - Market size and forecast 2024-2029 ($ billion)
- Data Table on India - Market size and forecast 2024-2029 ($ billion)
- Chart on India - Year-over-year growth 2024-2029 (%)
- Data Table on India - Year-over-year growth 2024-2029 (%)
- 11.14 South Korea - Market size and forecast 2024-2029
- Chart on South Korea - Market size and forecast 2024-2029 ($ billion)
- Data Table on South Korea - Market size and forecast 2024-2029 ($ billion)
- Chart on South Korea - Year-over-year growth 2024-2029 (%)
- Data Table on South Korea - Year-over-year growth 2024-2029 (%)
- 11.15 France - Market size and forecast 2024-2029
- Chart on France - Market size and forecast 2024-2029 ($ billion)
- Data Table on France - Market size and forecast 2024-2029 ($ billion)
- Chart on France - Year-over-year growth 2024-2029 (%)
- Data Table on France - Year-over-year growth 2024-2029 (%)
- 11.16 Italy - Market size and forecast 2024-2029
- Chart on Italy - Market size and forecast 2024-2029 ($ billion)
- Data Table on Italy - Market size and forecast 2024-2029 ($ billion)
- Chart on Italy - Year-over-year growth 2024-2029 (%)
- Data Table on Italy - Year-over-year growth 2024-2029 (%)
- 11.17 Market opportunity By Geographical Landscape
- Market opportunity By Geographical Landscape ($ billion)
- Data Tables on Market opportunity By Geographical Landscape ($ billion)
12 Drivers, Challenges, and Opportunity/Restraints
- 12.1 Market drivers
- 12.2 Market challenges
- 12.3 Impact of drivers and challenges
- Impact of drivers and challenges in 2024 and 2029
- 12.4 Market opportunities/restraints
13 Competitive Landscape
- 13.1 Overview
- 13.2 Competitive Landscape
- Overview on criticality of inputs and factors of differentiation
- 13.3 Landscape disruption
- Overview on factors of disruption
- 13.4 Industry risks
- Impact of key risks on business
14 Competitive Analysis
- 14.1 Companies profiled
- Companies covered
- 14.2 Company ranking index
- Company ranking index
- 14.3 Market positioning of companies
- Matrix on companies position and classification
- 14.4 Bausch Health Companies Inc.
- Bausch Health Companies Inc. - Overview
- Bausch Health Companies Inc. - Business segments
- Bausch Health Companies Inc. - Key news
- Bausch Health Companies Inc. - Key offerings
- Bausch Health Companies Inc. - Segment focus
- SWOT
- 14.5 Bayer AG
- Bayer AG - Overview
- Bayer AG - Business segments
- Bayer AG - Key news
- Bayer AG - Key offerings
- Bayer AG - Segment focus
- SWOT
- 14.6 Boehringer Ingelheim International GmbH
- Boehringer Ingelheim International GmbH - Overview
- Boehringer Ingelheim International GmbH - Product / Service
- Boehringer Ingelheim International GmbH - Key news
- Boehringer Ingelheim International GmbH - Key offerings
- SWOT
- 14.7 Devonian Health Group Inc.
- Devonian Health Group Inc. - Overview
- Devonian Health Group Inc. - Product / Service
- Devonian Health Group Inc. - Key offerings
- SWOT
- 14.8 Dr. Willmar Schwabe GmbH and Co. KG
- Dr. Willmar Schwabe GmbH and Co. KG - Overview
- Dr. Willmar Schwabe GmbH and Co. KG - Product / Service
- Dr. Willmar Schwabe GmbH and Co. KG - Key offerings
- SWOT
- 14.9 F. Hoffmann La Roche Ltd.
- F. Hoffmann La Roche Ltd. - Overview
- F. Hoffmann La Roche Ltd. - Business segments
- F. Hoffmann La Roche Ltd. - Key news
- F. Hoffmann La Roche Ltd. - Key offerings
- F. Hoffmann La Roche Ltd. - Segment focus
- SWOT
- 14.10 Jaguar Health Inc.
- Jaguar Health Inc. - Overview
- Jaguar Health Inc. - Business segments
- Jaguar Health Inc. - Key offerings
- Jaguar Health Inc. - Segment focus
- SWOT
- 14.11 Jazz Pharmaceuticals Plc
- Jazz Pharmaceuticals Plc - Overview
- Jazz Pharmaceuticals Plc - Product / Service
- Jazz Pharmaceuticals Plc - Key news
- Jazz Pharmaceuticals Plc - Key offerings
- SWOT
- 14.12 Merck KGaA
- Merck KGaA - Overview
- Merck KGaA - Business segments
- Merck KGaA - Key news
- Merck KGaA - Key offerings
- Merck KGaA - Segment focus
- SWOT
- 14.13 Novartis AG
- Novartis AG - Overview
- Novartis AG - Business segments
- Novartis AG - Key news
- Novartis AG - Key offerings
- Novartis AG - Segment focus
- SWOT
- 14.14 Pfizer Inc.
- Pfizer Inc. - Overview
- Pfizer Inc. - Product / Service
- Pfizer Inc. - Key news
- Pfizer Inc. - Key offerings
- SWOT
- 14.15 Pierre Fabre SA
- Pierre Fabre SA - Overview
- Pierre Fabre SA - Product / Service
- Pierre Fabre SA - Key offerings
- SWOT
- 14.16 Protalix Biotherapeutics Inc.
- Protalix Biotherapeutics Inc. - Overview
- Protalix Biotherapeutics Inc. - Product / Service
- Protalix Biotherapeutics Inc. - Key offerings
- SWOT
- 14.17 Sanofi SA
- Sanofi SA - Overview
- Sanofi SA - Business segments
- Sanofi SA - Key news
- Sanofi SA - Key offerings
- Sanofi SA - Segment focus
- SWOT
- 14.18 Sun Pharmaceutical Industries Ltd.
- Sun Pharmaceutical Industries Ltd. - Overview
- Sun Pharmaceutical Industries Ltd. - Product / Service
- Sun Pharmaceutical Industries Ltd. - Key news
- Sun Pharmaceutical Industries Ltd. - Key offerings
- SWOT
15 Appendix
- 15.1 Scope of the report
- 15.2 Inclusions and exclusions checklist
- Inclusions checklist
- Exclusions checklist
- 15.3 Currency conversion rates for US$
- Currency conversion rates for US$
- 15.4 Research methodology
- Research methodology
- 15.5 Data procurement
- Information sources
- 15.6 Data validation
- Data validation
- 15.7 Validation techniques employed for market sizing
- Validation techniques employed for market sizing
- 15.8 Data synthesis
- Data synthesis
- 15.9 360 degree market analysis
- 360 degree market analysis
- 15.10 List of abbreviations
- List of abbreviations

