|
|
市場調査レポート
商品コード
1657144
ドキュメント・アウトソーシングの世界市場、2025-2029年Global Document Outsourcing Market 2025-2029 |
||||||

|
|||||||
カスタマイズ可能
|
|||||||


| ドキュメント・アウトソーシングの世界市場、2025-2029年 |
|
出版日: 2025年02月06日
発行: TechNavio
ページ情報: 英文 231 Pages
納期: 即納可能
|

全表示
- 概要
- 目次
ドキュメント・アウトソーシング市場は2024-2029年に195億米ドル、予測期間中のCAGRは5.7%で成長すると予測されます。
当レポートでは、ドキュメント・アウトソーシング市場の全体的な分析、市場規模・予測、動向、成長促進要因、課題、約25のベンダーを網羅したベンダー分析などを掲載しています。
現在の市場シナリオ、最新動向と促進要因、市場環境全体に関する最新分析を提供しています。市場を牽引しているのは、コスト削減、効率性向上、法規制対応へのニーズ、ハイブリッドソリューションによる文書管理の効率化、自動化・一元化された文書管理ソリューションへのニーズなどです。
| 市場範囲 | |
|---|---|
| 基準年 | 2025 |
| 終了年 | 2029 |
| 予測期間 | 2025-2029 |
| 成長モメンタム | 加速 |
| 前年比2025年 | 5.2% |
| CAGR | 5.7% |
| 増分額 | 195億米ドル |
本調査は、業界の主要参加者からのインプットを含め、一次情報と二次情報を客観的に組み合わせて実施しました。レポートには、主要企業の分析に加え、包括的な市場規模データ、地域別分析によるセグメント、ベンダー情勢が含まれています。レポートには過去データと予測データを掲載しています。
本調査では、今後数年間のドキュメント・アウトソーシング市場の成長を促進する主な要因の1つとして、クラウドソーシングへの嗜好の高まりを挙げています。また、ロボティック・プロセス・オートメーションを利用したアウトソーシングへの嗜好の高まりや、デジタル・メールルームのアウトソーシング・サービスの増加は、市場の大きな需要につながると思われます。
目次
第1章 エグゼクティブサマリー
- 市場概要
第2章 Technavio分析
- 価格・ライフサイクル・顧客購入バスケット・採用率・購入基準の分析
- インプットの重要性と差別化の要因
- 混乱の要因
- 促進要因と課題の影響
第3章 市場情勢
- 市場エコシステム
- 市場の特徴
- バリューチェーン分析
第4章 市場規模
- 市場の定義
- 市場セグメント分析
- 市場規模 2024
- 市場の見通し 2024-2029
第5章 市場規模実績
- ドキュメント・アウトソーシングの世界市場 2019-2023
- サービスセグメント分析 2019-2023
- エンドユーザーセグメント分析 2019-2023
- 用途別セグメント分析 2019-2023
- 地域別セグメント分析 2019-2023
- 国別セグメント分析 2019-2023
第6章 定性分析
- AIの影響:ドキュメント・アウトソーシングの世界市場
第7章 ファイブフォース分析
- ファイブフォースの要約
- 買い手の交渉力
- 供給企業の交渉力
- 新規参入業者の脅威
- 代替品の脅威
- 競争の脅威
- 市況
第8章 市場セグメンテーション:サービス別
- 市場セグメント
- 比較:サービス別
- オンサイト契約:市場規模と予測 2024-2029
- ステートメント印刷:市場規模と予測 2024-2029
- ドキュメントプロセスアウトソーシング:市場規模と予測 2024-2029
- 市場機会:サービス別
第9章 市場セグメンテーション:エンドユーザー別
- 市場セグメント
- 比較:エンドユーザー別
- 大企業:市場規模と予測 2024-2029
- 中小企業:市場規模と予測 2024-2029
- 市場機会:エンドユーザー別
第10章 市場セグメンテーション:用途別
- 市場セグメント
- 比較:用途別
- ヘルスケア:市場規模と予測 2024-2029
- それ:市場規模と予測 2024-2029
- 小売り:市場規模と予測 2024-2029
- メディア:市場規模と予測 2024-2029
- その他:市場規模と予測 2024-2029
- 市場機会:用途別
第11章 顧客情勢
- 顧客情勢の概要
第12章 地域別情勢
- 地域別セグメンテーション
- 地域別比較
- 北米:市場規模と予測 2024-2029
- 欧州:市場規模と予測 2024-2029
- アジア太平洋:市場規模と予測 2024-2029
- 南米:市場規模と予測 2024-2029
- 中東・アフリカ:市場規模と予測 2024-2029
- 米国:市場規模と予測 2024-2029
- カナダ:市場規模と予測 2024-2029
- 英国:市場規模と予測 2024-2029
- ドイツ:市場規模と予測 2024-2029
- 中国:市場規模と予測 2024-2029
- フランス:市場規模と予測 2024-2029
- イタリア:市場規模と予測 2024-2029
- オランダ:市場規模と予測 2024-2029
- 日本:市場規模と予測 2024-2029
- インド:市場規模と予測 2024-2029
- 市場機会:地域情勢別
第13章 促進要因・課題・機会・抑制要因
- 市場促進要因
- 市場の課題
- 促進要因と課題の影響
- 市場の機会・抑制要因
第14章 競合情勢
- 概要
- 競合情勢
- 混乱の状況
- 業界のリスク
第15章 競合分析
- 企業プロファイル
- 企業ランキング指数
- 企業の市場ポジショニング
- ABBYY Solutions Ltd.
- Accenture PLC
- Adreno Technologies India Pvt. Ltd.
- Canon Inc.
- Compart AG
- FUJIFILM Holdings Corp.
- HP Inc.
- Iron Mountain Inc.
- Konica Minolta Inc.
- Lexmark International Inc.
- Ricoh Co. Ltd.
- Seiko Epson Corp.
- Toshiba Tec Corp.
- Williams Lea Ltd.
- Xerox Holdings Corp.
第16章 付録
The document outsourcing market is forecasted to grow by USD 19.5 billion during 2024-2029, accelerating at a CAGR of 5.7% during the forecast period. The report on the document outsourcing market provides a holistic analysis, market size and forecast, trends, growth drivers, and challenges, as well as vendor analysis covering around 25 vendors.
The report offers an up-to-date analysis regarding the current market scenario, the latest trends and drivers, and the overall market environment. The market is driven by need for cost reduction, enhanced efficiency, and regulatory compliance, increased efficiency of document management using hybrid solutions, and need for automated and centralized document management solutions.
| Market Scope | |
|---|---|
| Base Year | 2025 |
| End Year | 2029 |
| Series Year | 2025-2029 |
| Growth Momentum | Accelerate |
| YOY 2025 | 5.2% |
| CAGR | 5.7% |
| Incremental Value | $19.5 bn |
The study was conducted using an objective combination of primary and secondary information including inputs from key participants in the industry. The report contains a comprehensive market size data, segment with regional analysis and vendor landscape in addition to an analysis of the key companies. Reports have historic and forecast data.
Technavio's document outsourcing market is segmented as below:
By Service
- Onsite contracted
- Statement printing
- DPO
By End-user
- Large companies
- Small and medium companies
By Application
- Healthcare
- IT
- Retail
- Media
- Others
By Geographical Landscape
- North America
- Europe
- APAC
- South America
- Middle East and Africa
This study identifies the increasing preference for cloud sourcing as one of the prime reasons driving the document outsourcing market growth during the next few years. Also, increasing preference for outsourcing using robotic process automation and rise in digital mailroom outsourcing services will lead to sizable demand in the market.
The report on the document outsourcing market covers the following areas:
- Document Outsourcing Market sizing
- Document Outsourcing Market forecast
- Document Outsourcing Market industry analysis
The robust vendor analysis is designed to help clients improve their market position, and in line with this, this report provides a detailed analysis of several leading document outsourcing market vendors that include ABBYY Solutions Ltd., Accenture PLC, Adreno Technologies India Pvt. Ltd., Canon Inc., Compart AG, FUJIFILM Holdings Corp., HP Inc., Imaging Business Machines LLC, Invensis Technologies Pvt. Ltd., Iron Mountain Inc., Konica Minolta Inc., Lexmark International Inc., Pitney Bowes Inc., Ricoh Co. Ltd., Seiko Epson Corp., Siemens AG, Swiss Post Ltd., Toshiba Tec Corp., Williams Lea Ltd., and Xerox Holdings Corp.. Also, the document outsourcing market analysis report includes information on upcoming trends and challenges that will influence market growth. This is to help companies strategize and leverage all forthcoming growth opportunities.
The publisher presents a detailed picture of the market by the way of study, synthesis, and summation of data from multiple sources by an analysis of key parameters such as profit, pricing, competition, and promotions. It presents various market facets by identifying the key industry influencers. The data presented is comprehensive, reliable, and a result of extensive primary and secondary research. The market research reports provide a complete competitive landscape and an in-depth vendor selection methodology and analysis using qualitative and quantitative research to forecast accurate market growth.
Table of Contents
1 Executive Summary
- 1.1 Market overview
- Executive Summary - Chart on Market Overview
- Executive Summary - Data Table on Market Overview
- Executive Summary - Chart on Global Market Characteristics
- Executive Summary - Chart on Market By Geographical Landscape
- Executive Summary - Chart on Market Segmentation by Service
- Executive Summary - Chart on Market Segmentation by End-user
- Executive Summary - Chart on Market Segmentation by Application
- Executive Summary - Chart on Incremental Growth
- Executive Summary - Data Table on Incremental Growth
- Executive Summary - Chart on Company Market Positioning
2 Technavio Analysis
- 2.1 Analysis of price sensitivity, lifecycle, customer purchase basket, adoption rates, and purchase criteria
- Analysis of price sensitivity, lifecycle, customer purchase basket, adoption rates, and purchase criteria
- 2.2 Criticality of inputs and Factors of differentiation
- Overview on criticality of inputs and factors of differentiation
- 2.3 Factors of disruption
- Overview on factors of disruption
- 2.4 Impact of drivers and challenges
- Impact of drivers and challenges in 2024 and 2029
3 Market Landscape
- 3.1 Market ecosystem
- Parent Market
- Data Table on - Parent Market
- 3.2 Market characteristics
- Market characteristics analysis
- 3.3 Value chain analysis
- Value chain analysis
4 Market Sizing
- 4.1 Market definition
- Offerings of companies included in the market definition
- 4.2 Market segment analysis
- Market segments
- 4.3 Market size 2024
- 4.4 Market outlook: Forecast for 2024-2029
- Chart on Global - Market size and forecast 2024-2029 ($ billion)
- Data Table on Global - Market size and forecast 2024-2029 ($ billion)
- Chart on Global Market: Year-over-year growth 2024-2029 (%)
- Data Table on Global Market: Year-over-year growth 2024-2029 (%)
5 Historic Market Size
- 5.1 Global Document Outsourcing Market 2019 - 2023
- Historic Market Size - Data Table on Global Document Outsourcing Market 2019 - 2023 ($ billion)
- 5.2 Service segment analysis 2019 - 2023
- Historic Market Size - Service Segment 2019 - 2023 ($ billion)
- 5.3 End-user segment analysis 2019 - 2023
- Historic Market Size - End-user Segment 2019 - 2023 ($ billion)
- 5.4 Application segment analysis 2019 - 2023
- Historic Market Size - Application Segment 2019 - 2023 ($ billion)
- 5.5 Geography segment analysis 2019 - 2023
- Historic Market Size - Geography Segment 2019 - 2023 ($ billion)
- 5.6 Country segment analysis 2019 - 2023
- Historic Market Size - Country Segment 2019 - 2023 ($ billion)
6 Qualitative Analysis
- 6.1 Impact of AI on Global Document Outsourcing Market
7 Five Forces Analysis
- 7.1 Five forces summary
- Five forces analysis - Comparison between 2024 and 2029
- 7.2 Bargaining power of buyers
- Bargaining power of buyers - Impact of key factors 2024 and 2029
- 7.3 Bargaining power of suppliers
- Bargaining power of suppliers - Impact of key factors in 2024 and 2029
- 7.4 Threat of new entrants
- Threat of new entrants - Impact of key factors in 2024 and 2029
- 7.5 Threat of substitutes
- Threat of substitutes - Impact of key factors in 2024 and 2029
- 7.6 Threat of rivalry
- Threat of rivalry - Impact of key factors in 2024 and 2029
- 7.7 Market condition
- Chart on Market condition - Five forces 2024 and 2029
8 Market Segmentation by Service
- 8.1 Market segments
- Chart on Service - Market share 2024-2029 (%)
- Data Table on Service - Market share 2024-2029 (%)
- 8.2 Comparison by Service
- Chart on Comparison by Service
- Data Table on Comparison by Service
- 8.3 Onsite contracted - Market size and forecast 2024-2029
- Chart on Onsite contracted - Market size and forecast 2024-2029 ($ billion)
- Data Table on Onsite contracted - Market size and forecast 2024-2029 ($ billion)
- Chart on Onsite contracted - Year-over-year growth 2024-2029 (%)
- Data Table on Onsite contracted - Year-over-year growth 2024-2029 (%)
- 8.4 Statement printing - Market size and forecast 2024-2029
- Chart on Statement printing - Market size and forecast 2024-2029 ($ billion)
- Data Table on Statement printing - Market size and forecast 2024-2029 ($ billion)
- Chart on Statement printing - Year-over-year growth 2024-2029 (%)
- Data Table on Statement printing - Year-over-year growth 2024-2029 (%)
- 8.5 DPO - Market size and forecast 2024-2029
- Chart on DPO - Market size and forecast 2024-2029 ($ billion)
- Data Table on DPO - Market size and forecast 2024-2029 ($ billion)
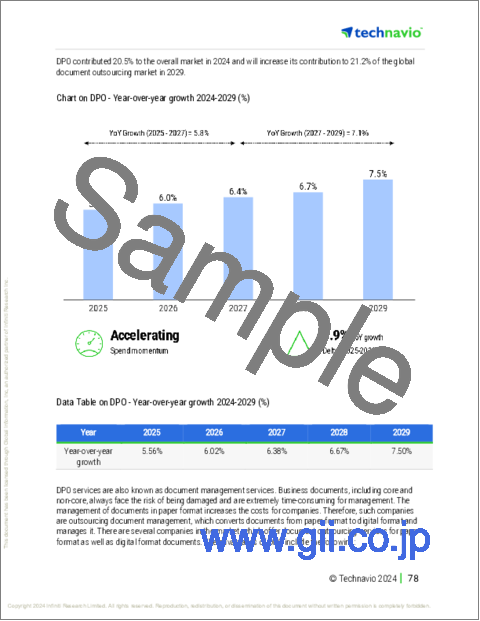
- Chart on DPO - Year-over-year growth 2024-2029 (%)
- Data Table on DPO - Year-over-year growth 2024-2029 (%)
- 8.6 Market opportunity by Service
- Market opportunity by Service ($ billion)
- Data Table on Market opportunity by Service ($ billion)
9 Market Segmentation by End-user
- 9.1 Market segments
- Chart on End-user - Market share 2024-2029 (%)
- Data Table on End-user - Market share 2024-2029 (%)
- 9.2 Comparison by End-user
- Chart on Comparison by End-user
- Data Table on Comparison by End-user
- 9.3 Large companies - Market size and forecast 2024-2029
- Chart on Large companies - Market size and forecast 2024-2029 ($ billion)
- Data Table on Large companies - Market size and forecast 2024-2029 ($ billion)
- Chart on Large companies - Year-over-year growth 2024-2029 (%)
- Data Table on Large companies - Year-over-year growth 2024-2029 (%)
- 9.4 Small and medium companies - Market size and forecast 2024-2029
- Chart on Small and medium companies - Market size and forecast 2024-2029 ($ billion)
- Data Table on Small and medium companies - Market size and forecast 2024-2029 ($ billion)
- Chart on Small and medium companies - Year-over-year growth 2024-2029 (%)
- Data Table on Small and medium companies - Year-over-year growth 2024-2029 (%)
- 9.5 Market opportunity by End-user
- Market opportunity by End-user ($ billion)
- Data Table on Market opportunity by End-user ($ billion)
10 Market Segmentation by Application
- 10.1 Market segments
- Chart on Application - Market share 2024-2029 (%)
- Data Table on Application - Market share 2024-2029 (%)
- 10.2 Comparison by Application
- Chart on Comparison by Application
- Data Table on Comparison by Application
- 10.3 Healthcare - Market size and forecast 2024-2029
- Chart on Healthcare - Market size and forecast 2024-2029 ($ billion)
- Data Table on Healthcare - Market size and forecast 2024-2029 ($ billion)
- Chart on Healthcare - Year-over-year growth 2024-2029 (%)
- Data Table on Healthcare - Year-over-year growth 2024-2029 (%)
- 10.4 IT - Market size and forecast 2024-2029
- Chart on IT - Market size and forecast 2024-2029 ($ billion)
- Data Table on IT - Market size and forecast 2024-2029 ($ billion)
- Chart on IT - Year-over-year growth 2024-2029 (%)
- Data Table on IT - Year-over-year growth 2024-2029 (%)
- 10.5 Retail - Market size and forecast 2024-2029
- Chart on Retail - Market size and forecast 2024-2029 ($ billion)
- Data Table on Retail - Market size and forecast 2024-2029 ($ billion)
- Chart on Retail - Year-over-year growth 2024-2029 (%)
- Data Table on Retail - Year-over-year growth 2024-2029 (%)
- 10.6 Media - Market size and forecast 2024-2029
- Chart on Media - Market size and forecast 2024-2029 ($ billion)
- Data Table on Media - Market size and forecast 2024-2029 ($ billion)
- Chart on Media - Year-over-year growth 2024-2029 (%)
- Data Table on Media - Year-over-year growth 2024-2029 (%)
- 10.7 Others - Market size and forecast 2024-2029
- Chart on Others - Market size and forecast 2024-2029 ($ billion)
- Data Table on Others - Market size and forecast 2024-2029 ($ billion)
- Chart on Others - Year-over-year growth 2024-2029 (%)
- Data Table on Others - Year-over-year growth 2024-2029 (%)
- 10.8 Market opportunity by Application
- Market opportunity by Application ($ billion)
- Data Table on Market opportunity by Application ($ billion)
11 Customer Landscape
- 11.1 Customer landscape overview
- Analysis of price sensitivity, lifecycle, customer purchase basket, adoption rates, and purchase criteria
12 Geographic Landscape
- 12.1 Geographic segmentation
- Chart on Market share By Geographical Landscape 2024-2029 (%)
- Data Table on Market share By Geographical Landscape 2024-2029 (%)
- 12.2 Geographic comparison
- Chart on Geographic comparison
- Data Table on Geographic comparison
- 12.3 North America - Market size and forecast 2024-2029
- Chart on North America - Market size and forecast 2024-2029 ($ billion)
- Data Table on North America - Market size and forecast 2024-2029 ($ billion)
- Chart on North America - Year-over-year growth 2024-2029 (%)
- Data Table on North America - Year-over-year growth 2024-2029 (%)
- 12.4 Europe - Market size and forecast 2024-2029
- Chart on Europe - Market size and forecast 2024-2029 ($ billion)
- Data Table on Europe - Market size and forecast 2024-2029 ($ billion)
- Chart on Europe - Year-over-year growth 2024-2029 (%)
- Data Table on Europe - Year-over-year growth 2024-2029 (%)
- 12.5 APAC - Market size and forecast 2024-2029
- Chart on APAC - Market size and forecast 2024-2029 ($ billion)
- Data Table on APAC - Market size and forecast 2024-2029 ($ billion)
- Chart on APAC - Year-over-year growth 2024-2029 (%)
- Data Table on APAC - Year-over-year growth 2024-2029 (%)
- 12.6 South America - Market size and forecast 2024-2029
- Chart on South America - Market size and forecast 2024-2029 ($ billion)
- Data Table on South America - Market size and forecast 2024-2029 ($ billion)
- Chart on South America - Year-over-year growth 2024-2029 (%)
- Data Table on South America - Year-over-year growth 2024-2029 (%)
- 12.7 Middle East and Africa - Market size and forecast 2024-2029
- Chart on Middle East and Africa - Market size and forecast 2024-2029 ($ billion)
- Data Table on Middle East and Africa - Market size and forecast 2024-2029 ($ billion)
- Chart on Middle East and Africa - Year-over-year growth 2024-2029 (%)
- Data Table on Middle East and Africa - Year-over-year growth 2024-2029 (%)
- 12.8 US - Market size and forecast 2024-2029
- Chart on US - Market size and forecast 2024-2029 ($ billion)
- Data Table on US - Market size and forecast 2024-2029 ($ billion)
- Chart on US - Year-over-year growth 2024-2029 (%)
- Data Table on US - Year-over-year growth 2024-2029 (%)
- 12.9 Canada - Market size and forecast 2024-2029
- Chart on Canada - Market size and forecast 2024-2029 ($ billion)
- Data Table on Canada - Market size and forecast 2024-2029 ($ billion)
- Chart on Canada - Year-over-year growth 2024-2029 (%)
- Data Table on Canada - Year-over-year growth 2024-2029 (%)
- 12.10 UK - Market size and forecast 2024-2029
- Chart on UK - Market size and forecast 2024-2029 ($ billion)
- Data Table on UK - Market size and forecast 2024-2029 ($ billion)
- Chart on UK - Year-over-year growth 2024-2029 (%)
- Data Table on UK - Year-over-year growth 2024-2029 (%)
- 12.11 Germany - Market size and forecast 2024-2029
- Chart on Germany - Market size and forecast 2024-2029 ($ billion)
- Data Table on Germany - Market size and forecast 2024-2029 ($ billion)
- Chart on Germany - Year-over-year growth 2024-2029 (%)
- Data Table on Germany - Year-over-year growth 2024-2029 (%)
- 12.12 China - Market size and forecast 2024-2029
- Chart on China - Market size and forecast 2024-2029 ($ billion)
- Data Table on China - Market size and forecast 2024-2029 ($ billion)
- Chart on China - Year-over-year growth 2024-2029 (%)
- Data Table on China - Year-over-year growth 2024-2029 (%)
- 12.13 France - Market size and forecast 2024-2029
- Chart on France - Market size and forecast 2024-2029 ($ billion)
- Data Table on France - Market size and forecast 2024-2029 ($ billion)
- Chart on France - Year-over-year growth 2024-2029 (%)
- Data Table on France - Year-over-year growth 2024-2029 (%)
- 12.14 Italy - Market size and forecast 2024-2029
- Chart on Italy - Market size and forecast 2024-2029 ($ billion)
- Data Table on Italy - Market size and forecast 2024-2029 ($ billion)
- Chart on Italy - Year-over-year growth 2024-2029 (%)
- Data Table on Italy - Year-over-year growth 2024-2029 (%)
- 12.15 The Netherlands - Market size and forecast 2024-2029
- Chart on The Netherlands - Market size and forecast 2024-2029 ($ billion)
- Data Table on The Netherlands - Market size and forecast 2024-2029 ($ billion)
- Chart on The Netherlands - Year-over-year growth 2024-2029 (%)
- Data Table on The Netherlands - Year-over-year growth 2024-2029 (%)
- 12.16 Japan - Market size and forecast 2024-2029
- Chart on Japan - Market size and forecast 2024-2029 ($ billion)
- Data Table on Japan - Market size and forecast 2024-2029 ($ billion)
- Chart on Japan - Year-over-year growth 2024-2029 (%)
- Data Table on Japan - Year-over-year growth 2024-2029 (%)
- 12.17 India - Market size and forecast 2024-2029
- Chart on India - Market size and forecast 2024-2029 ($ billion)
- Data Table on India - Market size and forecast 2024-2029 ($ billion)
- Chart on India - Year-over-year growth 2024-2029 (%)
- Data Table on India - Year-over-year growth 2024-2029 (%)
- 12.18 Market opportunity By Geographical Landscape
- Market opportunity By Geographical Landscape ($ billion)
- Data Tables on Market opportunity By Geographical Landscape ($ billion)
13 Drivers, Challenges, and Opportunity/Restraints
- 13.1 Market drivers
- 13.2 Market challenges
- 13.3 Impact of drivers and challenges
- Impact of drivers and challenges in 2024 and 2029
- 13.4 Market opportunities/restraints
14 Competitive Landscape
- 14.1 Overview
- 14.2 Competitive Landscape
- Overview on criticality of inputs and factors of differentiation
- 14.3 Landscape disruption
- Overview on factors of disruption
- 14.4 Industry risks
- Impact of key risks on business
15 Competitive Analysis
- 15.1 Companies profiled
- Companies covered
- 15.2 Company ranking index
- Company ranking index
- 15.3 Market positioning of companies
- Matrix on companies position and classification
- 15.4 ABBYY Solutions Ltd.
- ABBYY Solutions Ltd. - Overview
- ABBYY Solutions Ltd. - Product / Service
- ABBYY Solutions Ltd. - Key offerings
- SWOT
- 15.5 Accenture PLC
- Accenture PLC - Overview
- Accenture PLC - Business segments
- Accenture PLC - Key news
- Accenture PLC - Key offerings
- Accenture PLC - Segment focus
- SWOT
- 15.6 Adreno Technologies India Pvt. Ltd.
- Adreno Technologies India Pvt. Ltd. - Overview
- Adreno Technologies India Pvt. Ltd. - Product / Service
- Adreno Technologies India Pvt. Ltd. - Key offerings
- SWOT
- 15.7 Canon Inc.
- Canon Inc. - Overview
- Canon Inc. - Business segments
- Canon Inc. - Key news
- Canon Inc. - Key offerings
- Canon Inc. - Segment focus
- SWOT
- 15.8 Compart AG
- Compart AG - Overview
- Compart AG - Product / Service
- Compart AG - Key offerings
- SWOT
- 15.9 FUJIFILM Holdings Corp.
- FUJIFILM Holdings Corp. - Overview
- FUJIFILM Holdings Corp. - Business segments
- FUJIFILM Holdings Corp. - Key news
- FUJIFILM Holdings Corp. - Key offerings
- FUJIFILM Holdings Corp. - Segment focus
- SWOT
- 15.10 HP Inc.
- HP Inc. - Overview
- HP Inc. - Business segments
- HP Inc. - Key news
- HP Inc. - Key offerings
- HP Inc. - Segment focus
- SWOT
- 15.11 Iron Mountain Inc.
- Iron Mountain Inc. - Overview
- Iron Mountain Inc. - Business segments
- Iron Mountain Inc. - Key news
- Iron Mountain Inc. - Key offerings
- Iron Mountain Inc. - Segment focus
- SWOT
- 15.12 Konica Minolta Inc.
- Konica Minolta Inc. - Overview
- Konica Minolta Inc. - Business segments
- Konica Minolta Inc. - Key news
- Konica Minolta Inc. - Key offerings
- Konica Minolta Inc. - Segment focus
- SWOT
- 15.13 Lexmark International Inc.
- Lexmark International Inc. - Overview
- Lexmark International Inc. - Product / Service
- Lexmark International Inc. - Key news
- Lexmark International Inc. - Key offerings
- SWOT
- 15.14 Ricoh Co. Ltd.
- Ricoh Co. Ltd. - Overview
- Ricoh Co. Ltd. - Business segments
- Ricoh Co. Ltd. - Key news
- Ricoh Co. Ltd. - Key offerings
- Ricoh Co. Ltd. - Segment focus
- SWOT
- 15.15 Seiko Epson Corp.
- Seiko Epson Corp. - Overview
- Seiko Epson Corp. - Business segments
- Seiko Epson Corp. - Key news
- Seiko Epson Corp. - Key offerings
- Seiko Epson Corp. - Segment focus
- SWOT
- 15.16 Toshiba Tec Corp.
- Toshiba Tec Corp. - Overview
- Toshiba Tec Corp. - Business segments
- Toshiba Tec Corp. - Key news
- Toshiba Tec Corp. - Key offerings
- Toshiba Tec Corp. - Segment focus
- SWOT
- 15.17 Williams Lea Ltd.
- Williams Lea Ltd. - Overview
- Williams Lea Ltd. - Product / Service
- Williams Lea Ltd. - Key news
- Williams Lea Ltd. - Key offerings
- SWOT
- 15.18 Xerox Holdings Corp.
- Xerox Holdings Corp. - Overview
- Xerox Holdings Corp. - Business segments
- Xerox Holdings Corp. - Key news
- Xerox Holdings Corp. - Key offerings
- Xerox Holdings Corp. - Segment focus
- SWOT
16 Appendix
- 16.1 Scope of the report
- 16.2 Inclusions and exclusions checklist
- Inclusions checklist
- Exclusions checklist
- 16.3 Currency conversion rates for US$
- Currency conversion rates for US$
- 16.4 Research methodology
- Research methodology
- 16.5 Data procurement
- Information sources
- 16.6 Data validation
- Data validation
- 16.7 Validation techniques employed for market sizing
- Validation techniques employed for market sizing
- 16.8 Data synthesis
- Data synthesis
- 16.9 360 degree market analysis
- 360 degree market analysis
- 16.10 List of abbreviations
- List of abbreviations

