|
|
市場調査レポート
商品コード
1502264
デジタル病理検査の世界市場 2024-2028Global digital pathology market 2024-2028 |
||||||

|
|||||||
カスタマイズ可能
|
|||||||


| デジタル病理検査の世界市場 2024-2028 |
|
出版日: 2024年05月20日
発行: TechNavio
ページ情報: 英文 172 Pages
納期: 即納可能
|

全表示
- 概要
- 図表
- 目次
Technavio社は、デジタル病理検査市場をモニターしており、2023年から2028年にかけて11億2,420万米ドル、予測期間中のCAGRは16.98%で成長すると予測しています。
当レポートでは、デジタル病理検査市場の全体的な分析、市場規模・予測、動向、成長促進要因、課題、約25のベンダーを網羅したベンダー分析などを掲載しています。
現在の市場シナリオ、最新動向と促進要因、市場環境全体に関する最新分析を提供しています。市場は、検査室におけるIoTインフラの採用拡大、エンドユーザーにおける高い生産性とターンアラウンドタイムの短縮に対する需要の増加、教育およびトレーニングにおけるデジタル病理検査の大幅な採用が牽引しています。
| 市場範囲 | |
|---|---|
| 基準年 | 2024 |
| 終了年 | 2028 |
| 予測期間 | 2024-2028 |
| 成長モメンタム | 加速 |
| 前年比2024年 | 14.12% |
| CAGR | 16.98% |
| 増分額 | 11億2,420万米ドル |
本調査では、今後数年間のデジタル病理検査市場成長を牽引する主要因の1つとして、デジタル病理検査システムへのAIの統合を挙げています。また、コンパニオン診断におけるデジタル病理検査の潜在的な応用、創薬や臨床試験におけるデジタル病理検査の調査と採用は、市場の大きな需要につながります。
目次
第1章 エグゼクティブサマリー
- 市場概要
第2章 市場情勢
- 市場エコシステム
- 市場の特徴
- バリューチェーン分析
第3章 市場規模の評価
- 市場の定義
- 市場セグメント分析
- 市場規模 2023
- 市場の見通し 2023-2028
第4章 市場規模実績
- 世界デジタル病理検査市場 2018-2022
- 製品別セグメント分析 2018-2022
- 用途別セグメント分析 2018-2022
- 地域別セグメント分析 2018-2022
- 国別セグメント分析 2018-2022
第5章 ファイブフォース分析
- ファイブフォースの要約
- 買い手の交渉力
- 供給企業の交渉力
- 新規参入業者の脅威
- 代替品の脅威
- 競争の脅威
- 市況
第6章 市場セグメンテーション:製品別
- 市場セグメンテーション
- 比較:製品別
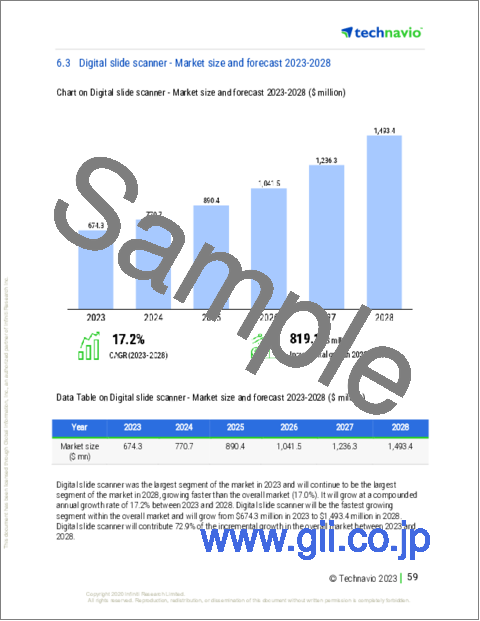
- デジタルスライドスキャナ:市場規模と予測 2023-2028
- ソフトウェア:市場規模と予測 2023-2028
- 市場機会:製品別
第7章 市場セグメンテーション:用途別
- 市場セグメンテーション
- 比較:用途別
- 病院と研究所:市場規模と予測 2023-2028
- 個人診療所や小規模診療所:市場規模と予測 2023-2028
- 研究センター:市場規模と予測 2023-2028
- 市場機会:用途別
第8章 顧客情勢
- 顧客情勢の概要
第9章 地域別情勢
- 地域別セグメンテーション
- 地域別比較
- 北米:市場規模と予測 2023-2028
- 欧州:市場規模と予測 2023-2028
- アジア:市場規模と予測 2023-2028
- 世界のその他の地域:市場規模と予測 2023-2028
- 米国:市場規模と予測 2023-2028
- 英国:市場規模と予測 2023-2028
- ドイツ:市場規模と予測 2023-2028
- フランス:市場規模と予測 2023-2028
- カナダ:市場規模と予測 2023-2028
- 市場機会:地域別
第10章 促進要因・課題・機会・抑制要因
- 市場促進要因
- 市場の課題
- 促進要因と課題の影響
- 市場の機会・抑制要因
第11章 競合情勢
- 概要
- 競合情勢
- 混乱の状況
- 業界のリスク
第12章 競合分析
- 企業プロファイル
- 企業の市場ポジショニング
- Apollo Enterprise Imaging Corp.
- Co Diagnostics Inc.
- Corista
- Danaher Corp.
- F. Hoffmann La Roche Ltd.
- General Electric Co.
- Hamamatsu Photonics KK
- Huron Digital Pathology
- Inspirata Inc.
- Koninklijke Philips N.V.
- Olympus Corp.
- Sectra AB
- Visiopharm AS
- XIFIN Inc.
第13章 付録
Exhibits:
- Exhibits1: Executive Summary - Chart on Market Overview
- Exhibits2: Executive Summary - Data Table on Market Overview
- Exhibits3: Executive Summary - Chart on Global Market Characteristics
- Exhibits4: Executive Summary - Chart on Market by Geography
- Exhibits5: Executive Summary - Chart on Market Segmentation by Product
- Exhibits6: Executive Summary - Chart on Market Segmentation by Application
- Exhibits7: Executive Summary - Chart on Incremental Growth
- Exhibits8: Executive Summary - Data Table on Incremental Growth
- Exhibits9: Executive Summary - Chart on Company Market Positioning
- Exhibits10: Parent Market
- Exhibits11: Data Table on - Parent Market
- Exhibits12: Market characteristics analysis
- Exhibits13: Value Chain Analysis
- Exhibits14: Offerings of companies included in the market definition
- Exhibits15: Market segments
- Exhibits16: Chart on Global - Market size and forecast 2023-2028 ($ million)
- Exhibits17: Data Table on Global - Market size and forecast 2023-2028 ($ million)
- Exhibits18: Chart on Global Market: Year-over-year growth 2023-2028 (%)
- Exhibits19: Data Table on Global Market: Year-over-year growth 2023-2028 (%)
- Exhibits20: Historic Market Size - Data Table on Global Digital Pathology Market 2018 - 2022 ($ million)
- Exhibits21: Historic Market Size - Product Segment 2018 - 2022 ($ million)
- Exhibits22: Historic Market Size - Application Segment 2018 - 2022 ($ million)
- Exhibits23: Historic Market Size - Geography Segment 2018 - 2022 ($ million)
- Exhibits24: Historic Market Size - Country Segment 2018 - 2022 ($ million)
- Exhibits25: Five forces analysis - Comparison between 2023 and 2028
- Exhibits26: Bargaining power of buyers - Impact of key factors 2023 and 2028
- Exhibits27: Bargaining power of suppliers - Impact of key factors in 2023 and 2028
- Exhibits28: Threat of new entrants - Impact of key factors in 2023 and 2028
- Exhibits29: Threat of substitutes - Impact of key factors in 2023 and 2028
- Exhibits30: Threat of rivalry - Impact of key factors in 2023 and 2028
- Exhibits31: Chart on Market condition - Five forces 2023 and 2028
- Exhibits32: Chart on Product - Market share 2023-2028 (%)
- Exhibits33: Data Table on Product - Market share 2023-2028 (%)
- Exhibits34: Chart on Comparison by Product
- Exhibits35: Data Table on Comparison by Product
- Exhibits36: Chart on Digital slide scanner - Market size and forecast 2023-2028 ($ million)
- Exhibits37: Data Table on Digital slide scanner - Market size and forecast 2023-2028 ($ million)
- Exhibits38: Chart on Digital slide scanner - Year-over-year growth 2023-2028 (%)
- Exhibits39: Data Table on Digital slide scanner - Year-over-year growth 2023-2028 (%)
- Exhibits40: Chart on Software - Market size and forecast 2023-2028 ($ million)
- Exhibits41: Data Table on Software - Market size and forecast 2023-2028 ($ million)
- Exhibits42: Chart on Software - Year-over-year growth 2023-2028 (%)
- Exhibits43: Data Table on Software - Year-over-year growth 2023-2028 (%)
- Exhibits44: Market opportunity by Product ($ million)
- Exhibits45: Data Table on Market opportunity by Product ($ million)
- Exhibits46: Chart on Application - Market share 2023-2028 (%)
- Exhibits47: Data Table on Application - Market share 2023-2028 (%)
- Exhibits48: Chart on Comparison by Application
- Exhibits49: Data Table on Comparison by Application
- Exhibits50: Chart on Hospitals and laboratories - Market size and forecast 2023-2028 ($ million)
- Exhibits51: Data Table on Hospitals and laboratories - Market size and forecast 2023-2028 ($ million)
- Exhibits52: Chart on Hospitals and laboratories - Year-over-year growth 2023-2028 (%)
- Exhibits53: Data Table on Hospitals and laboratories - Year-over-year growth 2023-2028 (%)
- Exhibits54: Chart on Independent and small clinics - Market size and forecast 2023-2028 ($ million)
- Exhibits55: Data Table on Independent and small clinics - Market size and forecast 2023-2028 ($ million)
- Exhibits56: Chart on Independent and small clinics - Year-over-year growth 2023-2028 (%)
- Exhibits57: Data Table on Independent and small clinics - Year-over-year growth 2023-2028 (%)
- Exhibits58: Chart on Research centers - Market size and forecast 2023-2028 ($ million)
- Exhibits59: Data Table on Research centers - Market size and forecast 2023-2028 ($ million)
- Exhibits60: Chart on Research centers - Year-over-year growth 2023-2028 (%)
- Exhibits61: Data Table on Research centers - Year-over-year growth 2023-2028 (%)
- Exhibits62: Market opportunity by Application ($ million)
- Exhibits63: Data Table on Market opportunity by Application ($ million)
- Exhibits64: Analysis of price sensitivity, lifecycle, customer purchase basket, adoption rates, and purchase criteria
- Exhibits65: Chart on Market share By Geographical Landscape2023-2028 (%)
- Exhibits66: Data Table on Market share By Geographical Landscape2023-2028 (%)
- Exhibits67: Chart on Geographic comparison
- Exhibits68: Data Table on Geographic comparison
- Exhibits69: Chart on North America - Market size and forecast 2023-2028 ($ million)
- Exhibits70: Data Table on North America - Market size and forecast 2023-2028 ($ million)
- Exhibits71: Chart on North America - Year-over-year growth 2023-2028 (%)
- Exhibits72: Data Table on North America - Year-over-year growth 2023-2028 (%)
- Exhibits73: Chart on Europe - Market size and forecast 2023-2028 ($ million)
- Exhibits74: Data Table on Europe - Market size and forecast 2023-2028 ($ million)
- Exhibits75: Chart on Europe - Year-over-year growth 2023-2028 (%)
- Exhibits76: Data Table on Europe - Year-over-year growth 2023-2028 (%)
- Exhibits77: Chart on Asia - Market size and forecast 2023-2028 ($ million)
- Exhibits78: Data Table on Asia - Market size and forecast 2023-2028 ($ million)
- Exhibits79: Chart on Asia - Year-over-year growth 2023-2028 (%)
- Exhibits80: Data Table on Asia - Year-over-year growth 2023-2028 (%)
- Exhibits81: Chart on Rest of World (ROW) - Market size and forecast 2023-2028 ($ million)
- Exhibits82: Data Table on Rest of World (ROW) - Market size and forecast 2023-2028 ($ million)
- Exhibits83: Chart on Rest of World (ROW) - Year-over-year growth 2023-2028 (%)
- Exhibits84: Data Table on Rest of World (ROW) - Year-over-year growth 2023-2028 (%)
- Exhibits85: Chart on US - Market size and forecast 2023-2028 ($ million)
- Exhibits86: Data Table on US - Market size and forecast 2023-2028 ($ million)
- Exhibits87: Chart on US - Year-over-year growth 2023-2028 (%)
- Exhibits88: Data Table on US - Year-over-year growth 2023-2028 (%)
- Exhibits89: Chart on UK - Market size and forecast 2023-2028 ($ million)
- Exhibits90: Data Table on UK - Market size and forecast 2023-2028 ($ million)
- Exhibits91: Chart on UK - Year-over-year growth 2023-2028 (%)
- Exhibits92: Data Table on UK - Year-over-year growth 2023-2028 (%)
- Exhibits93: Chart on Germany - Market size and forecast 2023-2028 ($ million)
- Exhibits94: Data Table on Germany - Market size and forecast 2023-2028 ($ million)
- Exhibits95: Chart on Germany - Year-over-year growth 2023-2028 (%)
- Exhibits96: Data Table on Germany - Year-over-year growth 2023-2028 (%)
- Exhibits97: Chart on France - Market size and forecast 2023-2028 ($ million)
- Exhibits98: Data Table on France - Market size and forecast 2023-2028 ($ million)
- Exhibits99: Chart on France - Year-over-year growth 2023-2028 (%)
- Exhibits100: Data Table on France - Year-over-year growth 2023-2028 (%)
- Exhibits101: Chart on Canada - Market size and forecast 2023-2028 ($ million)
- Exhibits102: Data Table on Canada - Market size and forecast 2023-2028 ($ million)
- Exhibits103: Chart on Canada - Year-over-year growth 2023-2028 (%)
- Exhibits104: Data Table on Canada - Year-over-year growth 2023-2028 (%)
- Exhibits105: Market opportunity By Geographical Landscape($ million)
- Exhibits106: Data Tables on Market opportunity By Geographical Landscape($ million)
- Exhibits107: Impact of drivers and challenges in 2023 and 2028
- Exhibits108: Overview on criticality of inputs and factors of differentiation
- Exhibits109: Overview on factors of disruption
- Exhibits110: Impact of key risks on business
- Exhibits111: Companies covered
- Exhibits112: Matrix on companies position and classification
- Exhibits113: 3DHISTECH Ltd. - Overview
- Exhibits114: 3DHISTECH Ltd. - Product / Service
- Exhibits115: 3DHISTECH Ltd. - Key news
- Exhibits116: 3DHISTECH Ltd. - Key offerings
- Exhibits117: Apollo Enterprise Imaging Corp. - Overview
- Exhibits118: Apollo Enterprise Imaging Corp. - Product / Service
- Exhibits119: Apollo Enterprise Imaging Corp. - Key news
- Exhibits120: Apollo Enterprise Imaging Corp. - Key offerings
- Exhibits121: Co Diagnostics Inc. - Overview
- Exhibits122: Co Diagnostics Inc. - Product / Service
- Exhibits123: Co Diagnostics Inc. - Key offerings
- Exhibits124: Corista - Overview
- Exhibits125: Corista - Product / Service
- Exhibits126: Corista - Key news
- Exhibits127: Corista - Key offerings
- Exhibits128: Danaher Corp. - Overview
- Exhibits129: Danaher Corp. - Business segments
- Exhibits130: Danaher Corp. - Key news
- Exhibits131: Danaher Corp. - Key offerings
- Exhibits132: Danaher Corp. - Segment focus
- Exhibits133: F. Hoffmann La Roche Ltd. - Overview
- Exhibits134: F. Hoffmann La Roche Ltd. - Business segments
- Exhibits135: F. Hoffmann La Roche Ltd. - Key news
- Exhibits136: F. Hoffmann La Roche Ltd. - Key offerings
- Exhibits137: F. Hoffmann La Roche Ltd. - Segment focus
- Exhibits138: General Electric Co. - Overview
- Exhibits139: General Electric Co. - Business segments
- Exhibits140: General Electric Co. - Key news
- Exhibits141: General Electric Co. - Key offerings
- Exhibits142: General Electric Co. - Segment focus
- Exhibits143: Hamamatsu Photonics KK - Overview
- Exhibits144: Hamamatsu Photonics KK - Business segments
- Exhibits145: Hamamatsu Photonics KK - Key news
- Exhibits146: Hamamatsu Photonics KK - Key offerings
- Exhibits147: Hamamatsu Photonics KK - Segment focus
- Exhibits148: Huron Digital Pathology - Overview
- Exhibits149: Huron Digital Pathology - Product / Service
- Exhibits150: Huron Digital Pathology - Key offerings
- Exhibits151: Inspirata Inc. - Overview
- Exhibits152: Inspirata Inc. - Product / Service
- Exhibits153: Inspirata Inc. - Key offerings
- Exhibits154: Koninklijke Philips N.V. - Overview
- Exhibits155: Koninklijke Philips N.V. - Business segments
- Exhibits156: Koninklijke Philips N.V. - Key news
- Exhibits157: Koninklijke Philips N.V. - Key offerings
- Exhibits158: Koninklijke Philips N.V. - Segment focus
- Exhibits159: Olympus Corp. - Overview
- Exhibits160: Olympus Corp. - Business segments
- Exhibits161: Olympus Corp. - Key news
- Exhibits162: Olympus Corp. - Key offerings
- Exhibits163: Olympus Corp. - Segment focus
- Exhibits164: Sectra AB - Overview
- Exhibits165: Sectra AB - Business segments
- Exhibits166: Sectra AB - Key news
- Exhibits167: Sectra AB - Key offerings
- Exhibits168: Sectra AB - Segment focus
- Exhibits169: Visiopharm AS - Overview
- Exhibits170: Visiopharm AS - Product / Service
- Exhibits171: Visiopharm AS - Key news
- Exhibits172: Visiopharm AS - Key offerings
- Exhibits173: XIFIN Inc. - Overview
- Exhibits174: XIFIN Inc. - Product / Service
- Exhibits175: XIFIN Inc. - Key news
- Exhibits176: XIFIN Inc. - Key offerings
- Exhibits177: Inclusions checklist
- Exhibits178: Exclusions checklist
- Exhibits179: Currency conversion rates for US$
- Exhibits180: Research methodology
- Exhibits181: Information sources
- Exhibits182: Data validation
- Exhibits183: Validation techniques employed for market sizing
- Exhibits184: Data synthesis
- Exhibits185: 360 degree market analysis
- Exhibits186: List of abbreviations
Technavio has been monitoring the digital pathology market and is forecast to grow by USD 1124.2 mn during 2023-2028, accelerating at a CAGR of 16.98% during the forecast period. Our report on the digital pathology market provides a holistic analysis, market size and forecast, trends, growth drivers, and challenges, as well as vendor analysis covering around 25 vendors.
The report offers an up-to-date analysis regarding the current market scenario, the latest trends and drivers, and the overall market environment. The market is driven by growing adoption of IoT infrastructure among laboratories, increasing demand for high productivity and reduced turnaround time among end-users, and significant adoption of digital pathology in education and training.
Technavio's digital pathology market is segmented as below:
| Market Scope | |
|---|---|
| Base Year | 2024 |
| End Year | 2028 |
| Series Year | 2024-2028 |
| Growth Momentum | Accelerate |
| YOY 2024 | 14.12% |
| CAGR | 16.98% |
| Incremental Value | $1124.2mn |
By Product
- Digital slide scanner
- Software
By Application
- Hospitals and laboratories
- Independent and small clinics
- Research centers
By Geography
- North America
- Europe
- Asia
- Rest of World (ROW)
This study identifies the integration of AI into digital pathology systems as one of the prime reasons driving the digital pathology market growth during the next few years. Also, potential applications of digital pathology in companion diagnostics and the research and adoption of digital pathology in drug discovery and clinical trials will lead to sizable demand in the market.
Technavio presents a detailed picture of the market by the way of study, synthesis, and summation of data from multiple sources by an analysis of key parameters. Our report on the digital pathology market covers the following areas:
- Digital pathology market sizing
- Digital pathology market forecast
- Digital pathology market industry analysis
Technavio's robust vendor analysis is designed to help clients improve their market position, and in line with this, this report provides a detailed analysis of several leading digital pathology market vendors that include 3DHISTECH Ltd., Apollo Enterprise Imaging Corp., Co Diagnostics Inc., Corista, Danaher Corp., F. Hoffmann La Roche Ltd., General Electric Co., Hamamatsu Photonics KK, Huron Digital Pathology, Indica Labs Inc., Inspirata Inc., Kanteron Systems SLU, Koninklijke Philips N.V., Mikroscan Technologies Inc., Objective Pathology Services, Olympus Corp., Proscia Inc., Sectra AB, Visiopharm AS, and XIFIN Inc.. Also, the digital pathology market analysis report includes information on upcoming trends and challenges that will influence market growth. This is to help companies strategize and leverage all forthcoming growth opportunities.
The study was conducted using an objective combination of primary and secondary information including inputs from key participants in the industry. The report contains a comprehensive market and vendor landscape in addition to an analysis of the key vendors.
Technavio presents a detailed picture of the market by the way of study, synthesis, and summation of data from multiple sources by an analysis of key parameters such as profit, pricing, competition, and promotions. It presents various market facets by identifying the key industry influencers. The data presented is comprehensive, reliable, and a result of extensive research - both primary and secondary. Technavio's market research reports provide a complete competitive landscape and an in-depth vendor selection methodology and analysis using qualitative and quantitative research to forecast accurate market growth.
Table of Contents
1 Executive Summary
- 1.1 Market overview
- Executive Summary - Chart on Market Overview
- Executive Summary - Data Table on Market Overview
- Executive Summary - Chart on Global Market Characteristics
- Executive Summary - Chart on Market by Geography
- Executive Summary - Chart on Market Segmentation by Product
- Executive Summary - Chart on Market Segmentation by Application
- Executive Summary - Chart on Incremental Growth
- Executive Summary - Data Table on Incremental Growth
- Executive Summary - Chart on Company Market Positioning
2 Market Landscape
- 2.1 Market ecosystem
- Parent Market
- Data Table on - Parent Market
- 2.2 Market characteristics
- Market characteristics analysis
- 2.3 Value chain analysis
- Value Chain Analysis
3 Market Sizing
- 3.1 Market definition
- Offerings of companies included in the market definition
- 3.2 Market segment analysis
- Market segments
- 3.3 Market size 2023
- 3.4 Market outlook: Forecast for 2023-2028
- Chart on Global - Market size and forecast 2023-2028 ($ million)
- Data Table on Global - Market size and forecast 2023-2028 ($ million)
- Chart on Global Market: Year-over-year growth 2023-2028 (%)
- Data Table on Global Market: Year-over-year growth 2023-2028 (%)
4 Historic Market Size
- 4.1 Global Digital Pathology Market 2018 - 2022
- Historic Market Size - Data Table on Global Digital Pathology Market 2018 - 2022 ($ million)
- 4.2 Product segment analysis 2018 - 2022
- Historic Market Size - Product Segment 2018 - 2022 ($ million)
- 4.3 Application segment analysis 2018 - 2022
- Historic Market Size - Application Segment 2018 - 2022 ($ million)
- 4.4 Geography segment analysis 2018 - 2022
- Historic Market Size - Geography Segment 2018 - 2022 ($ million)
- 4.5 Country segment analysis 2018 - 2022
- Historic Market Size - Country Segment 2018 - 2022 ($ million)
5 Five Forces Analysis
- 5.1 Five forces summary
- Five forces analysis - Comparison between 2023 and 2028
- 5.2 Bargaining power of buyers
- Bargaining power of buyers - Impact of key factors 2023 and 2028
- 5.3 Bargaining power of suppliers
- Bargaining power of suppliers - Impact of key factors in 2023 and 2028
- 5.4 Threat of new entrants
- Threat of new entrants - Impact of key factors in 2023 and 2028
- 5.5 Threat of substitutes
- Threat of substitutes - Impact of key factors in 2023 and 2028
- 5.6 Threat of rivalry
- Threat of rivalry - Impact of key factors in 2023 and 2028
- 5.7 Market condition
- Chart on Market condition - Five forces 2023 and 2028
6 Market Segmentation by Product
- 6.1 Market segments
- Chart on Product - Market share 2023-2028 (%)
- Data Table on Product - Market share 2023-2028 (%)
- 6.2 Comparison by Product
- Chart on Comparison by Product
- Data Table on Comparison by Product
- 6.3 Digital slide scanner - Market size and forecast 2023-2028
- Chart on Digital slide scanner - Market size and forecast 2023-2028 ($ million)
- Data Table on Digital slide scanner - Market size and forecast 2023-2028 ($ million)
- Chart on Digital slide scanner - Year-over-year growth 2023-2028 (%)
- Data Table on Digital slide scanner - Year-over-year growth 2023-2028 (%)
- 6.4 Software - Market size and forecast 2023-2028
- Chart on Software - Market size and forecast 2023-2028 ($ million)
- Data Table on Software - Market size and forecast 2023-2028 ($ million)
- Chart on Software - Year-over-year growth 2023-2028 (%)
- Data Table on Software - Year-over-year growth 2023-2028 (%)
- 6.5 Market opportunity by Product
- Market opportunity by Product ($ million)
- Data Table on Market opportunity by Product ($ million)
7 Market Segmentation by Application
- 7.1 Market segments
- Chart on Application - Market share 2023-2028 (%)
- Data Table on Application - Market share 2023-2028 (%)
- 7.2 Comparison by Application
- Chart on Comparison by Application
- Data Table on Comparison by Application
- 7.3 Hospitals and laboratories - Market size and forecast 2023-2028
- Chart on Hospitals and laboratories - Market size and forecast 2023-2028 ($ million)
- Data Table on Hospitals and laboratories - Market size and forecast 2023-2028 ($ million)
- Chart on Hospitals and laboratories - Year-over-year growth 2023-2028 (%)
- Data Table on Hospitals and laboratories - Year-over-year growth 2023-2028 (%)
- 7.4 Independent and small clinics - Market size and forecast 2023-2028
- Chart on Independent and small clinics - Market size and forecast 2023-2028 ($ million)
- Data Table on Independent and small clinics - Market size and forecast 2023-2028 ($ million)
- Chart on Independent and small clinics - Year-over-year growth 2023-2028 (%)
- Data Table on Independent and small clinics - Year-over-year growth 2023-2028 (%)
- 7.5 Research centers - Market size and forecast 2023-2028
- Chart on Research centers - Market size and forecast 2023-2028 ($ million)
- Data Table on Research centers - Market size and forecast 2023-2028 ($ million)
- Chart on Research centers - Year-over-year growth 2023-2028 (%)
- Data Table on Research centers - Year-over-year growth 2023-2028 (%)
- 7.6 Market opportunity by Application
- Market opportunity by Application ($ million)
- Data Table on Market opportunity by Application ($ million)
8 Customer Landscape
- 8.1 Customer landscape overview
- Analysis of price sensitivity, lifecycle, customer purchase basket, adoption rates, and purchase criteria
9 Geographic Landscape
- 9.1 Geographic segmentation
- Chart on Market share By Geographical Landscape2023-2028 (%)
- Data Table on Market share By Geographical Landscape2023-2028 (%)
- 9.2 Geographic comparison
- Chart on Geographic comparison
- Data Table on Geographic comparison
- 9.3 North America - Market size and forecast 2023-2028
- Chart on North America - Market size and forecast 2023-2028 ($ million)
- Data Table on North America - Market size and forecast 2023-2028 ($ million)
- Chart on North America - Year-over-year growth 2023-2028 (%)
- Data Table on North America - Year-over-year growth 2023-2028 (%)
- 9.4 Europe - Market size and forecast 2023-2028
- Chart on Europe - Market size and forecast 2023-2028 ($ million)
- Data Table on Europe - Market size and forecast 2023-2028 ($ million)
- Chart on Europe - Year-over-year growth 2023-2028 (%)
- Data Table on Europe - Year-over-year growth 2023-2028 (%)
- 9.5 Asia - Market size and forecast 2023-2028
- Chart on Asia - Market size and forecast 2023-2028 ($ million)
- Data Table on Asia - Market size and forecast 2023-2028 ($ million)
- Chart on Asia - Year-over-year growth 2023-2028 (%)
- Data Table on Asia - Year-over-year growth 2023-2028 (%)
- 9.6 Rest of World (ROW) - Market size and forecast 2023-2028
- Chart on Rest of World (ROW) - Market size and forecast 2023-2028 ($ million)
- Data Table on Rest of World (ROW) - Market size and forecast 2023-2028 ($ million)
- Chart on Rest of World (ROW) - Year-over-year growth 2023-2028 (%)
- Data Table on Rest of World (ROW) - Year-over-year growth 2023-2028 (%)
- 9.7 US - Market size and forecast 2023-2028
- Chart on US - Market size and forecast 2023-2028 ($ million)
- Data Table on US - Market size and forecast 2023-2028 ($ million)
- Chart on US - Year-over-year growth 2023-2028 (%)
- Data Table on US - Year-over-year growth 2023-2028 (%)
- 9.8 UK - Market size and forecast 2023-2028
- Chart on UK - Market size and forecast 2023-2028 ($ million)
- Data Table on UK - Market size and forecast 2023-2028 ($ million)
- Chart on UK - Year-over-year growth 2023-2028 (%)
- Data Table on UK - Year-over-year growth 2023-2028 (%)
- 9.9 Germany - Market size and forecast 2023-2028
- Chart on Germany - Market size and forecast 2023-2028 ($ million)
- Data Table on Germany - Market size and forecast 2023-2028 ($ million)
- Chart on Germany - Year-over-year growth 2023-2028 (%)
- Data Table on Germany - Year-over-year growth 2023-2028 (%)
- 9.10 France - Market size and forecast 2023-2028
- Chart on France - Market size and forecast 2023-2028 ($ million)
- Data Table on France - Market size and forecast 2023-2028 ($ million)
- Chart on France - Year-over-year growth 2023-2028 (%)
- Data Table on France - Year-over-year growth 2023-2028 (%)
- 9.11 Canada - Market size and forecast 2023-2028
- Chart on Canada - Market size and forecast 2023-2028 ($ million)
- Data Table on Canada - Market size and forecast 2023-2028 ($ million)
- Chart on Canada - Year-over-year growth 2023-2028 (%)
- Data Table on Canada - Year-over-year growth 2023-2028 (%)
- 9.12 Market opportunity by geography
- Market opportunity By Geographical Landscape($ million)
- Data Tables on Market opportunity By Geographical Landscape($ million)
10 Drivers, Challenges, and Opportunity/Restraints
- 10.1 Market drivers
- 10.2 Market challenges
- 10.3 Impact of drivers and challenges
- Impact of drivers and challenges in 2023 and 2028
- 10.4 Market opportunities/restraints
11 Competitive Landscape
- 11.1 Overview
- 11.2 Competitive Landscape
- Overview on criticality of inputs and factors of differentiation
- 11.3 Landscape disruption
- Overview on factors of disruption
- 11.4 Industry risks
- Impact of key risks on business
12 Competitive Analysis
- 12.1 Companies profiled
- Companies covered
- 12.2 Market positioning of companies
- Matrix on companies position and classification
- 3DHISTECH Ltd.
- 3DHISTECH Ltd. - Overview
- 3DHISTECH Ltd. - Product / Service
- 3DHISTECH Ltd. - Key news
- 3DHISTECH Ltd. - Key offerings
- 12.4 Apollo Enterprise Imaging Corp.
- Apollo Enterprise Imaging Corp. - Overview
- Apollo Enterprise Imaging Corp. - Product / Service
- Apollo Enterprise Imaging Corp. - Key news
- Apollo Enterprise Imaging Corp. - Key offerings
- 12.5 Co Diagnostics Inc.
- Co Diagnostics Inc. - Overview
- Co Diagnostics Inc. - Product / Service
- Co Diagnostics Inc. - Key offerings
- 12.6 Corista
- Corista - Overview
- Corista - Product / Service
- Corista - Key news
- Corista - Key offerings
- 12.7 Danaher Corp.
- Danaher Corp. - Overview
- Danaher Corp. - Business segments
- Danaher Corp. - Key news
- Danaher Corp. - Key offerings
- Danaher Corp. - Segment focus
- 12.8 F. Hoffmann La Roche Ltd.
- F. Hoffmann La Roche Ltd. - Overview
- F. Hoffmann La Roche Ltd. - Business segments
- F. Hoffmann La Roche Ltd. - Key news
- F. Hoffmann La Roche Ltd. - Key offerings
- F. Hoffmann La Roche Ltd. - Segment focus
- 12.9 General Electric Co.
- General Electric Co. - Overview
- General Electric Co. - Business segments
- General Electric Co. - Key news
- General Electric Co. - Key offerings
- General Electric Co. - Segment focus
- 12.10 Hamamatsu Photonics KK
- Hamamatsu Photonics KK - Overview
- Hamamatsu Photonics KK - Business segments
- Hamamatsu Photonics KK - Key news
- Hamamatsu Photonics KK - Key offerings
- Hamamatsu Photonics KK - Segment focus
- 12.11 Huron Digital Pathology
- Huron Digital Pathology - Overview
- Huron Digital Pathology - Product / Service
- Huron Digital Pathology - Key offerings
- 12.12 Inspirata Inc.
- Inspirata Inc. - Overview
- Inspirata Inc. - Product / Service
- Inspirata Inc. - Key offerings
- 12.13 Koninklijke Philips N.V.
- Koninklijke Philips N.V. - Overview
- Koninklijke Philips N.V. - Business segments
- Koninklijke Philips N.V. - Key news
- Koninklijke Philips N.V. - Key offerings
- Koninklijke Philips N.V. - Segment focus
- 12.14 Olympus Corp.
- Olympus Corp. - Overview
- Olympus Corp. - Business segments
- Olympus Corp. - Key news
- Olympus Corp. - Key offerings
- Olympus Corp. - Segment focus
- 12.15 Sectra AB
- Sectra AB - Overview
- Sectra AB - Business segments
- Sectra AB - Key news
- Sectra AB - Key offerings
- Sectra AB - Segment focus
- 12.16 Visiopharm AS
- Visiopharm AS - Overview
- Visiopharm AS - Product / Service
- Visiopharm AS - Key news
- Visiopharm AS - Key offerings
- 12.17 XIFIN Inc.
- XIFIN Inc. - Overview
- XIFIN Inc. - Product / Service
- XIFIN Inc. - Key news
- XIFIN Inc. - Key offerings
13 Appendix
- 13.1 Scope of the report
- 13.2 Inclusions and exclusions checklist
- Inclusions checklist
- Exclusions checklist
- 13.3 Currency conversion rates for US$
- Currency conversion rates for US$
- 13.4 Research methodology
- Research methodology
- 13.5 Data procurement
- Information sources
- 13.6 Data validation
- Data validation
- 13.7 Validation techniques employed for market sizing
- Validation techniques employed for market sizing
- 13.8 Data synthesis
- Data synthesis
- 13.9 360 degree market analysis
- 360 degree market analysis
- 13.10 List of abbreviations
- List of abbreviations

