|
|
市場調査レポート
商品コード
1515737
自動データキャプチャ(ADC)の世界市場 2024-2028Global automatic data capture (ADC) market 2024-2028 |
||||||
|
|||||||
カスタマイズ可能
|
|||||||

| 自動データキャプチャ(ADC)の世界市場 2024-2028 |
|
出版日: 2024年06月12日
発行: TechNavio
ページ情報: 英文 191 Pages
納期: 即納可能
|

全表示
- 概要
- 図表
- 目次
自動データキャプチャ(ADC)市場は2023-2028年に486億8,550万米ドル、予測期間中のCAGRは13.64%で成長すると予測されます。
当レポートでは、自動データキャプチャ(ADC)市場の全体的な分析、市場規模・予測、動向、成長促進要因、課題、約25のベンダーを網羅したベンダー分析などを掲載しています。
現在の市場シナリオ、最新動向と促進要因、市場環境全体に関する最新分析を提供しています。RFIDの適用拡大、より優れた在庫管理システムに対する需要の高まり、二次元バーコードの採用拡大などが市場を牽引しています。
| 市場範囲 | |
|---|---|
| 基準年 | 2024 |
| 終了年 | 2028 |
| 予測期間 | 2024-2028 |
| 成長モメンタム | 加速 |
| 前年比2024年 | 11.73% |
| CAGR | 13.64% |
| 増分額 | 486億8,550万米ドル |
本調査では、今後数年間の自動データキャプチャ(ADC)市場成長を牽引する主要因の1つとして、スマート工場の普及拡大を挙げています。また、ビッグデータの人気の高まりと2Dウェアラブルスキャナへの高い需要が市場の大きな需要につながります。
目次
第1章 エグゼクティブサマリー
- 市場概要
第2章 市場情勢
- 市場エコシステム
- 市場の特徴
- バリューチェーン分析
第3章 市場規模の評価
- 市場の定義
- 市場セグメント分析
- 市場規模 2023
- 市場の見通し 2023-2028
第4章 市場規模実績
- 世界自動データキャプチャ(ADC)市場 2018-2022
- 製別品セグメント分析 2018-2022
- 用途別セグメント分析 2018-2022
- 地域別セグメント分析 2018-2022
- 国別セグメント分析 2018-2022
第5章 ファイブフォース分析
- ファイブフォースの要約
- 買い手の交渉力
- 供給企業の交渉力
- 新規参入業者の脅威
- 代替品の脅威
- 競争の脅威
- 市況
第6章 市場セグメンテーション:製品別
- 市場セグメンテーション
- 比較:製品別
- RFID:市場規模と予測 2023-2028
- バーコードスキャナ:市場規模と予測 2023-2028
- バーコードプリンター:市場規模と予測 2023-2028
- ウェアラブルスキャナ:市場規模と予測 2023-2028
- 市場機会:製品別
第7章 市場セグメンテーション:用途別
- 市場セグメンテーション
- 比較:用途別
- 産業:市場規模と予測 2023-2028
- 経済的安全:市場規模と予測 2023-2028
- 小売り:市場規模と予測 2023-2028
- T&L:市場規模と予測 2023-2028
- その他:市場規模と予測 2023-2028
- 市場機会:用途別
第8章 顧客情勢
- 顧客情勢の概要
第9章 地域別情勢
- 地域別セグメンテーション
- 地域別比較
- 北米:市場規模と予測 2023-2028
- アジア太平洋:市場規模と予測 2023-2028
- 欧州:市場規模と予測 2023-2028
- 南米:市場規模と予測 2023-2028
- 中東・アフリカ:市場規模と予測 2023-2028
- 米国:市場規模と予測 2023-2028
- 中国:市場規模と予測 2023-2028
- 英国:市場規模と予測 2023-2028
- ドイツ:市場規模と予測 2023-2028
- フランス:市場規模と予測 2023-2028
- 市場機会:地域情勢別
第10章 促進要因・課題・機会・抑制要因
- 市場促進要因
- 市場の課題
- 促進要因と課題の影響
- 市場の機会・抑制要因
第11章 競合情勢
- 概要
- 競合情勢
- 混乱の状況
- 業界のリスク
第12章 競合分析
- 企業プロファイル
- 企業の市場ポジショニング
- Alien Technology LLC
- Avery Dennison Corp.
- B O S Better Online Solutions Ltd.
- Bluebird Inc.
- Cognex Corp.
- Datalogic Spa
- Honeywell International Inc.
- Janam Technologies LLC
- Newland Europe BV
- OMRON Corp.
- Panasonic Holdings Corp.
- SATO Holdings Corp.
- TSC Auto ID Technology Co. Ltd.
- Unitech Computer Co. Ltd.
- Zebra Technologies Corp.
第13章 付録
Exhibits:
- Exhibits1: Executive Summary - Chart on Market Overview
- Exhibits2: Executive Summary - Data Table on Market Overview
- Exhibits3: Executive Summary - Chart on Global Market Characteristics
- Exhibits4: Executive Summary - Chart on Market By Geographical Landscape
- Exhibits5: Executive Summary - Chart on Market Segmentation by Product
- Exhibits6: Executive Summary - Chart on Market Segmentation by Application
- Exhibits7: Executive Summary - Chart on Incremental Growth
- Exhibits8: Executive Summary - Data Table on Incremental Growth
- Exhibits9: Executive Summary - Chart on Company Market Positioning
- Exhibits10: Parent Market
- Exhibits11: Data Table on - Parent Market
- Exhibits12: Market characteristics analysis
- Exhibits13: Value Chain Analysis
- Exhibits14: Offerings of companies included in the market definition
- Exhibits15: Market segments
- Exhibits16: Chart on Global - Market size and forecast 2023-2028 ($ million)
- Exhibits17: Data Table on Global - Market size and forecast 2023-2028 ($ million)
- Exhibits18: Chart on Global Market: Year-over-year growth 2023-2028 (%)
- Exhibits19: Data Table on Global Market: Year-over-year growth 2023-2028 (%)
- Exhibits20: Historic Market Size - Data Table on Global Automatic Data Capture (ADC) Market 2018 - 2022 ($ million)
- Exhibits21: Historic Market Size - Product Segment 2018 - 2022 ($ million)
- Exhibits22: Historic Market Size - Application Segment 2018 - 2022 ($ million)
- Exhibits23: Historic Market Size - Geography Segment 2018 - 2022 ($ million)
- Exhibits24: Historic Market Size - Country Segment 2018 - 2022 ($ million)
- Exhibits25: Five forces analysis - Comparison between 2023 and 2028
- Exhibits26: Bargaining power of buyers - Impact of key factors 2023 and 2028
- Exhibits27: Bargaining power of suppliers - Impact of key factors in 2023 and 2028
- Exhibits28: Threat of new entrants - Impact of key factors in 2023 and 2028
- Exhibits29: Threat of substitutes - Impact of key factors in 2023 and 2028
- Exhibits30: Threat of rivalry - Impact of key factors in 2023 and 2028
- Exhibits31: Chart on Market condition - Five forces 2023 and 2028
- Exhibits32: Chart on Product - Market share 2023-2028 (%)
- Exhibits33: Data Table on Product - Market share 2023-2028 (%)
- Exhibits34: Chart on Comparison by Product
- Exhibits35: Data Table on Comparison by Product
- Exhibits36: Chart on RFID - Market size and forecast 2023-2028 ($ million)
- Exhibits37: Data Table on RFID - Market size and forecast 2023-2028 ($ million)
- Exhibits38: Chart on RFID - Year-over-year growth 2023-2028 (%)
- Exhibits39: Data Table on RFID - Year-over-year growth 2023-2028 (%)
- Exhibits40: Chart on Barcode scanner - Market size and forecast 2023-2028 ($ million)
- Exhibits41: Data Table on Barcode scanner - Market size and forecast 2023-2028 ($ million)
- Exhibits42: Chart on Barcode scanner - Year-over-year growth 2023-2028 (%)
- Exhibits43: Data Table on Barcode scanner - Year-over-year growth 2023-2028 (%)
- Exhibits44: Chart on Barcode printer - Market size and forecast 2023-2028 ($ million)
- Exhibits45: Data Table on Barcode printer - Market size and forecast 2023-2028 ($ million)
- Exhibits46: Chart on Barcode printer - Year-over-year growth 2023-2028 (%)
- Exhibits47: Data Table on Barcode printer - Year-over-year growth 2023-2028 (%)
- Exhibits48: Chart on Wearable scanners - Market size and forecast 2023-2028 ($ million)
- Exhibits49: Data Table on Wearable scanners - Market size and forecast 2023-2028 ($ million)
- Exhibits50: Chart on Wearable scanners - Year-over-year growth 2023-2028 (%)
- Exhibits51: Data Table on Wearable scanners - Year-over-year growth 2023-2028 (%)
- Exhibits52: Market opportunity by Product ($ million)
- Exhibits53: Data Table on Market opportunity by Product ($ million)
- Exhibits54: Chart on Application - Market share 2023-2028 (%)
- Exhibits55: Data Table on Application - Market share 2023-2028 (%)
- Exhibits56: Chart on Comparison by Application
- Exhibits57: Data Table on Comparison by Application
- Exhibits58: Chart on Industrial - Market size and forecast 2023-2028 ($ million)
- Exhibits59: Data Table on Industrial - Market size and forecast 2023-2028 ($ million)
- Exhibits60: Chart on Industrial - Year-over-year growth 2023-2028 (%)
- Exhibits61: Data Table on Industrial - Year-over-year growth 2023-2028 (%)
- Exhibits62: Chart on Financial security - Market size and forecast 2023-2028 ($ million)
- Exhibits63: Data Table on Financial security - Market size and forecast 2023-2028 ($ million)
- Exhibits64: Chart on Financial security - Year-over-year growth 2023-2028 (%)
- Exhibits65: Data Table on Financial security - Year-over-year growth 2023-2028 (%)
- Exhibits66: Chart on Retail - Market size and forecast 2023-2028 ($ million)
- Exhibits67: Data Table on Retail - Market size and forecast 2023-2028 ($ million)
- Exhibits68: Chart on Retail - Year-over-year growth 2023-2028 (%)
- Exhibits69: Data Table on Retail - Year-over-year growth 2023-2028 (%)
- Exhibits70: Chart on T and L - Market size and forecast 2023-2028 ($ million)
- Exhibits71: Data Table on T and L - Market size and forecast 2023-2028 ($ million)
- Exhibits72: Chart on T and L - Year-over-year growth 2023-2028 (%)
- Exhibits73: Data Table on T and L - Year-over-year growth 2023-2028 (%)
- Exhibits74: Chart on Others - Market size and forecast 2023-2028 ($ million)
- Exhibits75: Data Table on Others - Market size and forecast 2023-2028 ($ million)
- Exhibits76: Chart on Others - Year-over-year growth 2023-2028 (%)
- Exhibits77: Data Table on Others - Year-over-year growth 2023-2028 (%)
- Exhibits78: Market opportunity by Application ($ million)
- Exhibits79: Data Table on Market opportunity by Application ($ million)
- Exhibits80: Analysis of price sensitivity, lifecycle, customer purchase basket, adoption rates, and purchase criteria
- Exhibits81: Chart on Market share By Geographical Landscape 2023-2028 (%)
- Exhibits82: Data Table on Market share By Geographical Landscape 2023-2028 (%)
- Exhibits83: Chart on Geographic comparison
- Exhibits84: Data Table on Geographic comparison
- Exhibits85: Chart on North America - Market size and forecast 2023-2028 ($ million)
- Exhibits86: Data Table on North America - Market size and forecast 2023-2028 ($ million)
- Exhibits87: Chart on North America - Year-over-year growth 2023-2028 (%)
- Exhibits88: Data Table on North America - Year-over-year growth 2023-2028 (%)
- Exhibits89: Chart on APAC - Market size and forecast 2023-2028 ($ million)
- Exhibits90: Data Table on APAC - Market size and forecast 2023-2028 ($ million)
- Exhibits91: Chart on APAC - Year-over-year growth 2023-2028 (%)
- Exhibits92: Data Table on APAC - Year-over-year growth 2023-2028 (%)
- Exhibits93: Chart on Europe - Market size and forecast 2023-2028 ($ million)
- Exhibits94: Data Table on Europe - Market size and forecast 2023-2028 ($ million)
- Exhibits95: Chart on Europe - Year-over-year growth 2023-2028 (%)
- Exhibits96: Data Table on Europe - Year-over-year growth 2023-2028 (%)
- Exhibits97: Chart on South America - Market size and forecast 2023-2028 ($ million)
- Exhibits98: Data Table on South America - Market size and forecast 2023-2028 ($ million)
- Exhibits99: Chart on South America - Year-over-year growth 2023-2028 (%)
- Exhibits100: Data Table on South America - Year-over-year growth 2023-2028 (%)
- Exhibits101: Chart on Middle East and Africa - Market size and forecast 2023-2028 ($ million)
- Exhibits102: Data Table on Middle East and Africa - Market size and forecast 2023-2028 ($ million)
- Exhibits103: Chart on Middle East and Africa - Year-over-year growth 2023-2028 (%)
- Exhibits104: Data Table on Middle East and Africa - Year-over-year growth 2023-2028 (%)
- Exhibits105: Chart on US - Market size and forecast 2023-2028 ($ million)
- Exhibits106: Data Table on US - Market size and forecast 2023-2028 ($ million)
- Exhibits107: Chart on US - Year-over-year growth 2023-2028 (%)
- Exhibits108: Data Table on US - Year-over-year growth 2023-2028 (%)
- Exhibits109: Chart on China - Market size and forecast 2023-2028 ($ million)
- Exhibits110: Data Table on China - Market size and forecast 2023-2028 ($ million)
- Exhibits111: Chart on China - Year-over-year growth 2023-2028 (%)
- Exhibits112: Data Table on China - Year-over-year growth 2023-2028 (%)
- Exhibits113: Chart on UK - Market size and forecast 2023-2028 ($ million)
- Exhibits114: Data Table on UK - Market size and forecast 2023-2028 ($ million)
- Exhibits115: Chart on UK - Year-over-year growth 2023-2028 (%)
- Exhibits116: Data Table on UK - Year-over-year growth 2023-2028 (%)
- Exhibits117: Chart on Germany - Market size and forecast 2023-2028 ($ million)
- Exhibits118: Data Table on Germany - Market size and forecast 2023-2028 ($ million)
- Exhibits119: Chart on Germany - Year-over-year growth 2023-2028 (%)
- Exhibits120: Data Table on Germany - Year-over-year growth 2023-2028 (%)
- Exhibits121: Chart on France - Market size and forecast 2023-2028 ($ million)
- Exhibits122: Data Table on France - Market size and forecast 2023-2028 ($ million)
- Exhibits123: Chart on France - Year-over-year growth 2023-2028 (%)
- Exhibits124: Data Table on France - Year-over-year growth 2023-2028 (%)
- Exhibits125: Market opportunity By Geographical Landscape ($ million)
- Exhibits126: Data Tables on Market opportunity By Geographical Landscape ($ million)
- Exhibits127: Impact of drivers and challenges in 2023 and 2028
- Exhibits128: Overview on criticality of inputs and factors of differentiation
- Exhibits129: Overview on factors of disruption
- Exhibits130: Impact of key risks on business
- Exhibits131: Companies covered
- Exhibits132: Matrix on companies position and classification
- Exhibits133: Alien Technology LLC - Overview
- Exhibits134: Alien Technology LLC - Product / Service
- Exhibits135: Alien Technology LLC - Key offerings
- Exhibits136: Avery Dennison Corp. - Overview
- Exhibits137: Avery Dennison Corp. - Business segments
- Exhibits138: Avery Dennison Corp. - Key news
- Exhibits139: Avery Dennison Corp. - Key offerings
- Exhibits140: Avery Dennison Corp. - Segment focus
- Exhibits141: B O S Better Online Solutions Ltd. - Overview
- Exhibits142: B O S Better Online Solutions Ltd. - Business segments
- Exhibits143: B O S Better Online Solutions Ltd. - Key offerings
- Exhibits144: B O S Better Online Solutions Ltd. - Segment focus
- Exhibits145: Bluebird Inc. - Overview
- Exhibits146: Bluebird Inc. - Product / Service
- Exhibits147: Bluebird Inc. - Key offerings
- Exhibits148: Cognex Corp. - Overview
- Exhibits149: Cognex Corp. - Product / Service
- Exhibits150: Cognex Corp. - Key news
- Exhibits151: Cognex Corp. - Key offerings
- Exhibits152: Datalogic Spa - Overview
- Exhibits153: Datalogic Spa - Business segments
- Exhibits154: Datalogic Spa - Key news
- Exhibits155: Datalogic Spa - Key offerings
- Exhibits156: Datalogic Spa - Segment focus
- Exhibits157: Honeywell International Inc. - Overview
- Exhibits158: Honeywell International Inc. - Business segments
- Exhibits159: Honeywell International Inc. - Key news
- Exhibits160: Honeywell International Inc. - Key offerings
- Exhibits161: Honeywell International Inc. - Segment focus
- Exhibits162: Janam Technologies LLC - Overview
- Exhibits163: Janam Technologies LLC - Product / Service
- Exhibits164: Janam Technologies LLC - Key offerings
- Exhibits165: Newland Europe BV - Overview
- Exhibits166: Newland Europe BV - Product / Service
- Exhibits167: Newland Europe BV - Key offerings
- Exhibits168: OMRON Corp. - Overview
- Exhibits169: OMRON Corp. - Business segments
- Exhibits170: OMRON Corp. - Key news
- Exhibits171: OMRON Corp. - Key offerings
- Exhibits172: OMRON Corp. - Segment focus
- Exhibits173: Panasonic Holdings Corp. - Overview
- Exhibits174: Panasonic Holdings Corp. - Business segments
- Exhibits175: Panasonic Holdings Corp. - Key news
- Exhibits176: Panasonic Holdings Corp. - Key offerings
- Exhibits177: Panasonic Holdings Corp. - Segment focus
- Exhibits178: SATO Holdings Corp. - Overview
- Exhibits179: SATO Holdings Corp. - Business segments
- Exhibits180: SATO Holdings Corp. - Key news
- Exhibits181: SATO Holdings Corp. - Key offerings
- Exhibits182: SATO Holdings Corp. - Segment focus
- Exhibits183: TSC Auto ID Technology Co. Ltd. - Overview
- Exhibits184: TSC Auto ID Technology Co. Ltd. - Product / Service
- Exhibits185: TSC Auto ID Technology Co. Ltd. - Key offerings
- Exhibits186: Unitech Computer Co. Ltd. - Overview
- Exhibits187: Unitech Computer Co. Ltd. - Product / Service
- Exhibits188: Unitech Computer Co. Ltd. - Key offerings
- Exhibits189: Zebra Technologies Corp. - Overview
- Exhibits190: Zebra Technologies Corp. - Business segments
- Exhibits191: Zebra Technologies Corp. - Key news
- Exhibits192: Zebra Technologies Corp. - Key offerings
- Exhibits193: Zebra Technologies Corp. - Segment focus
- Exhibits194: Inclusions checklist
- Exhibits195: Exclusions checklist
- Exhibits196: Currency conversion rates for US$
- Exhibits197: Research methodology
- Exhibits198: Information sources
- Exhibits199: Data validation
- Exhibits200: Validation techniques employed for market sizing
- Exhibits201: Data synthesis
- Exhibits202: 360 degree market analysis
- Exhibits203: List of abbreviations
The automatic data capture (ADC) market is forecasted to grow by USD 48685.5 mn during 2023-2028, accelerating at a CAGR of 13.64% during the forecast period. The report on the automatic data capture (ADC) market provides a holistic analysis, market size and forecast, trends, growth drivers, and challenges, as well as vendor analysis covering around 25 vendors.
The report offers an up-to-date analysis regarding the current market scenario, the latest trends and drivers, and the overall market environment. The market is driven by increasing application of RFID, rising demand for better inventory management systems, and growing adoption of 2D barcodes.
Technavio's automatic data capture (ADC) market is segmented as below:
| Market Scope | |
|---|---|
| Base Year | 2024 |
| End Year | 2028 |
| Series Year | 2024-2028 |
| Growth Momentum | Accelerate |
| YOY 2024 | 11.73% |
| CAGR | 13.64% |
| Incremental Value | $48685.5mn |
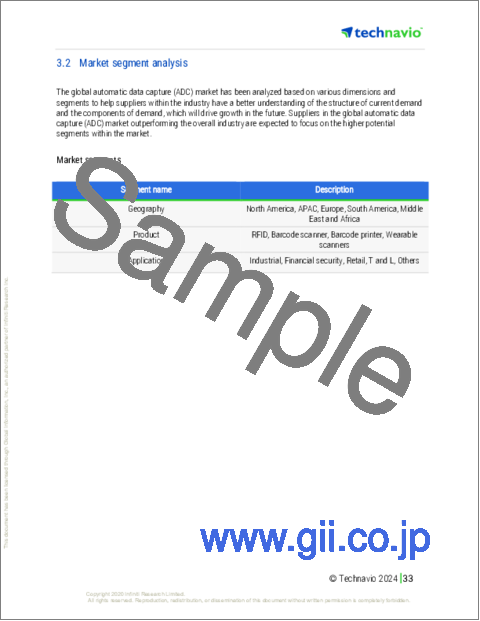
ByProduct
- RFID
- Barcode scanner
- Barcode printer
- Wearable scanners
ByApplication
- Industrial
- Financial security
- Retail
- T and L
- Others
ByGeography
- North America
- APAC
- Europe
- South America
- Middle East and Africa
This study identifies the growing popularity of smart factories as one of the prime reasons driving the automatic data capture (ADC) market growth during the next few years. Also, growing popularity of big data and high demand for 2d wearable scanners will lead to sizable demand in the market.
The report on the automatic data capture (ADC) market covers the following areas:
- Automatic data capture (ADC) market sizing
- Automatic data capture (ADC) market forecast
- Automatic data capture (ADC) market industry analysis
The robust vendor analysis is designed to help clients improve their market position, and in line with this, this report provides a detailed analysis of several leading automatic data capture (ADC) market vendors that include Alien Technology LLC, Avery Dennison Corp., B O S Better Online Solutions Ltd., Bluebird Inc., CipherLab Co. Ltd., Cognex Corp., Datalogic SpA, DENSO Corp., Honeywell International Inc., Impinj Inc., Janam Technologies LLC, Motorola Solutions Inc., Newland Europe BV, OMRON Corp., Opticon Sensors Europe BV, Panasonic Holdings Corp., SATO Holdings Corp., TSC Auto ID Technology Co. Ltd., Unitech Computer Co. Ltd., and Zebra Technologies Corp.. Also, the automatic data capture (adc) market analysis report includes information on upcoming trends and challenges that will influence market growth. This is to help companies strategize and leverage all forthcoming growth opportunities.
The study was conducted using an objective combination of primary and secondary information including inputs from key participants in the industry. The report contains a comprehensive market and vendor landscape in addition to an analysis of the key vendors.
The publisher presents a detailed picture of the market by the way of study, synthesis, and summation of data from multiple sources by an analysis of key parameters such as profit, pricing, competition, and promotions. It presents various market facets by identifying the key industry influencers. The data presented is comprehensive, reliable, and a result of extensive research - both primary and secondary. The market research reports provide a complete competitive landscape and an in-depth vendor selection methodology and analysis using qualitative and quantitative research to forecast the accurate market growth.
Table of Contents
1 Executive Summary
- 1.1 Market overview
- Executive Summary - Chart on Market Overview
- Executive Summary - Data Table on Market Overview
- Executive Summary - Chart on Global Market Characteristics
- Executive Summary - Chart on Market By Geographical Landscape
- Executive Summary - Chart on Market Segmentation by Product
- Executive Summary - Chart on Market Segmentation by Application
- Executive Summary - Chart on Incremental Growth
- Executive Summary - Data Table on Incremental Growth
- Executive Summary - Chart on Company Market Positioning
2 Market Landscape
- 2.1 Market ecosystem
- Parent Market
- Data Table on - Parent Market
- 2.2 Market characteristics
- Market characteristics analysis
- 2.3 Value chain analysis
- Value Chain Analysis
3 Market Sizing
- 3.1 Market definition
- Offerings of companies included in the market definition
- 3.2 Market segment analysis
- Market segments
- 3.3 Market size 2023
- 3.4 Market outlook: Forecast for 2023-2028
- Chart on Global - Market size and forecast 2023-2028 ($ million)
- Data Table on Global - Market size and forecast 2023-2028 ($ million)
- Chart on Global Market: Year-over-year growth 2023-2028 (%)
- Data Table on Global Market: Year-over-year growth 2023-2028 (%)
4 Historic Market Size
- 4.1 Global Automatic Data Capture (ADC) Market 2018 - 2022
- Historic Market Size - Data Table on Global Automatic Data Capture (ADC) Market 2018 - 2022 ($ million)
- 4.2 Product segment analysis 2018 - 2022
- Historic Market Size - Product Segment 2018 - 2022 ($ million)
- 4.3 Application segment analysis 2018 - 2022
- Historic Market Size - Application Segment 2018 - 2022 ($ million)
- 4.4 Geography segment analysis 2018 - 2022
- Historic Market Size - Geography Segment 2018 - 2022 ($ million)
- 4.5 Country segment analysis 2018 - 2022
- Historic Market Size - Country Segment 2018 - 2022 ($ million)
5 Five Forces Analysis
- 5.1 Five forces summary
- Five forces analysis - Comparison between 2023 and 2028
- 5.2 Bargaining power of buyers
- Bargaining power of buyers - Impact of key factors 2023 and 2028
- 5.3 Bargaining power of suppliers
- Bargaining power of suppliers - Impact of key factors in 2023 and 2028
- 5.4 Threat of new entrants
- Threat of new entrants - Impact of key factors in 2023 and 2028
- 5.5 Threat of substitutes
- Threat of substitutes - Impact of key factors in 2023 and 2028
- 5.6 Threat of rivalry
- Threat of rivalry - Impact of key factors in 2023 and 2028
- 5.7 Market condition
- Chart on Market condition - Five forces 2023 and 2028
6 Market Segmentation by Product
- 6.1 Market segments
- Chart on Product - Market share 2023-2028 (%)
- Data Table on Product - Market share 2023-2028 (%)
- 6.2 Comparison by Product
- Chart on Comparison by Product
- Data Table on Comparison by Product
- 6.3 RFID - Market size and forecast 2023-2028
- Chart on RFID - Market size and forecast 2023-2028 ($ million)
- Data Table on RFID - Market size and forecast 2023-2028 ($ million)
- Chart on RFID - Year-over-year growth 2023-2028 (%)
- Data Table on RFID - Year-over-year growth 2023-2028 (%)
- 6.4 Barcode scanner - Market size and forecast 2023-2028
- Chart on Barcode scanner - Market size and forecast 2023-2028 ($ million)
- Data Table on Barcode scanner - Market size and forecast 2023-2028 ($ million)
- Chart on Barcode scanner - Year-over-year growth 2023-2028 (%)
- Data Table on Barcode scanner - Year-over-year growth 2023-2028 (%)
- 6.5 Barcode printer - Market size and forecast 2023-2028
- Chart on Barcode printer - Market size and forecast 2023-2028 ($ million)
- Data Table on Barcode printer - Market size and forecast 2023-2028 ($ million)
- Chart on Barcode printer - Year-over-year growth 2023-2028 (%)
- Data Table on Barcode printer - Year-over-year growth 2023-2028 (%)
- 6.6 Wearable scanners - Market size and forecast 2023-2028
- Chart on Wearable scanners - Market size and forecast 2023-2028 ($ million)
- Data Table on Wearable scanners - Market size and forecast 2023-2028 ($ million)
- Chart on Wearable scanners - Year-over-year growth 2023-2028 (%)
- Data Table on Wearable scanners - Year-over-year growth 2023-2028 (%)
- 6.7 Market opportunity by Product
- Market opportunity by Product ($ million)
- Data Table on Market opportunity by Product ($ million)
7 Market Segmentation by Application
- 7.1 Market segments
- Chart on Application - Market share 2023-2028 (%)
- Data Table on Application - Market share 2023-2028 (%)
- 7.2 Comparison by Application
- Chart on Comparison by Application
- Data Table on Comparison by Application
- 7.3 Industrial - Market size and forecast 2023-2028
- Chart on Industrial - Market size and forecast 2023-2028 ($ million)
- Data Table on Industrial - Market size and forecast 2023-2028 ($ million)
- Chart on Industrial - Year-over-year growth 2023-2028 (%)
- Data Table on Industrial - Year-over-year growth 2023-2028 (%)
- 7.4 Financial security - Market size and forecast 2023-2028
- Chart on Financial security - Market size and forecast 2023-2028 ($ million)
- Data Table on Financial security - Market size and forecast 2023-2028 ($ million)
- Chart on Financial security - Year-over-year growth 2023-2028 (%)
- Data Table on Financial security - Year-over-year growth 2023-2028 (%)
- 7.5 Retail - Market size and forecast 2023-2028
- Chart on Retail - Market size and forecast 2023-2028 ($ million)
- Data Table on Retail - Market size and forecast 2023-2028 ($ million)
- Chart on Retail - Year-over-year growth 2023-2028 (%)
- Data Table on Retail - Year-over-year growth 2023-2028 (%)
- 7.6 T and L - Market size and forecast 2023-2028
- Chart on T and L - Market size and forecast 2023-2028 ($ million)
- Data Table on T and L - Market size and forecast 2023-2028 ($ million)
- Chart on T and L - Year-over-year growth 2023-2028 (%)
- Data Table on T and L - Year-over-year growth 2023-2028 (%)
- 7.7 Others - Market size and forecast 2023-2028
- Chart on Others - Market size and forecast 2023-2028 ($ million)
- Data Table on Others - Market size and forecast 2023-2028 ($ million)
- Chart on Others - Year-over-year growth 2023-2028 (%)
- Data Table on Others - Year-over-year growth 2023-2028 (%)
- 7.8 Market opportunity by Application
- Market opportunity by Application ($ million)
- Data Table on Market opportunity by Application ($ million)
8 Customer Landscape
- 8.1 Customer landscape overview
- Analysis of price sensitivity, lifecycle, customer purchase basket, adoption rates, and purchase criteria
9 Geographic Landscape
- 9.1 Geographic segmentation
- Chart on Market share By Geographical Landscape 2023-2028 (%)
- Data Table on Market share By Geographical Landscape 2023-2028 (%)
- 9.2 Geographic comparison
- Chart on Geographic comparison
- Data Table on Geographic comparison
- 9.3 North America - Market size and forecast 2023-2028
- Chart on North America - Market size and forecast 2023-2028 ($ million)
- Data Table on North America - Market size and forecast 2023-2028 ($ million)
- Chart on North America - Year-over-year growth 2023-2028 (%)
- Data Table on North America - Year-over-year growth 2023-2028 (%)
- 9.4 APAC - Market size and forecast 2023-2028
- Chart on APAC - Market size and forecast 2023-2028 ($ million)
- Data Table on APAC - Market size and forecast 2023-2028 ($ million)
- Chart on APAC - Year-over-year growth 2023-2028 (%)
- Data Table on APAC - Year-over-year growth 2023-2028 (%)
- 9.5 Europe - Market size and forecast 2023-2028
- Chart on Europe - Market size and forecast 2023-2028 ($ million)
- Data Table on Europe - Market size and forecast 2023-2028 ($ million)
- Chart on Europe - Year-over-year growth 2023-2028 (%)
- Data Table on Europe - Year-over-year growth 2023-2028 (%)
- 9.6 South America - Market size and forecast 2023-2028
- Chart on South America - Market size and forecast 2023-2028 ($ million)
- Data Table on South America - Market size and forecast 2023-2028 ($ million)
- Chart on South America - Year-over-year growth 2023-2028 (%)
- Data Table on South America - Year-over-year growth 2023-2028 (%)
- 9.7 Middle East and Africa - Market size and forecast 2023-2028
- Chart on Middle East and Africa - Market size and forecast 2023-2028 ($ million)
- Data Table on Middle East and Africa - Market size and forecast 2023-2028 ($ million)
- Chart on Middle East and Africa - Year-over-year growth 2023-2028 (%)
- Data Table on Middle East and Africa - Year-over-year growth 2023-2028 (%)
- 9.8 US - Market size and forecast 2023-2028
- Chart on US - Market size and forecast 2023-2028 ($ million)
- Data Table on US - Market size and forecast 2023-2028 ($ million)
- Chart on US - Year-over-year growth 2023-2028 (%)
- Data Table on US - Year-over-year growth 2023-2028 (%)
- 9.9 China - Market size and forecast 2023-2028
- Chart on China - Market size and forecast 2023-2028 ($ million)
- Data Table on China - Market size and forecast 2023-2028 ($ million)
- Chart on China - Year-over-year growth 2023-2028 (%)
- Data Table on China - Year-over-year growth 2023-2028 (%)
- 9.10 UK - Market size and forecast 2023-2028
- Chart on UK - Market size and forecast 2023-2028 ($ million)
- Data Table on UK - Market size and forecast 2023-2028 ($ million)
- Chart on UK - Year-over-year growth 2023-2028 (%)
- Data Table on UK - Year-over-year growth 2023-2028 (%)
- 9.11 Germany - Market size and forecast 2023-2028
- Chart on Germany - Market size and forecast 2023-2028 ($ million)
- Data Table on Germany - Market size and forecast 2023-2028 ($ million)
- Chart on Germany - Year-over-year growth 2023-2028 (%)
- Data Table on Germany - Year-over-year growth 2023-2028 (%)
- 9.12 France - Market size and forecast 2023-2028
- Chart on France - Market size and forecast 2023-2028 ($ million)
- Data Table on France - Market size and forecast 2023-2028 ($ million)
- Chart on France - Year-over-year growth 2023-2028 (%)
- Data Table on France - Year-over-year growth 2023-2028 (%)
- 9.13 Market opportunity By Geographical Landscape
- Market opportunity By Geographical Landscape ($ million)
- Data Tables on Market opportunity By Geographical Landscape ($ million)
10 Drivers, Challenges, and Opportunity/Restraints
- 10.1 Market drivers
- 10.2 Market challenges
- 10.3 Impact of drivers and challenges
- Impact of drivers and challenges in 2023 and 2028
- 10.4 Market opportunities/restraints
11 Competitive Landscape
- 11.1 Overview
- 11.2 Competitive Landscape
- Overview on criticality of inputs and factors of differentiation
- 11.3 Landscape disruption
- Overview on factors of disruption
- 11.4 Industry risks
- Impact of key risks on business
12 Competitive Analysis
- 12.1 Companies profiled
- Companies covered
- 12.2 Market positioning of companies
- Matrix on companies position and classification
- 12.3 Alien Technology LLC
- Alien Technology LLC - Overview
- Alien Technology LLC - Product / Service
- Alien Technology LLC - Key offerings
- 12.4 Avery Dennison Corp.
- Avery Dennison Corp. - Overview
- Avery Dennison Corp. - Business segments
- Avery Dennison Corp. - Key news
- Avery Dennison Corp. - Key offerings
- Avery Dennison Corp. - Segment focus
- 12.5 B O S Better Online Solutions Ltd.
- B O S Better Online Solutions Ltd. - Overview
- B O S Better Online Solutions Ltd. - Business segments
- B O S Better Online Solutions Ltd. - Key offerings
- B O S Better Online Solutions Ltd. - Segment focus
- 12.6 Bluebird Inc.
- Bluebird Inc. - Overview
- Bluebird Inc. - Product / Service
- Bluebird Inc. - Key offerings
- 12.7 Cognex Corp.
- Cognex Corp. - Overview
- Cognex Corp. - Product / Service
- Cognex Corp. - Key news
- Cognex Corp. - Key offerings
- 12.8 Datalogic Spa
- Datalogic Spa - Overview
- Datalogic Spa - Business segments
- Datalogic Spa - Key news
- Datalogic Spa - Key offerings
- Datalogic Spa - Segment focus
- 12.9 Honeywell International Inc.
- Honeywell International Inc. - Overview
- Honeywell International Inc. - Business segments
- Honeywell International Inc. - Key news
- Honeywell International Inc. - Key offerings
- Honeywell International Inc. - Segment focus
- 12.10 Janam Technologies LLC
- Janam Technologies LLC - Overview
- Janam Technologies LLC - Product / Service
- Janam Technologies LLC - Key offerings
- 12.11 Newland Europe BV
- Newland Europe BV - Overview
- Newland Europe BV - Product / Service
- Newland Europe BV - Key offerings
- 12.12 OMRON Corp.
- OMRON Corp. - Overview
- OMRON Corp. - Business segments
- OMRON Corp. - Key news
- OMRON Corp. - Key offerings
- OMRON Corp. - Segment focus
- 12.13 Panasonic Holdings Corp.
- Panasonic Holdings Corp. - Overview
- Panasonic Holdings Corp. - Business segments
- Panasonic Holdings Corp. - Key news
- Panasonic Holdings Corp. - Key offerings
- Panasonic Holdings Corp. - Segment focus
- 12.14 SATO Holdings Corp.
- SATO Holdings Corp. - Overview
- SATO Holdings Corp. - Business segments
- SATO Holdings Corp. - Key news
- SATO Holdings Corp. - Key offerings
- SATO Holdings Corp. - Segment focus
- 12.15 TSC Auto ID Technology Co. Ltd.
- TSC Auto ID Technology Co. Ltd. - Overview
- TSC Auto ID Technology Co. Ltd. - Product / Service
- TSC Auto ID Technology Co. Ltd. - Key offerings
- 12.16 Unitech Computer Co. Ltd.
- Unitech Computer Co. Ltd. - Overview
- Unitech Computer Co. Ltd. - Product / Service
- Unitech Computer Co. Ltd. - Key offerings
- 12.17 Zebra Technologies Corp.
- Zebra Technologies Corp. - Overview
- Zebra Technologies Corp. - Business segments
- Zebra Technologies Corp. - Key news
- Zebra Technologies Corp. - Key offerings
- Zebra Technologies Corp. - Segment focus
13 Appendix
- 13.1 Scope of the report
- 13.2 Inclusions and exclusions checklist
- Inclusions checklist
- Exclusions checklist
- 13.3 Currency conversion rates for US$
- Currency conversion rates for US$
- 13.4 Research methodology
- Research methodology
- 13.5 Data procurement
- Information sources
- 13.6 Data validation
- Data validation
- 13.7 Validation techniques employed for market sizing
- Validation techniques employed for market sizing
- 13.8 Data synthesis
- Data synthesis
- 360 degree market analysis
- 360 degree market analysis
- 13.10 List of abbreviations
- List of abbreviations

