|
|
市場調査レポート
商品コード
1681191
キャンプ用ライトとランタンの世界市場、2025-2029年Global Camping Lights and Lanterns Market 2025-2029 |
||||||
|
|||||||
カスタマイズ可能
|
|||||||

| キャンプ用ライトとランタンの世界市場、2025-2029年 |
|
出版日: 2025年03月05日
発行: TechNavio
ページ情報: 英文 241 Pages
納期: 即納可能
|

全表示
- 概要
- 目次
キャンプ用ライトとランタン市場は2024-2029年に9,540万米ドル、予測期間中のCAGRは8.6%で成長すると予測されます。
当レポートでは、キャンプ用ライトとランタン市場の全体的な分析、市場規模・予測、動向、成長促進要因、課題、約25のベンダーを網羅したベンダー分析などを掲載しています。
現在の市場シナリオ、最新動向と促進要因、市場環境全体に関する最新分析を提供しています。市場は、アドベンチャー活動を目的とした旅行者の増加、トレードオファーを提供するためのマルチチャネルマーケティング戦略の重視、キャンプ振興のための政府支援や資金提供によって牽引されています。
| 市場範囲 | |
|---|---|
| 基準年 | 2025 |
| 終了年 | 2029 |
| 予測期間 | 2025-2029 |
| 成長モメンタム | 加速 |
| 前年比2025年 | 8.4% |
| CAGR | 8.6% |
| 増分額 | 9,540万米ドル |
本調査は、業界の主要参加者からのインプットを含め、一次情報と二次情報を客観的に組み合わせて実施しました。レポートには、主要企業の分析に加え、包括的な市場規模データ、地域分析によるセグメント、ベンダー情勢が含まれています。レポートには過去データと予測データがあります。
本調査では、今後数年間のキャンプ用ライトとランタン市場の成長を促進する主な要因の1つとして、先進技術による製品機能の強化を挙げています。また、オンラインレビューの重要性の高まりやキャンプ場の市場開拓の進展は、同市場における大きな需要につながるでしょう。
目次
第1章 エグゼクティブサマリー
- 市場概要
第2章 Technavio分析
- 価格・ライフサイクル・顧客購入バスケット・採用率・購入基準の分析
- インプットの重要性と差別化の要因
- 混乱の要因
- 促進要因と課題の影響
第3章 市場情勢
- 市場エコシステム
- 市場の特徴
- バリューチェーン分析
第4章 市場規模
- 市場の定義
- 市場セグメント分析
- 市場規模 2024
- 市場の見通し 2024-2029
第5章 市場規模実績
- キャンプ用ライトとランタンの世界市場 2019-2023
- 製品セグメント分析 2019-2023
- 流通チャネルセグメント分析 2019-2023
- 材料セグメント分析 2019-2023
- ソースセグメント分析 2019-2023
- 地域別セグメント分析 2019-2023
- 国別セグメント分析 2019-2023
第6章 定性分析
- AIの影響:キャンプ用ライトとランタンの世界市場
第7章 ファイブフォース分析
- ファイブフォースの要約
- 買い手の交渉力
- 供給企業の交渉力
- 新規参入業者の脅威
- 代替品の脅威
- 競争の脅威
- 市況
第8章 市場セグメンテーション:製品別
- 市場セグメント
- 比較:製品別
- 懐中電灯:市場規模と予測 2024-2029
- ランタン:市場規模と予測 2024-2029
- ヘッドランプ:市場規模と予測 2024-2029
- 市場機会:製品別
第9章 市場セグメンテーション:流通チャネル別
- 市場セグメント
- 比較:流通チャネル別
- オフライン:市場規模と予測 2024-2029
- オンライン:市場規模と予測 2024-2029
- 市場機会:流通チャネル別
第10章 市場セグメンテーション:素材別
- 市場セグメント
- 比較:素材別
- アルミニウム:市場規模と予測 2024-2029
- ABSプラスチック:市場規模と予測 2024-2029
- ステンレス鋼:市場規模と予測 2024-2029
- その他:市場規模と予測 2024-2029
- 市場機会:素材別
第11章 市場セグメンテーション:ソース別
- 市場セグメント
- 比較:ソース別
- バッテリー:市場規模と予測 2024-2029
- ソーラー:市場規模と予測 2024-2029
- 充電式:市場規模と予測 2024-2029
- その他:市場規模と予測 2024-2029
- 市場機会:ソース別
第12章 顧客情勢
- 顧客情勢の概要
第13章 地域別情勢
- 地域別セグメンテーション
- 地域別比較
- 北米:市場規模と予測 2024-2029
- 欧州:市場規模と予測 2024-2029
- アジア太平洋:市場規模と予測 2024-2029
- 南米:市場規模と予測 2024-2029
- 中東・アフリカ:市場規模と予測 2024-2029
- 米国:市場規模と予測 2024-2029
- ドイツ:市場規模と予測 2024-2029
- 英国:市場規模と予測 2024-2029
- フランス:市場規模と予測 2024-2029
- カナダ:市場規模と予測 2024-2029
- オーストラリア:市場規模と予測 2024-2029
- 中国:市場規模と予測 2024-2029
- 日本:市場規模と予測 2024-2029
- イタリア:市場規模と予測 2024-2029
- スペイン:市場規模と予測 2024-2029
- 市場機会:地域情勢別
第14章 促進要因・課題・機会・抑制要因
- 市場促進要因
- 市場の課題
- 促進要因と課題の影響
- 市場の機会・抑制要因
第15章 競合情勢
- 概要
- 競合情勢
- 混乱の状況
- 業界のリスク
第16章 競合分析
- 企業プロファイル
- 企業ランキング指数
- 企業の市場ポジショニング
- Decathlon SA
- Extreme Lights
- Johnson Outdoors Inc.
- KLARUS Lighting Technology Co. Ltd.
- Koninklijke Philips NV
- LUMINTOP
- Newell Brands Inc.
- Nitecore
- OSRAM GmbH
- Paddy Pallin PTY LTD
- Surya Roshni Ltd
- Syska Led Lights Pvt. Ltd.
- Toshiba Corp.
- Wipro Ltd.
- Yalumi Corp.
第17章 付録
The camping lights and lanterns market is forecasted to grow by USD 95.4 million during 2024-2029, accelerating at a CAGR of 8.6% during the forecast period. The report on the camping lights and lanterns market provides a holistic analysis, market size and forecast, trends, growth drivers, and challenges, as well as vendor analysis covering around 25 vendors.
The report offers an up-to-date analysis regarding the current market scenario, the latest trends and drivers, and the overall market environment. The market is driven by rising number of travelers for adventure activities, more emphasis on multichannel marketing strategies to provide trade offers, and government support and funding for camping promotion.
| Market Scope | |
|---|---|
| Base Year | 2025 |
| End Year | 2029 |
| Series Year | 2025-2029 |
| Growth Momentum | Accelerate |
| YOY 2025 | 8.4% |
| CAGR | 8.6% |
| Incremental Value | $95.4 mn |
The study was conducted using an objective combination of primary and secondary information including inputs from key participants in the industry. The report contains a comprehensive market size data, segment with regional analysis and vendor landscape in addition to an analysis of the key companies. Reports have historic and forecast data.
Technavio's camping lights and lanterns market is segmented as below:
By Product
- Flashlights
- Lanterns
- Headlamps
By Distribution Channel
- Offline
- Online
By Material
- Aluminum
- ABS plastic
- Stainless steel
- Others
By Source
- Battery
- Solar
- Rechargeable
- Others
By Geographical Landscape
- North America
- Europe
- APAC
- South America
- Middle East and Africa
This study identifies the enhancement in product features through advanced technology as one of the prime reasons driving the camping lights and lanterns market growth during the next few years. Also, increasing importance of online reviews and ascending development of campsites will lead to sizable demand in the market.
The report on the camping lights and lanterns market covers the following areas:
- Camping Lights And Lanterns Market sizing
- Camping Lights And Lanterns Market forecast
- Camping Lights And Lanterns Market industry analysis
The robust vendor analysis is designed to help clients improve their market position, and in line with this, this report provides a detailed analysis of several leading camping lights and lanterns market vendors that include Axiom Controls Pvt. Ltd, Barebones, Crafuel, Decathlon SA, Extreme Lights, Hubbell Inc., Johnson Outdoors Inc., KLARUS Lighting Technology Co. Ltd., Koninklijke Philips NV, LUMINTOP, Newell Brands Inc., Nitecore, OSRAM GmbH, Paddy Pallin PTY LTD, Surya Roshni Ltd, Syska LED Lights Pvt. Ltd., Toshiba Corp., Wipro Ltd., Yalumi Corp., and Zempire Camping. Also, the camping lights and lanterns market analysis report includes information on upcoming trends and challenges that will influence market growth. This is to help companies strategize and leverage all forthcoming growth opportunities.
The publisher presents a detailed picture of the market by the way of study, synthesis, and summation of data from multiple sources by an analysis of key parameters such as profit, pricing, competition, and promotions. It presents various market facets by identifying the key industry influencers. The data presented is comprehensive, reliable, and a result of extensive primary and secondary research. The market research reports provide a complete competitive landscape and an in-depth vendor selection methodology and analysis using qualitative and quantitative research to forecast accurate market growth.
Table of Contents
1 Executive Summary
- 1.1 Market overview
- Executive Summary - Chart on Market Overview
- Executive Summary - Data Table on Market Overview
- Executive Summary - Chart on Global Market Characteristics
- Executive Summary - Chart on Market By Geographical Landscape
- Executive Summary - Chart on Market Segmentation by Product
- Executive Summary - Chart on Market Segmentation by Distribution Channel
- Executive Summary - Chart on Market Segmentation by Material
- Executive Summary - Chart on Market Segmentation by Source
- Executive Summary - Chart on Incremental Growth
- Executive Summary - Data Table on Incremental Growth
- Executive Summary - Chart on Company Market Positioning
2 Technavio Analysis
- 2.1 Analysis of price sensitivity, lifecycle, customer purchase basket, adoption rates, and purchase criteria
- Analysis of price sensitivity, lifecycle, customer purchase basket, adoption rates, and purchase criteria
- 2.2 Criticality of inputs and Factors of differentiation
- Overview on criticality of inputs and factors of differentiation
- 2.3 Factors of disruption
- Overview on factors of disruption
- 2.4 Impact of drivers and challenges
- Impact of drivers and challenges in 2024 and 2029
3 Market Landscape
- 3.1 Market ecosystem
- Parent Market
- Data Table on - Parent Market
- 3.2 Market characteristics
- Market characteristics analysis
- 3.3 Value chain analysis
- Value chain analysis
4 Market Sizing
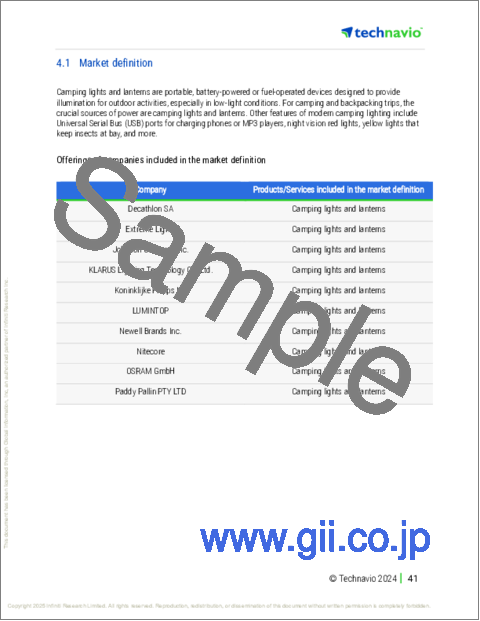
- 4.1 Market definition
- Offerings of companies included in the market definition
- 4.2 Market segment analysis
- Market segments
- 4.3 Market size 2024
- 4.4 Market outlook: Forecast for 2024-2029
- Chart on Global - Market size and forecast 2024-2029 ($ million)
- Data Table on Global - Market size and forecast 2024-2029 ($ million)
- Chart on Global Market: Year-over-year growth 2024-2029 (%)
- Data Table on Global Market: Year-over-year growth 2024-2029 (%)
5 Historic Market Size
- 5.1 Global Camping Lights And Lanterns Market 2019 - 2023
- Historic Market Size - Data Table on Global Camping Lights And Lanterns Market 2019 - 2023 ($ million)
- 5.2 Product segment analysis 2019 - 2023
- Historic Market Size - Product Segment 2019 - 2023 ($ million)
- 5.3 Distribution Channel segment analysis 2019 - 2023
- Historic Market Size - Distribution Channel Segment 2019 - 2023 ($ million)
- 5.4 Material segment analysis 2019 - 2023
- Historic Market Size - Material Segment 2019 - 2023 ($ million)
- 5.5 Source segment analysis 2019 - 2023
- Historic Market Size - Source Segment 2019 - 2023 ($ million)
- 5.6 Geography segment analysis 2019 - 2023
- Historic Market Size - Geography Segment 2019 - 2023 ($ million)
- 5.7 Country segment analysis 2019 - 2023
- Historic Market Size - Country Segment 2019 - 2023 ($ million)
6 Qualitative Analysis
- 6.1 Impact of AI on global camping lights and lanterns market
7 Five Forces Analysis
- 7.1 Five forces summary
- Five forces analysis - Comparison between 2024 and 2029
- 7.2 Bargaining power of buyers
- Bargaining power of buyers - Impact of key factors 2024 and 2029
- 7.3 Bargaining power of suppliers
- Bargaining power of suppliers - Impact of key factors in 2024 and 2029
- 7.4 Threat of new entrants
- Threat of new entrants - Impact of key factors in 2024 and 2029
- 7.5 Threat of substitutes
- Threat of substitutes - Impact of key factors in 2024 and 2029
- 7.6 Threat of rivalry
- Threat of rivalry - Impact of key factors in 2024 and 2029
- 7.7 Market condition
- Chart on Market condition - Five forces 2024 and 2029
8 Market Segmentation by Product
- 8.1 Market segments
- Chart on Product - Market share 2024-2029 (%)
- Data Table on Product - Market share 2024-2029 (%)
- 8.2 Comparison by Product
- Chart on Comparison by Product
- Data Table on Comparison by Product
- 8.3 Flashlights - Market size and forecast 2024-2029
- Chart on Flashlights - Market size and forecast 2024-2029 ($ million)
- Data Table on Flashlights - Market size and forecast 2024-2029 ($ million)
- Chart on Flashlights - Year-over-year growth 2024-2029 (%)
- Data Table on Flashlights - Year-over-year growth 2024-2029 (%)
- 8.4 Lanterns - Market size and forecast 2024-2029
- Chart on Lanterns - Market size and forecast 2024-2029 ($ million)
- Data Table on Lanterns - Market size and forecast 2024-2029 ($ million)
- Chart on Lanterns - Year-over-year growth 2024-2029 (%)
- Data Table on Lanterns - Year-over-year growth 2024-2029 (%)
- 8.5 Headlamps - Market size and forecast 2024-2029
- Chart on Headlamps - Market size and forecast 2024-2029 ($ million)
- Data Table on Headlamps - Market size and forecast 2024-2029 ($ million)
- Chart on Headlamps - Year-over-year growth 2024-2029 (%)
- Data Table on Headlamps - Year-over-year growth 2024-2029 (%)
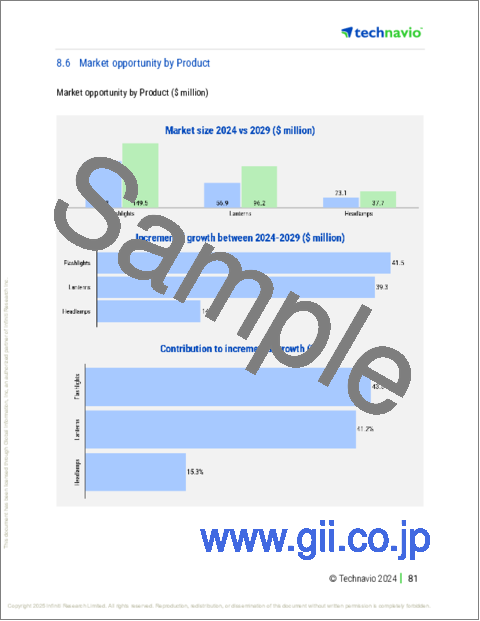
- 8.6 Market opportunity by Product
- Market opportunity by Product ($ million)
- Data Table on Market opportunity by Product ($ million)
9 Market Segmentation by Distribution Channel
- 9.1 Market segments
- Chart on Distribution Channel - Market share 2024-2029 (%)
- Data Table on Distribution Channel - Market share 2024-2029 (%)
- 9.2 Comparison by Distribution Channel
- Chart on Comparison by Distribution Channel
- Data Table on Comparison by Distribution Channel
- 9.3 Offline - Market size and forecast 2024-2029
- Chart on Offline - Market size and forecast 2024-2029 ($ million)
- Data Table on Offline - Market size and forecast 2024-2029 ($ million)
- Chart on Offline - Year-over-year growth 2024-2029 (%)
- Data Table on Offline - Year-over-year growth 2024-2029 (%)
- 9.4 Online - Market size and forecast 2024-2029
- Chart on Online - Market size and forecast 2024-2029 ($ million)
- Data Table on Online - Market size and forecast 2024-2029 ($ million)
- Chart on Online - Year-over-year growth 2024-2029 (%)
- Data Table on Online - Year-over-year growth 2024-2029 (%)
- 9.5 Market opportunity by Distribution Channel
- Market opportunity by Distribution Channel ($ million)
- Data Table on Market opportunity by Distribution Channel ($ million)
10 Market Segmentation by Material
- 10.1 Market segments
- Chart on Material - Market share 2024-2029 (%)
- Data Table on Material - Market share 2024-2029 (%)
- 10.2 Comparison by Material
- Chart on Comparison by Material
- Data Table on Comparison by Material
- 10.3 Aluminum - Market size and forecast 2024-2029
- Chart on Aluminum - Market size and forecast 2024-2029 ($ million)
- Data Table on Aluminum - Market size and forecast 2024-2029 ($ million)
- Chart on Aluminum - Year-over-year growth 2024-2029 (%)
- Data Table on Aluminum - Year-over-year growth 2024-2029 (%)
- 10.4 ABS plastic - Market size and forecast 2024-2029
- Chart on ABS plastic - Market size and forecast 2024-2029 ($ million)
- Data Table on ABS plastic - Market size and forecast 2024-2029 ($ million)
- Chart on ABS plastic - Year-over-year growth 2024-2029 (%)
- Data Table on ABS plastic - Year-over-year growth 2024-2029 (%)
- 10.5 Stainless steel - Market size and forecast 2024-2029
- Chart on Stainless steel - Market size and forecast 2024-2029 ($ million)
- Data Table on Stainless steel - Market size and forecast 2024-2029 ($ million)
- Chart on Stainless steel - Year-over-year growth 2024-2029 (%)
- Data Table on Stainless steel - Year-over-year growth 2024-2029 (%)
- 10.6 Others - Market size and forecast 2024-2029
- Chart on Others - Market size and forecast 2024-2029 ($ million)
- Data Table on Others - Market size and forecast 2024-2029 ($ million)
- Chart on Others - Year-over-year growth 2024-2029 (%)
- Data Table on Others - Year-over-year growth 2024-2029 (%)
- 10.7 Market opportunity by Material
- Market opportunity by Material ($ million)
- Data Table on Market opportunity by Material ($ million)
11 Market Segmentation by Source
- 11.1 Market segments
- Chart on Source - Market share 2024-2029 (%)
- Data Table on Source - Market share 2024-2029 (%)
- 11.2 Comparison by Source
- Chart on Comparison by Source
- Data Table on Comparison by Source
- 11.3 Battery - Market size and forecast 2024-2029
- Chart on Battery - Market size and forecast 2024-2029 ($ million)
- Data Table on Battery - Market size and forecast 2024-2029 ($ million)
- Chart on Battery - Year-over-year growth 2024-2029 (%)
- Data Table on Battery - Year-over-year growth 2024-2029 (%)
- 11.4 Solar - Market size and forecast 2024-2029
- Chart on Solar - Market size and forecast 2024-2029 ($ million)
- Data Table on Solar - Market size and forecast 2024-2029 ($ million)
- Chart on Solar - Year-over-year growth 2024-2029 (%)
- Data Table on Solar - Year-over-year growth 2024-2029 (%)
- 11.5 Rechargeable - Market size and forecast 2024-2029
- Chart on Rechargeable - Market size and forecast 2024-2029 ($ million)
- Data Table on Rechargeable - Market size and forecast 2024-2029 ($ million)
- Chart on Rechargeable - Year-over-year growth 2024-2029 (%)
- Data Table on Rechargeable - Year-over-year growth 2024-2029 (%)
- 11.6 Others - Market size and forecast 2024-2029
- Chart on Others - Market size and forecast 2024-2029 ($ million)
- Data Table on Others - Market size and forecast 2024-2029 ($ million)
- Chart on Others - Year-over-year growth 2024-2029 (%)
- Data Table on Others - Year-over-year growth 2024-2029 (%)
- 11.7 Market opportunity by Source
- Market opportunity by Source ($ million)
- Data Table on Market opportunity by Source ($ million)
12 Customer Landscape
- 12.1 Customer landscape overview
- Analysis of price sensitivity, lifecycle, customer purchase basket, adoption rates, and purchase criteria
13 Geographic Landscape
- 13.1 Geographic segmentation
- Chart on Market share By Geographical Landscape 2024-2029 (%)
- Data Table on Market share By Geographical Landscape 2024-2029 (%)
- 13.2 Geographic comparison
- Chart on Geographic comparison
- Data Table on Geographic comparison
- 13.3 North America - Market size and forecast 2024-2029
- Chart on North America - Market size and forecast 2024-2029 ($ million)
- Data Table on North America - Market size and forecast 2024-2029 ($ million)
- Chart on North America - Year-over-year growth 2024-2029 (%)
- Data Table on North America - Year-over-year growth 2024-2029 (%)
- 13.4 Europe - Market size and forecast 2024-2029
- Chart on Europe - Market size and forecast 2024-2029 ($ million)
- Data Table on Europe - Market size and forecast 2024-2029 ($ million)
- Chart on Europe - Year-over-year growth 2024-2029 (%)
- Data Table on Europe - Year-over-year growth 2024-2029 (%)
- 13.5 APAC - Market size and forecast 2024-2029
- Chart on APAC - Market size and forecast 2024-2029 ($ million)
- Data Table on APAC - Market size and forecast 2024-2029 ($ million)
- Chart on APAC - Year-over-year growth 2024-2029 (%)
- Data Table on APAC - Year-over-year growth 2024-2029 (%)
- 13.6 South America - Market size and forecast 2024-2029
- Chart on South America - Market size and forecast 2024-2029 ($ million)
- Data Table on South America - Market size and forecast 2024-2029 ($ million)
- Chart on South America - Year-over-year growth 2024-2029 (%)
- Data Table on South America - Year-over-year growth 2024-2029 (%)
- 13.7 Middle East and Africa - Market size and forecast 2024-2029
- Chart on Middle East and Africa - Market size and forecast 2024-2029 ($ million)
- Data Table on Middle East and Africa - Market size and forecast 2024-2029 ($ million)
- Chart on Middle East and Africa - Year-over-year growth 2024-2029 (%)
- Data Table on Middle East and Africa - Year-over-year growth 2024-2029 (%)
- 13.8 US - Market size and forecast 2024-2029
- Chart on US - Market size and forecast 2024-2029 ($ million)
- Data Table on US - Market size and forecast 2024-2029 ($ million)
- Chart on US - Year-over-year growth 2024-2029 (%)
- Data Table on US - Year-over-year growth 2024-2029 (%)
- 13.9 Germany - Market size and forecast 2024-2029
- Chart on Germany - Market size and forecast 2024-2029 ($ million)
- Data Table on Germany - Market size and forecast 2024-2029 ($ million)
- Chart on Germany - Year-over-year growth 2024-2029 (%)
- Data Table on Germany - Year-over-year growth 2024-2029 (%)
- 13.10 UK - Market size and forecast 2024-2029
- Chart on UK - Market size and forecast 2024-2029 ($ million)
- Data Table on UK - Market size and forecast 2024-2029 ($ million)
- Chart on UK - Year-over-year growth 2024-2029 (%)
- Data Table on UK - Year-over-year growth 2024-2029 (%)
- 13.11 France - Market size and forecast 2024-2029
- Chart on France - Market size and forecast 2024-2029 ($ million)
- Data Table on France - Market size and forecast 2024-2029 ($ million)
- Chart on France - Year-over-year growth 2024-2029 (%)
- Data Table on France - Year-over-year growth 2024-2029 (%)
- 13.12 Canada - Market size and forecast 2024-2029
- Chart on Canada - Market size and forecast 2024-2029 ($ million)
- Data Table on Canada - Market size and forecast 2024-2029 ($ million)
- Chart on Canada - Year-over-year growth 2024-2029 (%)
- Data Table on Canada - Year-over-year growth 2024-2029 (%)
- 13.13 Australia - Market size and forecast 2024-2029
- Chart on Australia - Market size and forecast 2024-2029 ($ million)
- Data Table on Australia - Market size and forecast 2024-2029 ($ million)
- Chart on Australia - Year-over-year growth 2024-2029 (%)
- Data Table on Australia - Year-over-year growth 2024-2029 (%)
- 13.14 China - Market size and forecast 2024-2029
- Chart on China - Market size and forecast 2024-2029 ($ million)
- Data Table on China - Market size and forecast 2024-2029 ($ million)
- Chart on China - Year-over-year growth 2024-2029 (%)
- Data Table on China - Year-over-year growth 2024-2029 (%)
- 13.15 Japan - Market size and forecast 2024-2029
- Chart on Japan - Market size and forecast 2024-2029 ($ million)
- Data Table on Japan - Market size and forecast 2024-2029 ($ million)
- Chart on Japan - Year-over-year growth 2024-2029 (%)
- Data Table on Japan - Year-over-year growth 2024-2029 (%)
- 13.16 Italy - Market size and forecast 2024-2029
- Chart on Italy - Market size and forecast 2024-2029 ($ million)
- Data Table on Italy - Market size and forecast 2024-2029 ($ million)
- Chart on Italy - Year-over-year growth 2024-2029 (%)
- Data Table on Italy - Year-over-year growth 2024-2029 (%)
- 13.17 Spain - Market size and forecast 2024-2029
- Chart on Spain - Market size and forecast 2024-2029 ($ million)
- Data Table on Spain - Market size and forecast 2024-2029 ($ million)
- Chart on Spain - Year-over-year growth 2024-2029 (%)
- Data Table on Spain - Year-over-year growth 2024-2029 (%)
- 13.18 Market opportunity By Geographical Landscape
- Market opportunity By Geographical Landscape ($ million)
- Data Tables on Market opportunity By Geographical Landscape ($ million)
14 Drivers, Challenges, and Opportunity/Restraints
- 14.1 Market drivers
- 14.2 Market challenges
- 14.3 Impact of drivers and challenges
- Impact of drivers and challenges in 2024 and 2029
- 14.4 Market opportunities/restraints
15 Competitive Landscape
- 15.1 Overview
- 15.2 Competitive Landscape
- Overview on criticality of inputs and factors of differentiation
- 15.3 Landscape disruption
- Overview on factors of disruption
- 15.4 Industry risks
- Impact of key risks on business
16 Competitive Analysis
- 16.1 Companies profiled
- Companies covered
- 16.2 Company ranking index
- Company ranking index
- 16.3 Market positioning of companies
- Matrix on companies position and classification
- 16.4 Decathlon SA
- Decathlon SA - Overview
- Decathlon SA - Product / Service
- Decathlon SA - Key offerings
- SWOT
- 16.5 Extreme Lights
- Extreme Lights - Overview
- Extreme Lights - Product / Service
- Extreme Lights - Key offerings
- SWOT
- 16.6 Johnson Outdoors Inc.
- Johnson Outdoors Inc. - Overview
- Johnson Outdoors Inc. - Business segments
- Johnson Outdoors Inc. - Key offerings
- Johnson Outdoors Inc. - Segment focus
- SWOT
- 16.7 KLARUS Lighting Technology Co. Ltd.
- KLARUS Lighting Technology Co. Ltd. - Overview
- KLARUS Lighting Technology Co. Ltd. - Product / Service
- KLARUS Lighting Technology Co. Ltd. - Key offerings
- SWOT
- 16.8 Koninklijke Philips NV
- Koninklijke Philips NV - Overview
- Koninklijke Philips NV - Business segments
- Koninklijke Philips NV - Key news
- Koninklijke Philips NV - Key offerings
- Koninklijke Philips NV - Segment focus
- SWOT
- 16.9 LUMINTOP
- LUMINTOP - Overview
- LUMINTOP - Product / Service
- LUMINTOP - Key offerings
- SWOT
- 16.10 Newell Brands Inc.
- Newell Brands Inc. - Overview
- Newell Brands Inc. - Business segments
- Newell Brands Inc. - Key news
- Newell Brands Inc. - Key offerings
- Newell Brands Inc. - Segment focus
- SWOT
- 16.11 Nitecore
- Nitecore - Overview
- Nitecore - Product / Service
- Nitecore - Key offerings
- SWOT
- 16.12 OSRAM GmbH
- OSRAM GmbH - Overview
- OSRAM GmbH - Business segments
- OSRAM GmbH - Key news
- OSRAM GmbH - Key offerings
- OSRAM GmbH - Segment focus
- SWOT
- 16.13 Paddy Pallin PTY LTD
- Paddy Pallin PTY LTD - Overview
- Paddy Pallin PTY LTD - Product / Service
- Paddy Pallin PTY LTD - Key offerings
- SWOT
- 16.14 Surya Roshni Ltd
- Surya Roshni Ltd - Overview
- Surya Roshni Ltd - Product / Service
- Surya Roshni Ltd - Key offerings
- SWOT
- 16.15 Syska Led Lights Pvt. Ltd.
- Syska Led Lights Pvt. Ltd. - Overview
- Syska Led Lights Pvt. Ltd. - Product / Service
- Syska Led Lights Pvt. Ltd. - Key offerings
- SWOT
- 16.16 Toshiba Corp.
- Toshiba Corp. - Overview
- Toshiba Corp. - Business segments
- Toshiba Corp. - Key news
- Toshiba Corp. - Key offerings
- Toshiba Corp. - Segment focus
- SWOT
- 16.17 Wipro Ltd.
- Wipro Ltd. - Overview
- Wipro Ltd. - Business segments
- Wipro Ltd. - Key news
- Wipro Ltd. - Key offerings
- Wipro Ltd. - Segment focus
- SWOT
- 16.18 Yalumi Corp.
- Yalumi Corp. - Overview
- Yalumi Corp. - Product / Service
- Yalumi Corp. - Key offerings
- SWOT
17 Appendix
- 17.1 Scope of the report
- 17.2 Inclusions and exclusions checklist
- Inclusions checklist
- Exclusions checklist
- 17.3 Currency conversion rates for US$
- Currency conversion rates for US$
- 17.4 Research methodology
- Research methodology
- 17.5 Data procurement
- Information sources
- 17.6 Data validation
- Data validation
- 17.7 Validation techniques employed for market sizing
- Validation techniques employed for market sizing
- 17.8 Data synthesis
- Data synthesis
- 17.9 360 degree market analysis
- 360 degree market analysis
- 17.10 List of abbreviations
- List of abbreviations

