|
|
市場調査レポート
商品コード
1657138
オフショアデコミッショニングの世界市場 2025~2029年Global Offshore Decommissioning Market 2025-2029 |
||||||

|
|||||||
カスタマイズ可能
|
|||||||

| オフショアデコミッショニングの世界市場 2025~2029年 |
|
出版日: 2025年02月08日
発行: TechNavio
ページ情報: 英文 241 Pages
納期: 即納可能
|

全表示
- 概要
- 目次
オフショアデコミッショニング市場は2024~2029年に31億8,900万米ドル、予測期間中のCAGRは7.9%で成長すると予測されます。
当レポートでは、オフショアデコミッショニング市場の全体的な分析、市場規模・予測、動向、成長促進要因、課題、約25のベンダーを網羅したベンダー分析などを掲載しています。
現在の市場シナリオ、最新動向と促進要因、市場環境全体に関する最新分析を提供しています。市場は、成熟しつつある石油・ガス田と老朽化したプラットフォーム、オフショアデコミッショニング活動に対する強力な規制、オフショア限界鉱区の高い潜在力によって牽引されています。
| 市場範囲 | |
|---|---|
| 基準年 | 2025年 |
| 終了年 | 2029年 |
| 予測期間 | 2025~2029年 |
| 成長モメンタム | 加速 |
| 前年比[2025年] | 7.1% |
| CAGR | 7.9% |
| 増分額 | 31億8,900万米ドル |
本調査は、産業の主要参加者からのインプットを含め、一次情報と二次情報を客観的に組み合わせて実施しました。レポートには、主要企業の分析に加え、包括的な市場規模データ、地域別分析によるセグメント、ベンダー情勢が含まれています。レポートには過去データと予測データがあります。
本調査では、今後数年間のオフショアデコミッショニング市場の成長を促進する主要理由の一つとして、再生可能エネルギーへの投資の高まりを挙げています。また、廃棄後のモニタリングやシングルリフトの廃止措置、新たな石油・ガス資源の発見における技術革新は、市場の大きな需要につながります。
目次
第1章 エグゼクティブサマリー
- 市場概要
第2章 Technavio分析
- 価格・ライフサイクル・顧客購入バスケット・採用率・購入基準の分析
- インプットの重要性と差別化の要因
- 混乱の要因
- 促進要因と課題の影響
第3章 市場情勢
- 市場エコシステム
- 市場の特徴
- バリューチェーン分析
第4章 市場規模
- 市場の定義
- 市場セグメント分析
- 市場規模 2024年
- 市場の展望 2024~2029年
第5章 市場規模実績
- オフショアデコミッショニングの世界市場 2019~2023年
- タイプ別セグメント分析 2019~2023年
- サービス別セグメント分析 2019~2023年
- 用途別セグメント分析 2019~2023年
- 事業別セグメント分析 2019~2023年
- 地域別セグメント分析 2019~2023年
- 国別セグメント分析 2019~2023年
第6章 定性分析
- AIの影響-オフショアデコミッショニングの世界市場
第7章 ファイブフォース分析
- ファイブフォースの要約
- 買い手の交渉力
- 供給企業の交渉力
- 新規参入業者の脅威
- 代替品の脅威
- 競争の脅威
- 市況
第8章 市場セグメンテーション:タイプ別
- 市場セグメント
- 比較:タイプ別
- 浅瀬:市場規模と予測 2024~2029年
- 深海:市場規模と予測 2024~2029年
- 市場機会:タイプ別
第9章 市場セグメンテーション:サービス別
- 市場セグメント
- 比較:サービス別
- 坑井の封鎖と放棄:市場規模と予測 2024~2029年
- プラットフォームの削除:市場規模と予測 2024~2029年
- 許可と規制遵守:市場規模と予測 2024~2029年
- プラットフォームの準備:市場規模と予測 2024~2029年
- その他:市場規模と予測 2024~2029年
- 市場機会:サービス別
第10章 市場セグメンテーション:用途別
- 市場セグメント
- 比較:用途別
- 上部:市場規模と予測 2024~2029年
- 下部構造:市場規模と予測 2024~2029年
- 市場機会:用途別
第11章 市場セグメンテーション:事業別
- 市場セグメント
- 比較:事業別
- 完全除去:市場規模と予測 2024~2029年
- 部分的除去:市場規模と予測 2024~2029年
- 現状放置:市場規模と予測 2024~2029年
- 市場機会:事業別
第12章 顧客情勢
- 顧客情勢概要
第13章 地域別情勢
- 地域別セグメンテーション
- 比較:地域別
- 欧州:市場規模と予測 2024~2029年
- 北米:市場規模と予測 2024~2029年
- アジア太平洋:市場規模と予測 2024~2029年
- 南米:市場規模と予測 2024~2029年
- 中東・アフリカ:市場規模と予測 2024~2029年
- 米国:市場規模と予測 2024~2029年
- 英国:市場規模と予測 2024~2029年
- ノルウェー:市場規模と予測 2024~2029年
- デンマーク:市場規模と予測 2024~2029年
- ブラジル:市場規模と予測 2024~2029年
- ドイツ:市場規模と予測 2024~2029年
- オーストラリア:市場規模と予測 2024~2029年
- フランス:市場規模と予測 2024~2029年
- 中国:市場規模と予測 2024~2029年
- イタリア:市場規模と予測 2024~2029年
- 地域情勢による市場機会
第14章 促進要因・課題・機会・抑制要因
- 市場促進要因
- 市場課題
- 促進要因と課題の影響
- 市場機会・抑制要因
第15章 競合情勢
- 概要
- 競合情勢
- 混乱の状況
- 産業のリスク
第16章 競合分析
- 企業プロファイル
- 企業ランキング指数
- 企業の市場ポジショニング
- AF Gruppen Norge AS
- Aker Solutions ASA
- Baker Hughes Co.
- Boskalis
- DeepOcean Group Holding BV
- Halliburton Co.
- Heerema International Group
- John Wood Group PLC
- Oceaneering International Inc.
- Petrofac Ltd.
- Ramboll Group AS
- Schlumberger Ltd.
- Subsea 7 SA
- TechnipFMC plc
- Weatherford International Plc
第17章 付録
The offshore decommissioning market is forecasted to grow by USD 3189 million during 2024-2029, accelerating at a CAGR of 7.9% during the forecast period. The report on the offshore decommissioning market provides a holistic analysis, market size and forecast, trends, growth drivers, and challenges, as well as vendor analysis covering around 25 vendors.
The report offers an up-to-date analysis regarding the current market scenario, the latest trends and drivers, and the overall market environment. The market is driven by maturing oil and gas fields and aging platforms, strong regulation for offshore decommissioning activities, and high potential of offshore marginal fields.
| Market Scope | |
|---|---|
| Base Year | 2025 |
| End Year | 2029 |
| Series Year | 2025-2029 |
| Growth Momentum | Accelerate |
| YOY 2025 | 7.1% |
| CAGR | 7.9% |
| Incremental Value | $3189 mn |
The study was conducted using an objective combination of primary and secondary information including inputs from key participants in the industry. The report contains a comprehensive market size data, segment with regional analysis and vendor landscape in addition to an analysis of the key companies. Reports have historic and forecast data.
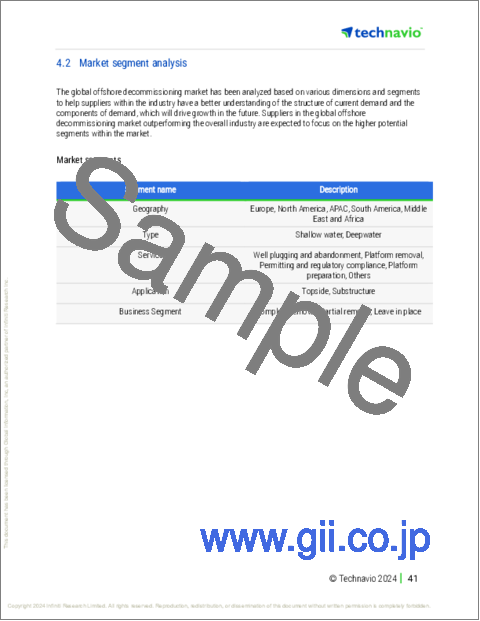
Technavio's offshore decommissioning market is segmented as below:
By Type
- Shallow water
- Deepwater
By Service
- Well plugging and abandonment
- Platform removal
- Permitting and regulatory compliance
- Platform preparation
- Others
By Application
- Topside
- Substructure
By Business Segment
- Complete removal
- Partial removal
- Leave in place
By Geographical Landscape
- Europe
- North America
- APAC
- South America
- Middle East and Africa
This study identifies the rising investments in renewable energy as one of the prime reasons driving the offshore decommissioning market growth during the next few years. Also, innovations in post-abandonment monitoring and single lift decommissioning and discovery of new oil and gas resources will lead to sizable demand in the market.
The report on the offshore decommissioning market covers the following areas:
- Offshore Decommissioning Market sizing
- Offshore Decommissioning Market forecast
- Offshore Decommissioning Market industry analysis
The robust vendor analysis is designed to help clients improve their market position, and in line with this, this report provides a detailed analysis of several leading offshore decommissioning market vendors that include Able UK Ltd., AF Gruppen Norge AS, Aker Solutions ASA, Allseas Group SA, Baker Hughes Co., Boskalis, DeepOcean Group Holding BV, DNV Group AS, Halliburton Co., Heerema International Group, John Wood Group PLC, Oceaneering International Inc., Perenco, Petrofac Ltd., Ramboll Group AS, Saipem S.p.A., Schlumberger Ltd., Subsea 7 SA, TechnipFMC PLC, and Weatherford International PLC. Also, the offshore decommissioning market analysis report includes information on upcoming trends and challenges that will influence market growth. This is to help companies strategize and leverage all forthcoming growth opportunities.
The publisher presents a detailed picture of the market by the way of study, synthesis, and summation of data from multiple sources by an analysis of key parameters such as profit, pricing, competition, and promotions. It presents various market facets by identifying the key industry influencers. The data presented is comprehensive, reliable, and a result of extensive primary and secondary research. The market research reports provide a complete competitive landscape and an in-depth vendor selection methodology and analysis using qualitative and quantitative research to forecast accurate market growth.
Table of Contents
1 Executive Summary
- 1.1 Market overview
- Executive Summary - Chart on Market Overview
- Executive Summary - Data Table on Market Overview
- Executive Summary - Chart on Global Market Characteristics
- Executive Summary - Chart on Market By Geographical Landscape
- Executive Summary - Chart on Market Segmentation by Type
- Executive Summary - Chart on Market Segmentation by Service
- Executive Summary - Chart on Market Segmentation by Application
- Executive Summary - Chart on Market Segmentation by Business Segment
- Executive Summary - Chart on Incremental Growth
- Executive Summary - Data Table on Incremental Growth
- Executive Summary - Chart on Company Market Positioning
2 Technavio Analysis
- 2.1 Analysis of price sensitivity, lifecycle, customer purchase basket, adoption rates, and purchase criteria
- Analysis of price sensitivity, lifecycle, customer purchase basket, adoption rates, and purchase criteria
- 2.2 Criticality of inputs and Factors of differentiation
- Overview on criticality of inputs and factors of differentiation
- 2.3 Factors of disruption
- Overview on factors of disruption
- 2.4 Impact of drivers and challenges
- Impact of drivers and challenges in 2024 and 2029
3 Market Landscape
- 3.1 Market ecosystem
- Parent Market
- Data Table on - Parent Market
- 3.2 Market characteristics
- Market characteristics analysis
- 3.3 Value chain analysis
- Value chain analysis
4 Market Sizing
- 4.1 Market definition
- Offerings of companies included in the market definition
- 4.2 Market segment analysis
- Market segments
- 4.3 Market size 2024
- 4.4 Market outlook: Forecast for 2024-2029
- Chart on Global - Market size and forecast 2024-2029 ($ million)
- Data Table on Global - Market size and forecast 2024-2029 ($ million)
- Chart on Global Market: Year-over-year growth 2024-2029 (%)
- Data Table on Global Market: Year-over-year growth 2024-2029 (%)
5 Historic Market Size
- 5.1 Global Offshore Decommissioning Market 2019 - 2023
- Historic Market Size - Data Table on Global Offshore Decommissioning Market 2019 - 2023 ($ million)
- 5.2 Type segment analysis 2019 - 2023
- Historic Market Size - Type Segment 2019 - 2023 ($ million)
- 5.3 Service segment analysis 2019 - 2023
- Historic Market Size - Service Segment 2019 - 2023 ($ million)
- 5.4 Application segment analysis 2019 - 2023
- Historic Market Size - Application Segment 2019 - 2023 ($ million)
- 5.5 Business segment analysis 2019 - 2023
- Historic Market Size - Business Segment 2019 - 2023 ($ million)
- 5.6 Geography segment analysis 2019 - 2023
- Historic Market Size - Geography Segment 2019 - 2023 ($ million)
- 5.7 Country segment analysis 2019 - 2023
- Historic Market Size - Country Segment 2019 - 2023 ($ million)
6 Qualitative Analysis
- 6.1 Impact of AI on global offshore decommissioning market
7 Five Forces Analysis
- 7.1 Five forces summary
- Five forces analysis - Comparison between 2024 and 2029
- 7.2 Bargaining power of buyers
- Bargaining power of buyers - Impact of key factors 2024 and 2029
- 7.3 Bargaining power of suppliers
- Bargaining power of suppliers - Impact of key factors in 2024 and 2029
- 7.4 Threat of new entrants
- Threat of new entrants - Impact of key factors in 2024 and 2029
- 7.5 Threat of substitutes
- Threat of substitutes - Impact of key factors in 2024 and 2029
- 7.6 Threat of rivalry
- Threat of rivalry - Impact of key factors in 2024 and 2029
- 7.7 Market condition
- Chart on Market condition - Five forces 2024 and 2029
8 Market Segmentation by Type
- 8.1 Market segments
- Chart on Type - Market share 2024-2029 (%)
- Data Table on Type - Market share 2024-2029 (%)
- 8.2 Comparison by Type
- Chart on Comparison by Type
- Data Table on Comparison by Type
- 8.3 Shallow water - Market size and forecast 2024-2029
- Chart on Shallow water - Market size and forecast 2024-2029 ($ million)
- Data Table on Shallow water - Market size and forecast 2024-2029 ($ million)
- Chart on Shallow water - Year-over-year growth 2024-2029 (%)
- Data Table on Shallow water - Year-over-year growth 2024-2029 (%)
- 8.4 Deepwater - Market size and forecast 2024-2029
- Chart on Deepwater - Market size and forecast 2024-2029 ($ million)
- Data Table on Deepwater - Market size and forecast 2024-2029 ($ million)
- Chart on Deepwater - Year-over-year growth 2024-2029 (%)
- Data Table on Deepwater - Year-over-year growth 2024-2029 (%)
- 8.5 Market opportunity by Type
- Market opportunity by Type ($ million)
- Data Table on Market opportunity by Type ($ million)
9 Market Segmentation by Service
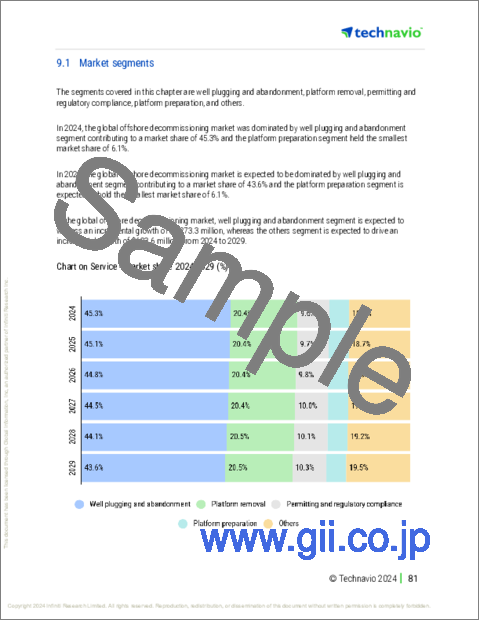
- 9.1 Market segments
- Chart on Service - Market share 2024-2029 (%)
- Data Table on Service - Market share 2024-2029 (%)
- 9.2 Comparison by Service
- Chart on Comparison by Service
- Data Table on Comparison by Service
- 9.3 Well plugging and abandonment - Market size and forecast 2024-2029
- Chart on Well plugging and abandonment - Market size and forecast 2024-2029 ($ million)
- Data Table on Well plugging and abandonment - Market size and forecast 2024-2029 ($ million)
- Chart on Well plugging and abandonment - Year-over-year growth 2024-2029 (%)
- Data Table on Well plugging and abandonment - Year-over-year growth 2024-2029 (%)
- 9.4 Platform removal - Market size and forecast 2024-2029
- Chart on Platform removal - Market size and forecast 2024-2029 ($ million)
- Data Table on Platform removal - Market size and forecast 2024-2029 ($ million)
- Chart on Platform removal - Year-over-year growth 2024-2029 (%)
- Data Table on Platform removal - Year-over-year growth 2024-2029 (%)
- 9.5 Permitting and regulatory compliance - Market size and forecast 2024-2029
- Chart on Permitting and regulatory compliance - Market size and forecast 2024-2029 ($ million)
- Data Table on Permitting and regulatory compliance - Market size and forecast 2024-2029 ($ million)
- Chart on Permitting and regulatory compliance - Year-over-year growth 2024-2029 (%)
- Data Table on Permitting and regulatory compliance - Year-over-year growth 2024-2029 (%)
- 9.6 Platform preparation - Market size and forecast 2024-2029
- Chart on Platform preparation - Market size and forecast 2024-2029 ($ million)
- Data Table on Platform preparation - Market size and forecast 2024-2029 ($ million)
- Chart on Platform preparation - Year-over-year growth 2024-2029 (%)
- Data Table on Platform preparation - Year-over-year growth 2024-2029 (%)
- 9.7 Others - Market size and forecast 2024-2029
- Chart on Others - Market size and forecast 2024-2029 ($ million)
- Data Table on Others - Market size and forecast 2024-2029 ($ million)
- Chart on Others - Year-over-year growth 2024-2029 (%)
- Data Table on Others - Year-over-year growth 2024-2029 (%)
- 9.8 Market opportunity by Service
- Market opportunity by Service ($ million)
- Data Table on Market opportunity by Service ($ million)
10 Market Segmentation by Application
- 10.1 Market segments
- Chart on Application - Market share 2024-2029 (%)
- Data Table on Application - Market share 2024-2029 (%)
- 10.2 Comparison by Application
- Chart on Comparison by Application
- Data Table on Comparison by Application
- 10.3 Topside - Market size and forecast 2024-2029
- Chart on Topside - Market size and forecast 2024-2029 ($ million)
- Data Table on Topside - Market size and forecast 2024-2029 ($ million)
- Chart on Topside - Year-over-year growth 2024-2029 (%)
- Data Table on Topside - Year-over-year growth 2024-2029 (%)
- 10.4 Substructure - Market size and forecast 2024-2029
- Chart on Substructure - Market size and forecast 2024-2029 ($ million)
- Data Table on Substructure - Market size and forecast 2024-2029 ($ million)
- Chart on Substructure - Year-over-year growth 2024-2029 (%)
- Data Table on Substructure - Year-over-year growth 2024-2029 (%)
- 10.5 Market opportunity by Application
- Market opportunity by Application ($ million)
- Data Table on Market opportunity by Application ($ million)
11 Market Segmentation by Business Segment
- 11.1 Market segments
- Chart on Market Segmentation by Business Segment - Market share 2024-2029 (%)
- Data Table on Market Segmentation by Business Segment - Market share 2024-2029 (%)
- 11.2 Comparison by by Business Segment
- Chart on Comparison by Market Segmentation by Business Segment
- Data Table on Comparison by Market Segmentation by Business Segment
- 11.3 Complete removal - Market size and forecast 2024-2029
- Chart on Complete removal - Market size and forecast 2024-2029 ($ million)
- Data Table on Complete removal - Market size and forecast 2024-2029 ($ million)
- Chart on Complete removal - Year-over-year growth 2024-2029 (%)
- Data Table on Complete removal - Year-over-year growth 2024-2029 (%)
- 11.4 Partial removal - Market size and forecast 2024-2029
- Chart on Partial removal - Market size and forecast 2024-2029 ($ million)
- Data Table on Partial removal - Market size and forecast 2024-2029 ($ million)
- Chart on Partial removal - Year-over-year growth 2024-2029 (%)
- Data Table on Partial removal - Year-over-year growth 2024-2029 (%)
- 11.5 Leave in place - Market size and forecast 2024-2029
- Chart on Leave in place - Market size and forecast 2024-2029 ($ million)
- Data Table on Leave in place - Market size and forecast 2024-2029 ($ million)
- Chart on Leave in place - Year-over-year growth 2024-2029 (%)
- Data Table on Leave in place - Year-over-year growth 2024-2029 (%)
- 11.6 Market opportunity by Business Segment
- Market opportunity by Market Segmentation by Business Segment ($ million)
- Data Table on Market opportunity by Market Segmentation by Business Segment ($ million)
12 Customer Landscape
- 12.1 Customer landscape overview
- Analysis of price sensitivity, lifecycle, customer purchase basket, adoption rates, and purchase criteria
13 Geographic Landscape
- 13.1 Geographic segmentation
- Chart on Market share By Geographical Landscape 2024-2029 (%)
- Data Table on Market share By Geographical Landscape 2024-2029 (%)
- 13.2 Geographic comparison
- Chart on Geographic comparison
- Data Table on Geographic comparison
- 13.3 Europe - Market size and forecast 2024-2029
- Chart on Europe - Market size and forecast 2024-2029 ($ million)
- Data Table on Europe - Market size and forecast 2024-2029 ($ million)
- Chart on Europe - Year-over-year growth 2024-2029 (%)
- Data Table on Europe - Year-over-year growth 2024-2029 (%)
- 13.4 North America - Market size and forecast 2024-2029
- Chart on North America - Market size and forecast 2024-2029 ($ million)
- Data Table on North America - Market size and forecast 2024-2029 ($ million)
- Chart on North America - Year-over-year growth 2024-2029 (%)
- Data Table on North America - Year-over-year growth 2024-2029 (%)
- 13.5 APAC - Market size and forecast 2024-2029
- Chart on APAC - Market size and forecast 2024-2029 ($ million)
- Data Table on APAC - Market size and forecast 2024-2029 ($ million)
- Chart on APAC - Year-over-year growth 2024-2029 (%)
- Data Table on APAC - Year-over-year growth 2024-2029 (%)
- 13.6 South America - Market size and forecast 2024-2029
- Chart on South America - Market size and forecast 2024-2029 ($ million)
- Data Table on South America - Market size and forecast 2024-2029 ($ million)
- Chart on South America - Year-over-year growth 2024-2029 (%)
- Data Table on South America - Year-over-year growth 2024-2029 (%)
- 13.7 Middle East and Africa - Market size and forecast 2024-2029
- Chart on Middle East and Africa - Market size and forecast 2024-2029 ($ million)
- Data Table on Middle East and Africa - Market size and forecast 2024-2029 ($ million)
- Chart on Middle East and Africa - Year-over-year growth 2024-2029 (%)
- Data Table on Middle East and Africa - Year-over-year growth 2024-2029 (%)
- 13.8 US - Market size and forecast 2024-2029
- Chart on US - Market size and forecast 2024-2029 ($ million)
- Data Table on US - Market size and forecast 2024-2029 ($ million)
- Chart on US - Year-over-year growth 2024-2029 (%)
- Data Table on US - Year-over-year growth 2024-2029 (%)
- 13.9 UK - Market size and forecast 2024-2029
- Chart on UK - Market size and forecast 2024-2029 ($ million)
- Data Table on UK - Market size and forecast 2024-2029 ($ million)
- Chart on UK - Year-over-year growth 2024-2029 (%)
- Data Table on UK - Year-over-year growth 2024-2029 (%)
- 13.10 Norway - Market size and forecast 2024-2029
- Chart on Norway - Market size and forecast 2024-2029 ($ million)
- Data Table on Norway - Market size and forecast 2024-2029 ($ million)
- Chart on Norway - Year-over-year growth 2024-2029 (%)
- Data Table on Norway - Year-over-year growth 2024-2029 (%)
- 13.11 Denmark - Market size and forecast 2024-2029
- Chart on Denmark - Market size and forecast 2024-2029 ($ million)
- Data Table on Denmark - Market size and forecast 2024-2029 ($ million)
- Chart on Denmark - Year-over-year growth 2024-2029 (%)
- Data Table on Denmark - Year-over-year growth 2024-2029 (%)
- 13.12 Brazil - Market size and forecast 2024-2029
- Chart on Brazil - Market size and forecast 2024-2029 ($ million)
- Data Table on Brazil - Market size and forecast 2024-2029 ($ million)
- Chart on Brazil - Year-over-year growth 2024-2029 (%)
- Data Table on Brazil - Year-over-year growth 2024-2029 (%)
- 13.13 Germany - Market size and forecast 2024-2029
- Chart on Germany - Market size and forecast 2024-2029 ($ million)
- Data Table on Germany - Market size and forecast 2024-2029 ($ million)
- Chart on Germany - Year-over-year growth 2024-2029 (%)
- Data Table on Germany - Year-over-year growth 2024-2029 (%)
- 13.14 Australia - Market size and forecast 2024-2029
- Chart on Australia - Market size and forecast 2024-2029 ($ million)
- Data Table on Australia - Market size and forecast 2024-2029 ($ million)
- Chart on Australia - Year-over-year growth 2024-2029 (%)
- Data Table on Australia - Year-over-year growth 2024-2029 (%)
- 13.15 France - Market size and forecast 2024-2029
- Chart on France - Market size and forecast 2024-2029 ($ million)
- Data Table on France - Market size and forecast 2024-2029 ($ million)
- Chart on France - Year-over-year growth 2024-2029 (%)
- Data Table on France - Year-over-year growth 2024-2029 (%)
- 13.16 China - Market size and forecast 2024-2029
- Chart on China - Market size and forecast 2024-2029 ($ million)
- Data Table on China - Market size and forecast 2024-2029 ($ million)
- Chart on China - Year-over-year growth 2024-2029 (%)
- Data Table on China - Year-over-year growth 2024-2029 (%)
- 13.17 Italy - Market size and forecast 2024-2029
- Chart on Italy - Market size and forecast 2024-2029 ($ million)
- Data Table on Italy - Market size and forecast 2024-2029 ($ million)
- Chart on Italy - Year-over-year growth 2024-2029 (%)
- Data Table on Italy - Year-over-year growth 2024-2029 (%)
- 13.18 Market opportunity By Geographical Landscape
- Market opportunity By Geographical Landscape ($ million)
- Data Tables on Market opportunity By Geographical Landscape ($ million)
14 Drivers, Challenges, and Opportunity/Restraints
- 14.1 Market drivers
- 14.2 Market challenges
- 14.3 Impact of drivers and challenges
- Impact of drivers and challenges in 2024 and 2029
- 14.4 Market opportunities/restraints
15 Competitive Landscape
- 15.1 Overview
- 15.2 Competitive Landscape
- Overview on criticality of inputs and factors of differentiation
- 15.3 Landscape disruption
- Overview on factors of disruption
- 15.4 Industry risks
- Impact of key risks on business
16 Competitive Analysis
- 16.1 Companies profiled
- Companies covered
- 16.2 Company ranking index
- Company ranking index
- 16.3 Market positioning of companies
- Matrix on companies position and classification
- 16.4 AF Gruppen Norge AS
- AF Gruppen Norge AS - Overview
- AF Gruppen Norge AS - Business segments
- AF Gruppen Norge AS - Key offerings
- AF Gruppen Norge AS - Segment focus
- SWOT
- 16.5 Aker Solutions ASA
- Aker Solutions ASA - Overview
- Aker Solutions ASA - Business segments
- Aker Solutions ASA - Key news
- Aker Solutions ASA - Key offerings
- Aker Solutions ASA - Segment focus
- SWOT
- 16.6 Baker Hughes Co.
- Baker Hughes Co. - Overview
- Baker Hughes Co. - Business segments
- Baker Hughes Co. - Key news
- Baker Hughes Co. - Key offerings
- Baker Hughes Co. - Segment focus
- SWOT
- 16.7 Boskalis
- Boskalis - Overview
- Boskalis - Product / Service
- Boskalis - Key offerings
- SWOT
- 16.8 DeepOcean Group Holding BV
- DeepOcean Group Holding BV - Overview
- DeepOcean Group Holding BV - Product / Service
- DeepOcean Group Holding BV - Key offerings
- SWOT
- 16.9 Halliburton Co.
- Halliburton Co. - Overview
- Halliburton Co. - Business segments
- Halliburton Co. - Key news
- Halliburton Co. - Key offerings
- Halliburton Co. - Segment focus
- SWOT
- 16.10 Heerema International Group
- Heerema International Group - Overview
- Heerema International Group - Product / Service
- Heerema International Group - Key offerings
- SWOT
- 16.11 John Wood Group PLC
- John Wood Group PLC - Overview
- John Wood Group PLC - Business segments
- John Wood Group PLC - Key offerings
- John Wood Group PLC - Segment focus
- SWOT
- 16.12 Oceaneering International Inc.
- Oceaneering International Inc. - Overview
- Oceaneering International Inc. - Product / Service
- Oceaneering International Inc. - Key offerings
- SWOT
- 16.13 Petrofac Ltd.
- Petrofac Ltd. - Overview
- Petrofac Ltd. - Business segments
- Petrofac Ltd. - Key offerings
- Petrofac Ltd. - Segment focus
- SWOT
- 16.14 Ramboll Group AS
- Ramboll Group AS - Overview
- Ramboll Group AS - Product / Service
- Ramboll Group AS - Key offerings
- SWOT
- 16.15 Schlumberger Ltd.
- Schlumberger Ltd. - Overview
- Schlumberger Ltd. - Business segments
- Schlumberger Ltd. - Key news
- Schlumberger Ltd. - Key offerings
- Schlumberger Ltd. - Segment focus
- SWOT
- 16.16 Subsea 7 SA
- Subsea 7 SA - Overview
- Subsea 7 SA - Business segments
- Subsea 7 SA - Key offerings
- Subsea 7 SA - Segment focus
- SWOT
- 16.17 TechnipFMC plc
- TechnipFMC plc - Overview
- TechnipFMC plc - Business segments
- TechnipFMC plc - Key news
- TechnipFMC plc - Key offerings
- TechnipFMC plc - Segment focus
- SWOT
- 16.18 Weatherford International Plc
- Weatherford International Plc - Overview
- Weatherford International Plc - Business segments
- Weatherford International Plc - Key news
- Weatherford International Plc - Key offerings
- Weatherford International Plc - Segment focus
- SWOT
17 Appendix
- 17.1 Scope of the report
- 17.2 Inclusions and exclusions checklist
- Inclusions checklist
- Exclusions checklist
- 17.3 Currency conversion rates for US$
- Currency conversion rates for US$
- 17.4 Research methodology
- Research methodology
- 17.5 Data procurement
- Information sources
- 17.6 Data validation
- Data validation
- 17.7 Validation techniques employed for market sizing
- Validation techniques employed for market sizing
- 17.8 Data synthesis
- Data synthesis
- 17.9 360 degree market analysis
- 360 degree market analysis
- 17.10 List of abbreviations
- List of abbreviations
