|
|
市場調査レポート
商品コード
1516166
研磨ブラスト装置の世界市場 2024-2028Global abrasive blasting equipment market 2024-2028 |
||||||

|
|||||||
カスタマイズ可能
|
|||||||

| 研磨ブラスト装置の世界市場 2024-2028 |
|
出版日: 2024年06月11日
発行: TechNavio
ページ情報: 英文 168 Pages
納期: 即納可能
|

全表示
- 概要
- 図表
- 目次
研磨ブラスト装置市場は2023-2028年に1億4,830万米ドル、予測期間中のCAGRは5.36%で成長すると予測されています。
当レポートでは、研磨ブラスト装置市場の全体的な分析、市場規模・予測、動向、成長促進要因、課題、約25のベンダーを網羅したベンダー分析などを掲載しています。
現在の市場シナリオ、最新動向と促進要因、市場環境全体に関する最新分析を提供しています。市場は、航空宇宙ヘルスケアおよび家具産業の急成長、自動車産業からの需要拡大、新興国および米国における建設活動の活発化によって牽引されています。
| 市場範囲 | |
|---|---|
| 基準年 | 2024 |
| 終了年 | 2028 |
| 予測期間 | 2024-2028 |
| 成長モメンタム | 加速 |
| 前年比2024年 | 4.99% |
| CAGR | 5.36% |
| 増分額 | 1億4,830万米ドル |
本調査では、今後数年間の研磨ブラスト装置市場の成長を促進する主な要因の1つとして、eコマースを活用して市場への浸透を図ることを挙げています。また、研磨ブラストの技術進歩や研磨としての珪砂の使用減少も市場の大きな需要につながります。
目次
第1章 エグゼクティブサマリー
- 市場概要
第2章 市場情勢
- 市場エコシステム
- 市場の特徴
- バリューチェーン分析
第3章 市場規模の評価
- 市場の定義
- 市場セグメント分析
- 市場規模 2023
- 市場の見通し 2023-2028
第4章 市場規模実績
- 世界研磨ブラスト装置市場 2018-2022
- エンドユーザー別セグメント分析 2018-2022
- タイプ別セグメント分析 2018-2022
- 地域別セグメント分析 2018-2022
- 国別セグメント分析 2018-2022
第5章 ファイブフォース分析
- ファイブフォースの要約
- 買い手の交渉力
- 供給企業の交渉力
- 新規参入業者の脅威
- 代替品の脅威
- 競争の脅威
- 市況
第6章 市場セグメンテーション:エンドユーザー別
- 市場セグメンテーション
- 比較:エンドユーザー別
- 製造業:市場規模と予測 2023-2028
- 建設とメンテナンス:市場規模と予測 2023-2028
- その他:市場規模と予測 2023-2028
- 市場機会:エンドユーザー別
第7章 市場セグメンテーション:タイプ別
- 市場セグメンテーション
- 比較:タイプ別
- 半自動:市場規模と予測 2023-2028
- 自動:市場規模と予測 2023-2028
- マニュアル:市場規模と予測 2023-2028
- 市場機会:タイプ別
第8章 顧客情勢
- 顧客情勢の概要
第9章 地域別情勢
- 地域別セグメンテーション
- 地域別比較
- アジア太平洋:市場規模と予測 2023-2028
- 北米:市場規模と予測 2023-2028
- 欧州:市場規模と予測 2023-2028
- 南米:市場規模と予測 2023-2028
- 中東・アフリカ:市場規模と予測 2023-2028
- 中国:市場規模と予測 2023-2028
- 米国:市場規模と予測 2023-2028
- ドイツ:市場規模と予測 2023-2028
- 英国:市場規模と予測 2023-2028
- 日本:市場規模と予測 2023-2028
- 市場機会:地域情勢別
第10章 促進要因・課題・機会・抑制要因
- 市場促進要因
- 市場の課題
- 促進要因と課題の影響
- 市場の機会・抑制要因
第11章 競合情勢
- 概要
- 競合情勢
- 混乱の状況
- 業界のリスク
第12章 競合分析
- 企業プロファイル
- 企業の市場ポジショニング
- ABShot Tecnics SL
- AGTOS GmbH
- Airblast BV
- Axxiom Manufacturing Inc.
- BLASTCORE LLC
- Burwell Technologies
- Clemco Industries Corp.
- Empire Abrasive Equipment
- Graco Inc.
- Guyson Corp.
- Kramer Industries Inc.
- ProBlast Inc.
- Sintokogio Ltd.
- torbo ENGINEERING KEIZERS GmbH
- Viking Corp.
第13章 付録
Exhibits:
- Exhibits1: Executive Summary - Chart on Market Overview
- Exhibits2: Executive Summary - Data Table on Market Overview
- Exhibits3: Executive Summary - Chart on Global Market Characteristics
- Exhibits4: Executive Summary - Chart on Market By Geographical Landscape
- Exhibits5: Executive Summary - Chart on Market Segmentation by End-user
- Exhibits6: Executive Summary - Chart on Market Segmentation by Type
- Exhibits7: Executive Summary - Chart on Incremental Growth
- Exhibits8: Executive Summary - Data Table on Incremental Growth
- Exhibits9: Executive Summary - Chart on Company Market Positioning
- Exhibits10: Parent Market
- Exhibits11: Data Table on - Parent Market
- Exhibits12: Market characteristics analysis
- Exhibits13: Value Chain Analysis
- Exhibits14: Offerings of companies included in the market definition
- Exhibits15: Market segments
- Exhibits16: Chart on Global - Market size and forecast 2023-2028 ($ million)
- Exhibits17: Data Table on Global - Market size and forecast 2023-2028 ($ million)
- Exhibits18: Chart on Global Market: Year-over-year growth 2023-2028 (%)
- Exhibits19: Data Table on Global Market: Year-over-year growth 2023-2028 (%)
- Exhibits20: Historic Market Size - Data Table on Global Abrasive Blasting Equipment Market 2018 - 2022 ($ million)
- Exhibits21: Historic Market Size - End-user Segment 2018 - 2022 ($ million)
- Exhibits22: Historic Market Size - Type Segment 2018 - 2022 ($ million)
- Exhibits23: Historic Market Size - Geography Segment 2018 - 2022 ($ million)
- Exhibits24: Historic Market Size - Country Segment 2018 - 2022 ($ million)
- Exhibits25: Five forces analysis - Comparison between 2023 and 2028
- Exhibits26: Bargaining power of buyers - Impact of key factors 2023 and 2028
- Exhibits27: Bargaining power of suppliers - Impact of key factors in 2023 and 2028
- Exhibits28: Threat of new entrants - Impact of key factors in 2023 and 2028
- Exhibits29: Threat of substitutes - Impact of key factors in 2023 and 2028
- Exhibits30: Threat of rivalry - Impact of key factors in 2023 and 2028
- Exhibits31: Chart on Market condition - Five forces 2023 and 2028
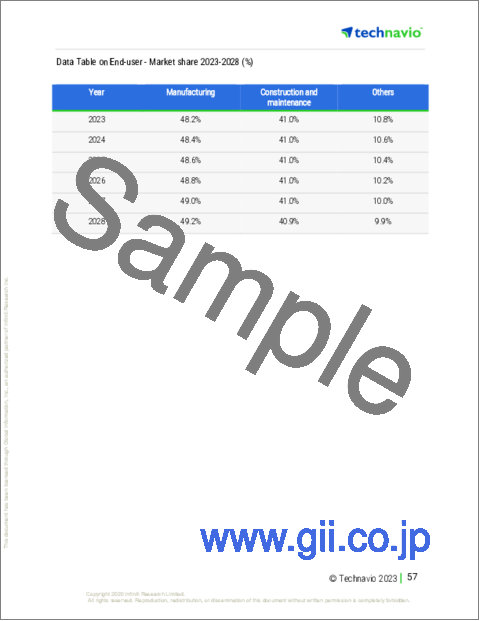
- Exhibits32: Chart on End-user - Market share 2023-2028 (%)
- Exhibits33: Data Table on End-user - Market share 2023-2028 (%)
- Exhibits34: Chart on Comparison by End-user
- Exhibits35: Data Table on Comparison by End-user
- Exhibits36: Chart on Manufacturing - Market size and forecast 2023-2028 ($ million)
- Exhibits37: Data Table on Manufacturing - Market size and forecast 2023-2028 ($ million)
- Exhibits38: Chart on Manufacturing - Year-over-year growth 2023-2028 (%)
- Exhibits39: Data Table on Manufacturing - Year-over-year growth 2023-2028 (%)
- Exhibits40: Chart on Construction and maintenance - Market size and forecast 2023-2028 ($ million)
- Exhibits41: Data Table on Construction and maintenance - Market size and forecast 2023-2028 ($ million)
- Exhibits42: Chart on Construction and maintenance - Year-over-year growth 2023-2028 (%)
- Exhibits43: Data Table on Construction and maintenance - Year-over-year growth 2023-2028 (%)
- Exhibits44: Chart on Others - Market size and forecast 2023-2028 ($ million)
- Exhibits45: Data Table on Others - Market size and forecast 2023-2028 ($ million)
- Exhibits46: Chart on Others - Year-over-year growth 2023-2028 (%)
- Exhibits47: Data Table on Others - Year-over-year growth 2023-2028 (%)
- Exhibits48: Market opportunity by End-user ($ million)
- Exhibits49: Data Table on Market opportunity by End-user ($ million)
- Exhibits50: Chart on Type - Market share 2023-2028 (%)
- Exhibits51: Data Table on Type - Market share 2023-2028 (%)
- Exhibits52: Chart on Comparison by Type
- Exhibits53: Data Table on Comparison by Type
- Exhibits54: Chart on Semi automatic - Market size and forecast 2023-2028 ($ million)
- Exhibits55: Data Table on Semi automatic - Market size and forecast 2023-2028 ($ million)
- Exhibits56: Chart on Semi automatic - Year-over-year growth 2023-2028 (%)
- Exhibits57: Data Table on Semi automatic - Year-over-year growth 2023-2028 (%)
- Exhibits58: Chart on Automatic - Market size and forecast 2023-2028 ($ million)
- Exhibits59: Data Table on Automatic - Market size and forecast 2023-2028 ($ million)
- Exhibits60: Chart on Automatic - Year-over-year growth 2023-2028 (%)
- Exhibits61: Data Table on Automatic - Year-over-year growth 2023-2028 (%)
- Exhibits62: Chart on Manual - Market size and forecast 2023-2028 ($ million)
- Exhibits63: Data Table on Manual - Market size and forecast 2023-2028 ($ million)
- Exhibits64: Chart on Manual - Year-over-year growth 2023-2028 (%)
- Exhibits65: Data Table on Manual - Year-over-year growth 2023-2028 (%)
- Exhibits66: Market opportunity by Type ($ million)
- Exhibits67: Data Table on Market opportunity by Type ($ million)
- Exhibits68: Analysis of price sensitivity, lifecycle, customer purchase basket, adoption rates, and purchase criteria
- Exhibits69: Chart on Market share By Geographical Landscape 2023-2028 (%)
- Exhibits70: Data Table on Market share By Geographical Landscape 2023-2028 (%)
- Exhibits71: Chart on Geographic comparison
- Exhibits72: Data Table on Geographic comparison
- Exhibits73: Chart on APAC - Market size and forecast 2023-2028 ($ million)
- Exhibits74: Data Table on APAC - Market size and forecast 2023-2028 ($ million)
- Exhibits75: Chart on APAC - Year-over-year growth 2023-2028 (%)
- Exhibits76: Data Table on APAC - Year-over-year growth 2023-2028 (%)
- Exhibits77: Chart on North America - Market size and forecast 2023-2028 ($ million)
- Exhibits78: Data Table on North America - Market size and forecast 2023-2028 ($ million)
- Exhibits79: Chart on North America - Year-over-year growth 2023-2028 (%)
- Exhibits80: Data Table on North America - Year-over-year growth 2023-2028 (%)
- Exhibits81: Chart on Europe - Market size and forecast 2023-2028 ($ million)
- Exhibits82: Data Table on Europe - Market size and forecast 2023-2028 ($ million)
- Exhibits83: Chart on Europe - Year-over-year growth 2023-2028 (%)
- Exhibits84: Data Table on Europe - Year-over-year growth 2023-2028 (%)
- Exhibits85: Chart on South America - Market size and forecast 2023-2028 ($ million)
- Exhibits86: Data Table on South America - Market size and forecast 2023-2028 ($ million)
- Exhibits87: Chart on South America - Year-over-year growth 2023-2028 (%)
- Exhibits88: Data Table on South America - Year-over-year growth 2023-2028 (%)
- Exhibits89: Chart on Middle East and Africa - Market size and forecast 2023-2028 ($ million)
- Exhibits90: Data Table on Middle East and Africa - Market size and forecast 2023-2028 ($ million)
- Exhibits91: Chart on Middle East and Africa - Year-over-year growth 2023-2028 (%)
- Exhibits92: Data Table on Middle East and Africa - Year-over-year growth 2023-2028 (%)
- Exhibits93: Chart on China - Market size and forecast 2023-2028 ($ million)
- Exhibits94: Data Table on China - Market size and forecast 2023-2028 ($ million)
- Exhibits95: Chart on China - Year-over-year growth 2023-2028 (%)
- Exhibits96: Data Table on China - Year-over-year growth 2023-2028 (%)
- Exhibits97: Chart on US - Market size and forecast 2023-2028 ($ million)
- Exhibits98: Data Table on US - Market size and forecast 2023-2028 ($ million)
- Exhibits99: Chart on US - Year-over-year growth 2023-2028 (%)
- Exhibits100: Data Table on US - Year-over-year growth 2023-2028 (%)
- Exhibits101: Chart on Germany - Market size and forecast 2023-2028 ($ million)
- Exhibits102: Data Table on Germany - Market size and forecast 2023-2028 ($ million)
- Exhibits103: Chart on Germany - Year-over-year growth 2023-2028 (%)
- Exhibits104: Data Table on Germany - Year-over-year growth 2023-2028 (%)
- Exhibits105: Chart on UK - Market size and forecast 2023-2028 ($ million)
- Exhibits106: Data Table on UK - Market size and forecast 2023-2028 ($ million)
- Exhibits107: Chart on UK - Year-over-year growth 2023-2028 (%)
- Exhibits108: Data Table on UK - Year-over-year growth 2023-2028 (%)
- Exhibits109: Chart on Japan - Market size and forecast 2023-2028 ($ million)
- Exhibits110: Data Table on Japan - Market size and forecast 2023-2028 ($ million)
- Exhibits111: Chart on Japan - Year-over-year growth 2023-2028 (%)
- Exhibits112: Data Table on Japan - Year-over-year growth 2023-2028 (%)
- Exhibits113: Market opportunity By Geographical Landscape ($ million)
- Exhibits114: Data Tables on Market opportunity By Geographical Landscape ($ million)
- Exhibits115: Impact of drivers and challenges in 2023 and 2028
- Exhibits116: Overview on criticality of inputs and factors of differentiation
- Exhibits117: Overview on factors of disruption
- Exhibits118: Impact of key risks on business
- Exhibits119: Companies covered
- Exhibits120: Matrix on companies position and classification
- Exhibits121: ABShot Tecnics SL - Overview
- Exhibits122: ABShot Tecnics SL - Product / Service
- Exhibits123: ABShot Tecnics SL - Key offerings
- Exhibits124: AGTOS GmbH - Overview
- Exhibits125: AGTOS GmbH - Product / Service
- Exhibits126: AGTOS GmbH - Key news
- Exhibits127: AGTOS GmbH - Key offerings
- Exhibits128: Airblast BV - Overview
- Exhibits129: Airblast BV - Product / Service
- Exhibits130: Airblast BV - Key offerings
- Exhibits131: Axxiom Manufacturing Inc. - Overview
- Exhibits132: Axxiom Manufacturing Inc. - Product / Service
- Exhibits133: Axxiom Manufacturing Inc. - Key offerings
- Exhibits134: BLASTCORE LLC - Overview
- Exhibits135: BLASTCORE LLC - Product / Service
- Exhibits136: BLASTCORE LLC - Key offerings
- Exhibits137: Burwell Technologies - Overview
- Exhibits138: Burwell Technologies - Product / Service
- Exhibits139: Burwell Technologies - Key offerings
- Exhibits140: Clemco Industries Corp. - Overview
- Exhibits141: Clemco Industries Corp. - Product / Service
- Exhibits142: Clemco Industries Corp. - Key offerings
- Exhibits143: Empire Abrasive Equipment - Overview
- Exhibits144: Empire Abrasive Equipment - Product / Service
- Exhibits145: Empire Abrasive Equipment - Key offerings
- Exhibits146: Graco Inc. - Overview
- Exhibits147: Graco Inc. - Product / Service
- Exhibits148: Graco Inc. - Key news
- Exhibits149: Graco Inc. - Key offerings
- Exhibits150: Guyson Corp. - Overview
- Exhibits151: Guyson Corp. - Product / Service
- Exhibits152: Guyson Corp. - Key news
- Exhibits153: Guyson Corp. - Key offerings
- Exhibits154: Kramer Industries Inc. - Overview
- Exhibits155: Kramer Industries Inc. - Product / Service
- Exhibits156: Kramer Industries Inc. - Key offerings
- Exhibits157: ProBlast Inc. - Overview
- Exhibits158: ProBlast Inc. - Product / Service
- Exhibits159: ProBlast Inc. - Key offerings
- Exhibits160: Sintokogio Ltd. - Overview
- Exhibits161: Sintokogio Ltd. - Product / Service
- Exhibits162: Sintokogio Ltd. - Key offerings
- Exhibits163: torbo ENGINEERING KEIZERS GmbH - Overview
- Exhibits164: torbo ENGINEERING KEIZERS GmbH - Product / Service
- Exhibits165: torbo ENGINEERING KEIZERS GmbH - Key offerings
- Exhibits166: Viking Corp. - Overview
- Exhibits167: Viking Corp. - Product / Service
- Exhibits168: Viking Corp. - Key news
- Exhibits169: Viking Corp. - Key offerings
- Exhibits170: Inclusions checklist
- Exhibits171: Exclusions checklist
- Exhibits172: Currency conversion rates for US$
- Exhibits173: Research methodology
- Exhibits174: Information sources
- Exhibits175: Data validation
- Exhibits176: Validation techniques employed for market sizing
- Exhibits177: Data synthesis
- Exhibits178: 360 degree market analysis
- Exhibits179: List of abbreviations
The abrasive blasting equipment market is forecasted to grow by USD 148.3 mn during 2023-2028, accelerating at a CAGR of 5.36% during the forecast period. The report on the abrasive blasting equipment market provides a holistic analysis, market size and forecast, trends, growth drivers, and challenges, as well as vendor analysis covering around 25 vendors.
The report offers an up-to-date analysis regarding the current market scenario, the latest trends and drivers, and the overall market environment. The market is driven by rapid growth in aerospace healthcare and furnishing industries, growing demand from automotive industry, and growing construction activities in emerging countries and US.
Technavio's abrasive blasting equipment market is segmented as below:
| Market Scope | |
|---|---|
| Base Year | 2024 |
| End Year | 2028 |
| Series Year | 2024-2028 |
| Growth Momentum | Accelerate |
| YOY 2024 | 4.99% |
| CAGR | 5.36% |
| Incremental Value | $148.3mn |
By End-user
- Manufacturing
- Construction and maintenance
- Others
By Type
- Semi automatic
- Automatic
- Manual
By Geographical Landscape
- APAC
- North America
- Europe
- South America
- Middle East and Africa
This study identifies the leveraging e-commerce to increase market penetration as one of the prime reasons driving the abrasive blasting equipment market growth during the next few years. Also, technological advances in abrasive blasting and declining use of silica sand as abrasive medium will lead to sizable demand in the market.
The report on the abrasive blasting equipment market covers the following areas:
- Abrasive blasting equipment market sizing
- Abrasive blasting equipment market forecast
- Abrasive blasting equipment market industry analysis
The robust vendor analysis is designed to help clients improve their market position, and in line with this, this report provides a detailed analysis of several leading abrasive blasting equipment market vendors that include ABShot Tecnics SL, AGTOS GmbH, Airblast BV, Axxiom Manufacturing Inc., BLASTCORE LLC, Burwell Technologies, Clemco Industries Corp., Empire Abrasive Equipment, Graco Inc., Guyson Corp., Kramer Industries Inc., ProBlast Inc., Raptor Blasting Systems LLC, Sintokogio Ltd., Surface Finishing Equipment Co., Tip Plus Corp., torbo ENGINEERING KEIZERS GmbH, Trinco Trinity Tool Co., Viking Corp., and Vixen Surface Treatments Ltd.. Also, the abrasive blasting equipment market analysis report includes information on upcoming trends and challenges that will influence market growth. This is to help companies strategize and leverage all forthcoming growth opportunities.
The study was conducted using an objective combination of primary and secondary information including inputs from key participants in the industry. The report contains a comprehensive market and vendor landscape in addition to an analysis of the key vendors.
The publisher presents a detailed picture of the market by the way of study, synthesis, and summation of data from multiple sources by an analysis of key parameters such as profit, pricing, competition, and promotions. It presents various market facets by identifying the key industry influencers. The data presented is comprehensive, reliable, and a result of extensive research - both primary and secondary. The market research reports provide a complete competitive landscape and an in-depth vendor selection methodology and analysis using qualitative and quantitative research to forecast the accurate market growth.
Table of Contents
1 Executive Summary
- 1.1 Market overview
- Executive Summary - Chart on Market Overview
- Executive Summary - Data Table on Market Overview
- Executive Summary - Chart on Global Market Characteristics
- Executive Summary - Chart on Market By Geographical Landscape
- Executive Summary - Chart on Market Segmentation by End-user
- Executive Summary - Chart on Market Segmentation by Type
- Executive Summary - Chart on Incremental Growth
- Executive Summary - Data Table on Incremental Growth
- Executive Summary - Chart on Company Market Positioning
2 Market Landscape
- 2.1 Market ecosystem
- Parent Market
- Data Table on - Parent Market
- 2.2 Market characteristics
- Market characteristics analysis
- 2.3 Value chain analysis
- Value Chain Analysis
3 Market Sizing
- 3.1 Market definition
- Offerings of companies included in the market definition
- 3.2 Market segment analysis
- Market segments
- 3.3 Market size 2023
- 3.4 Market outlook: Forecast for 2023-2028
- Chart on Global - Market size and forecast 2023-2028 ($ million)
- Data Table on Global - Market size and forecast 2023-2028 ($ million)
- Chart on Global Market: Year-over-year growth 2023-2028 (%)
- Data Table on Global Market: Year-over-year growth 2023-2028 (%)
4 Historic Market Size
- 4.1 Global Abrasive Blasting Equipment Market 2018 - 2022
- Historic Market Size - Data Table on Global Abrasive Blasting Equipment Market 2018 - 2022 ($ million)
- 4.2 End-user segment analysis 2018 - 2022
- Historic Market Size - End-user Segment 2018 - 2022 ($ million)
- 4.3 Type segment analysis 2018 - 2022
- Historic Market Size - Type Segment 2018 - 2022 ($ million)
- 4.4 Geography segment analysis 2018 - 2022
- Historic Market Size - Geography Segment 2018 - 2022 ($ million)
- 4.5 Country segment analysis 2018 - 2022
- Historic Market Size - Country Segment 2018 - 2022 ($ million)
5 Five Forces Analysis
- 5.1 Five forces summary
- Five forces analysis - Comparison between 2023 and 2028
- 5.2 Bargaining power of buyers
- Bargaining power of buyers - Impact of key factors 2023 and 2028
- 5.3 Bargaining power of suppliers
- Bargaining power of suppliers - Impact of key factors in 2023 and 2028
- 5.4 Threat of new entrants
- Threat of new entrants - Impact of key factors in 2023 and 2028
- 5.5 Threat of substitutes
- Threat of substitutes - Impact of key factors in 2023 and 2028
- 5.6 Threat of rivalry
- Threat of rivalry - Impact of key factors in 2023 and 2028
- 5.7 Market condition
- Chart on Market condition - Five forces 2023 and 2028
6 Market Segmentation by End-user
- 6.1 Market segments
- Chart on End-user - Market share 2023-2028 (%)
- Data Table on End-user - Market share 2023-2028 (%)
- 6.2 Comparison by End-user
- Chart on Comparison by End-user
- Data Table on Comparison by End-user
- 6.3 Manufacturing - Market size and forecast 2023-2028
- Chart on Manufacturing - Market size and forecast 2023-2028 ($ million)
- Data Table on Manufacturing - Market size and forecast 2023-2028 ($ million)
- Chart on Manufacturing - Year-over-year growth 2023-2028 (%)
- Data Table on Manufacturing - Year-over-year growth 2023-2028 (%)
- 6.4 Construction and maintenance - Market size and forecast 2023-2028
- Chart on Construction and maintenance - Market size and forecast 2023-2028 ($ million)
- Data Table on Construction and maintenance - Market size and forecast 2023-2028 ($ million)
- Chart on Construction and maintenance - Year-over-year growth 2023-2028 (%)
- Data Table on Construction and maintenance - Year-over-year growth 2023-2028 (%)
- 6.5 Others - Market size and forecast 2023-2028
- Chart on Others - Market size and forecast 2023-2028 ($ million)
- Data Table on Others - Market size and forecast 2023-2028 ($ million)
- Chart on Others - Year-over-year growth 2023-2028 (%)
- Data Table on Others - Year-over-year growth 2023-2028 (%)
- 6.6 Market opportunity by End-user
- Market opportunity by End-user ($ million)
- Data Table on Market opportunity by End-user ($ million)
7 Market Segmentation by Type
- 7.1 Market segments
- Chart on Type - Market share 2023-2028 (%)
- Data Table on Type - Market share 2023-2028 (%)
- 7.2 Comparison by Type
- Chart on Comparison by Type
- Data Table on Comparison by Type
- 7.3 Semi automatic - Market size and forecast 2023-2028
- Chart on Semi automatic - Market size and forecast 2023-2028 ($ million)
- Data Table on Semi automatic - Market size and forecast 2023-2028 ($ million)
- Chart on Semi automatic - Year-over-year growth 2023-2028 (%)
- Data Table on Semi automatic - Year-over-year growth 2023-2028 (%)
- 7.4 Automatic - Market size and forecast 2023-2028
- Chart on Automatic - Market size and forecast 2023-2028 ($ million)
- Data Table on Automatic - Market size and forecast 2023-2028 ($ million)
- Chart on Automatic - Year-over-year growth 2023-2028 (%)
- Data Table on Automatic - Year-over-year growth 2023-2028 (%)
- 7.5 Manual - Market size and forecast 2023-2028
- Chart on Manual - Market size and forecast 2023-2028 ($ million)
- Data Table on Manual - Market size and forecast 2023-2028 ($ million)
- Chart on Manual - Year-over-year growth 2023-2028 (%)
- Data Table on Manual - Year-over-year growth 2023-2028 (%)
- 7.6 Market opportunity by Type
- Market opportunity by Type ($ million)
- Data Table on Market opportunity by Type ($ million)
8 Customer Landscape
- 8.1 Customer landscape overview
- Analysis of price sensitivity, lifecycle, customer purchase basket, adoption rates, and purchase criteria
9 Geographic Landscape
- 9.1 Geographic segmentation
- Chart on Market share By Geographical Landscape 2023-2028 (%)
- Data Table on Market share By Geographical Landscape 2023-2028 (%)
- 9.2 Geographic comparison
- Chart on Geographic comparison
- Data Table on Geographic comparison
- 9.3 APAC - Market size and forecast 2023-2028
- Chart on APAC - Market size and forecast 2023-2028 ($ million)
- Data Table on APAC - Market size and forecast 2023-2028 ($ million)
- Chart on APAC - Year-over-year growth 2023-2028 (%)
- Data Table on APAC - Year-over-year growth 2023-2028 (%)
- 9.4 North America - Market size and forecast 2023-2028
- Chart on North America - Market size and forecast 2023-2028 ($ million)
- Data Table on North America - Market size and forecast 2023-2028 ($ million)
- Chart on North America - Year-over-year growth 2023-2028 (%)
- Data Table on North America - Year-over-year growth 2023-2028 (%)
- 9.5 Europe - Market size and forecast 2023-2028
- Chart on Europe - Market size and forecast 2023-2028 ($ million)
- Data Table on Europe - Market size and forecast 2023-2028 ($ million)
- Chart on Europe - Year-over-year growth 2023-2028 (%)
- Data Table on Europe - Year-over-year growth 2023-2028 (%)
- 9.6 South America - Market size and forecast 2023-2028
- Chart on South America - Market size and forecast 2023-2028 ($ million)
- Data Table on South America - Market size and forecast 2023-2028 ($ million)
- Chart on South America - Year-over-year growth 2023-2028 (%)
- Data Table on South America - Year-over-year growth 2023-2028 (%)
- 9.7 Middle East and Africa - Market size and forecast 2023-2028
- Chart on Middle East and Africa - Market size and forecast 2023-2028 ($ million)
- Data Table on Middle East and Africa - Market size and forecast 2023-2028 ($ million)
- Chart on Middle East and Africa - Year-over-year growth 2023-2028 (%)
- Data Table on Middle East and Africa - Year-over-year growth 2023-2028 (%)
- 9.8 China - Market size and forecast 2023-2028
- Chart on China - Market size and forecast 2023-2028 ($ million)
- Data Table on China - Market size and forecast 2023-2028 ($ million)
- Chart on China - Year-over-year growth 2023-2028 (%)
- Data Table on China - Year-over-year growth 2023-2028 (%)
- 9.9 US - Market size and forecast 2023-2028
- Chart on US - Market size and forecast 2023-2028 ($ million)
- Data Table on US - Market size and forecast 2023-2028 ($ million)
- Chart on US - Year-over-year growth 2023-2028 (%)
- Data Table on US - Year-over-year growth 2023-2028 (%)
- 9.10 Germany - Market size and forecast 2023-2028
- Chart on Germany - Market size and forecast 2023-2028 ($ million)
- Data Table on Germany - Market size and forecast 2023-2028 ($ million)
- Chart on Germany - Year-over-year growth 2023-2028 (%)
- Data Table on Germany - Year-over-year growth 2023-2028 (%)
- 9.11 UK - Market size and forecast 2023-2028
- Chart on UK - Market size and forecast 2023-2028 ($ million)
- Data Table on UK - Market size and forecast 2023-2028 ($ million)
- Chart on UK - Year-over-year growth 2023-2028 (%)
- Data Table on UK - Year-over-year growth 2023-2028 (%)
- 9.12 Japan - Market size and forecast 2023-2028
- Chart on Japan - Market size and forecast 2023-2028 ($ million)
- Data Table on Japan - Market size and forecast 2023-2028 ($ million)
- Chart on Japan - Year-over-year growth 2023-2028 (%)
- Data Table on Japan - Year-over-year growth 2023-2028 (%)
- 9.13 Market opportunity By Geographical Landscape
- Market opportunity By Geographical Landscape ($ million)
- Data Tables on Market opportunity By Geographical Landscape ($ million)
10 Drivers, Challenges, and Opportunity/Restraints
- 10.1 Market drivers
- 10.2 Market challenges
- 10.3 Impact of drivers and challenges
- Impact of drivers and challenges in 2023 and 2028
- 10.4 Market opportunities/restraints
11 Competitive Landscape
- 11.1 Overview
- 11.2 Competitive Landscape
- Overview on criticality of inputs and factors of differentiation
- 11.3 Landscape disruption
- Overview on factors of disruption
- 11.4 Industry risks
- Impact of key risks on business
12 Competitive Analysis
- 12.1 Companies profiled
- Companies covered
- 12.2 Market positioning of companies
- Matrix on companies position and classification
- 12.3 ABShot Tecnics SL
- ABShot Tecnics SL - Overview
- ABShot Tecnics SL - Product / Service
- ABShot Tecnics SL - Key offerings
- 12.4 AGTOS GmbH
- AGTOS GmbH - Overview
- AGTOS GmbH - Product / Service
- AGTOS GmbH - Key news
- AGTOS GmbH - Key offerings
- 12.5 Airblast BV
- Airblast BV - Overview
- Airblast BV - Product / Service
- Airblast BV - Key offerings
- 12.6 Axxiom Manufacturing Inc.
- Axxiom Manufacturing Inc. - Overview
- Axxiom Manufacturing Inc. - Product / Service
- Axxiom Manufacturing Inc. - Key offerings
- 12.7 BLASTCORE LLC
- BLASTCORE LLC - Overview
- BLASTCORE LLC - Product / Service
- BLASTCORE LLC - Key offerings
- 12.8 Burwell Technologies
- Burwell Technologies - Overview
- Burwell Technologies - Product / Service
- Burwell Technologies - Key offerings
- 12.9 Clemco Industries Corp.
- Clemco Industries Corp. - Overview
- Clemco Industries Corp. - Product / Service
- Clemco Industries Corp. - Key offerings
- 12.10 Empire Abrasive Equipment
- Empire Abrasive Equipment - Overview
- Empire Abrasive Equipment - Product / Service
- Empire Abrasive Equipment - Key offerings
- 12.11 Graco Inc.
- Graco Inc. - Overview
- Graco Inc. - Product / Service
- Graco Inc. - Key news
- Graco Inc. - Key offerings
- 12.12 Guyson Corp.
- Guyson Corp. - Overview
- Guyson Corp. - Product / Service
- Guyson Corp. - Key news
- Guyson Corp. - Key offerings
- 12.13 Kramer Industries Inc.
- Kramer Industries Inc. - Overview
- Kramer Industries Inc. - Product / Service
- Kramer Industries Inc. - Key offerings
- 12.14 ProBlast Inc.
- ProBlast Inc. - Overview
- ProBlast Inc. - Product / Service
- ProBlast Inc. - Key offerings
- 12.15 Sintokogio Ltd.
- Sintokogio Ltd. - Overview
- Sintokogio Ltd. - Product / Service
- Sintokogio Ltd. - Key offerings
- 12.16 torbo ENGINEERING KEIZERS GmbH
- torbo ENGINEERING KEIZERS GmbH - Overview
- torbo ENGINEERING KEIZERS GmbH - Product / Service
- torbo ENGINEERING KEIZERS GmbH - Key offerings
- 12.17 Viking Corp.
- Viking Corp. - Overview
- Viking Corp. - Product / Service
- Viking Corp. - Key news
- Viking Corp. - Key offerings
13 Appendix
- 13.1 Scope of the report
- 13.2 Inclusions and exclusions checklist
- Inclusions checklist
- Exclusions checklist
- 13.3 Currency conversion rates for US$
- Currency conversion rates for US$
- 13.4 Research methodology
- Research methodology
- 13.5 Data procurement
- Information sources
- 13.6 Data validation
- Data validation
- 13.7 Validation techniques employed for market sizing
- Validation techniques employed for market sizing
- 13.8 Data synthesis
- Data synthesis
- 360 degree market analysis
- 360 degree market analysis
- 13.10 List of abbreviations
- List of abbreviations

