|
|
市場調査レポート
商品コード
1517006
3D光学顕微鏡の世界市場 2024-2028Global 3D optical microscope market 2024-2028 |
||||||
|
|||||||
カスタマイズ可能
|
|||||||

| 3D光学顕微鏡の世界市場 2024-2028 |
|
出版日: 2024年06月12日
発行: TechNavio
ページ情報: 英文 171 Pages
納期: 即納可能
|

全表示
- 概要
- 図表
- 目次
3D光学顕微鏡市場は2023-2028年に1億3,060万米ドル、予測期間中のCAGRは8.64%で成長すると予測されます。
当レポートでは、3D光学顕微鏡市場の全体的な分析、市場規模・予測、動向、成長促進要因、課題、約25のベンダーを網羅したベンダー分析などを掲載しています。
現在の市場シナリオ、最新動向と促進要因、市場環境全体に関する最新分析を提供しています。市場は、様々な産業における3D光学顕微鏡の用途拡大、R&Dへの資金提供の増加、様々な産業における根本原因解析の用途拡大が牽引しています。
| 市場範囲 | |
|---|---|
| 基準年 | 2024 |
| 終了年 | 2028 |
| 予測期間 | 2024-2028 |
| 成長モメンタム | 加速 |
| 前年比2024年 | 7.67% |
| CAGR | 8.64% |
| 増分額 | 1億3,060万米ドル |
本調査では、今後数年間の3D光学顕微鏡市場成長を牽引する主要因の1つとして、航空宇宙と自動車分野の成長を挙げています。また、3D光学顕微鏡の革新的技術の統合や学術機関との共同研究の増加が市場の大きな需要につながります。
目次
第1章 エグゼクティブサマリー
- 市場概要
第2章 市場情勢
- 市場エコシステム
- 市場の特徴
- バリューチェーン分析
第3章 市場規模の評価
- 市場の定義
- 市場セグメント分析
- 市場規模 2023
- 市場の見通し 2023-2028
第4章 市場規模実績
- 世界3D光学顕微鏡市場 2018-2022
- エンドユーザー別セグメント分析 2018-2022
- タイプ別セグメント分析 2018-2022
- 地域別セグメント分析 2018-2022
- 国別セグメント分析 2018-2022
第5章 ファイブフォース分析
- ファイブフォースの要約
- 買い手の交渉力
- 供給企業の交渉力
- 新規参入業者の脅威
- 代替品の脅威
- 競争の脅威
- 市況
第6章 市場セグメンテーション:エンドユーザー別
- 市場セグメンテーション
- 比較:エンドユーザー別
- 航空宇宙および自動車:市場規模と予測 2023-2028
- ヘルスケア:市場規模と予測 2023-2028
- その他:市場規模と予測 2023-2028
- 市場機会:エンドユーザー別
第7章 市場セグメンテーション:タイプ別
- 市場セグメンテーション
- 比較:タイプ別
- 白色干渉顕微鏡:市場規模と予測 2023-2028
- 共焦点レーザー顕微鏡:市場規模と予測 2023-2028
- 市場機会:タイプ別
第8章 顧客情勢
- 顧客情勢の概要
第9章 地域別情勢
- 地域別セグメンテーション
- 地域別比較
- 北米:市場規模と予測 2023-2028
- 欧州:市場規模と予測 2023-2028
- アジア:市場規模と予測 2023-2028
- 世界のその他の地域:市場規模と予測 2023-2028
- 米国:市場規模と予測 2023-2028
- 英国:市場規模と予測 2023-2028
- ドイツ:市場規模と予測 2023-2028
- カナダ:市場規模と予測 2023-2028
- 中国:市場規模と予測 2023-2028
- 市場機会:地域情勢別
第10章 促進要因・課題・機会・抑制要因
- 市場促進要因
- 市場の課題
- 促進要因と課題の影響
- 市場の機会・抑制要因
第11章 競合情勢
- 概要
- 競合情勢
- 混乱の状況
- 業界のリスク
第12章 競合分析
- 企業プロファイル
- 企業の市場ポジショニング
- ACCU SCOPE Inc.
- Agilent Technologies Inc.
- AMETEK Inc.
- AmScope
- Bruker Corp.
- Carl Zeiss AG
- Danaher Corp.
- Hirox Co. Ltd.
- Hitachi Ltd.
- Keyence Corp.
- KLA Corp.
- Labomed Inc.
- Nikon Corp.
- Olympus Corp.
- PCE Holding GmbH
第13章 付録
Exhibits:
- Exhibits1: Executive Summary - Chart on Market Overview
- Exhibits2: Executive Summary - Data Table on Market Overview
- Exhibits3: Executive Summary - Chart on Global Market Characteristics
- Exhibits4: Executive Summary - Chart on Market By Geographical Landscape
- Exhibits5: Executive Summary - Chart on Market Segmentation by End-user
- Exhibits6: Executive Summary - Chart on Market Segmentation by Type
- Exhibits7: Executive Summary - Chart on Incremental Growth
- Exhibits8: Executive Summary - Data Table on Incremental Growth
- Exhibits9: Executive Summary - Chart on Company Market Positioning
- Exhibits10: Parent Market
- Exhibits11: Data Table on - Parent Market
- Exhibits12: Market characteristics analysis
- Exhibits13: Value Chain Analysis
- Exhibits14: Offerings of companies included in the market definition
- Exhibits15: Market segments
- Exhibits16: Chart on Global - Market size and forecast 2023-2028 ($ million)
- Exhibits17: Data Table on Global - Market size and forecast 2023-2028 ($ million)
- Exhibits18: Chart on Global Market: Year-over-year growth 2023-2028 (%)
- Exhibits19: Data Table on Global Market: Year-over-year growth 2023-2028 (%)
- Exhibits20: Historic Market Size - Data Table on Global 3D Optical Microscope Market 2018 - 2022 ($ million)
- Exhibits21: Historic Market Size - End-user Segment 2018 - 2022 ($ million)
- Exhibits22: Historic Market Size - Type Segment 2018 - 2022 ($ million)
- Exhibits23: Historic Market Size - Geography Segment 2018 - 2022 ($ million)
- Exhibits24: Historic Market Size - Country Segment 2018 - 2022 ($ million)
- Exhibits25: Five forces analysis - Comparison between 2023 and 2028
- Exhibits26: Bargaining power of buyers - Impact of key factors 2023 and 2028
- Exhibits27: Bargaining power of suppliers - Impact of key factors in 2023 and 2028
- Exhibits28: Threat of new entrants - Impact of key factors in 2023 and 2028
- Exhibits29: Threat of substitutes - Impact of key factors in 2023 and 2028
- Exhibits30: Threat of rivalry - Impact of key factors in 2023 and 2028
- Exhibits31: Chart on Market condition - Five forces 2023 and 2028
- Exhibits32: Chart on End-user - Market share 2023-2028 (%)
- Exhibits33: Data Table on End-user - Market share 2023-2028 (%)
- Exhibits34: Chart on Comparison by End-user
- Exhibits35: Data Table on Comparison by End-user
- Exhibits36: Chart on Aerospace and automotive - Market size and forecast 2023-2028 ($ million)
- Exhibits37: Data Table on Aerospace and automotive - Market size and forecast 2023-2028 ($ million)
- Exhibits38: Chart on Aerospace and automotive - Year-over-year growth 2023-2028 (%)
- Exhibits39: Data Table on Aerospace and automotive - Year-over-year growth 2023-2028 (%)
- Exhibits40: Chart on Healthcare - Market size and forecast 2023-2028 ($ million)
- Exhibits41: Data Table on Healthcare - Market size and forecast 2023-2028 ($ million)
- Exhibits42: Chart on Healthcare - Year-over-year growth 2023-2028 (%)
- Exhibits43: Data Table on Healthcare - Year-over-year growth 2023-2028 (%)
- Exhibits44: Chart on Others - Market size and forecast 2023-2028 ($ million)
- Exhibits45: Data Table on Others - Market size and forecast 2023-2028 ($ million)
- Exhibits46: Chart on Others - Year-over-year growth 2023-2028 (%)
- Exhibits47: Data Table on Others - Year-over-year growth 2023-2028 (%)
- Exhibits48: Market opportunity by End-user ($ million)
- Exhibits49: Data Table on Market opportunity by End-user ($ million)
- Exhibits50: Chart on Type - Market share 2023-2028 (%)
- Exhibits51: Data Table on Type - Market share 2023-2028 (%)
- Exhibits52: Chart on Comparison by Type
- Exhibits53: Data Table on Comparison by Type
- Exhibits54: Chart on White light interferometry - Market size and forecast 2023-2028 ($ million)
- Exhibits55: Data Table on White light interferometry - Market size and forecast 2023-2028 ($ million)
- Exhibits56: Chart on White light interferometry - Year-over-year growth 2023-2028 (%)
- Exhibits57: Data Table on White light interferometry - Year-over-year growth 2023-2028 (%)
- Exhibits58: Chart on Laser scanning confocal microscopy - Market size and forecast 2023-2028 ($ million)
- Exhibits59: Data Table on Laser scanning confocal microscopy - Market size and forecast 2023-2028 ($ million)
- Exhibits60: Chart on Laser scanning confocal microscopy - Year-over-year growth 2023-2028 (%)
- Exhibits61: Data Table on Laser scanning confocal microscopy - Year-over-year growth 2023-2028 (%)
- Exhibits62: Market opportunity by Type ($ million)
- Exhibits63: Data Table on Market opportunity by Type ($ million)
- Exhibits64: Analysis of price sensitivity, lifecycle, customer purchase basket, adoption rates, and purchase criteria
- Exhibits65: Chart on Market share By Geographical Landscape 2023-2028 (%)
- Exhibits66: Data Table on Market share By Geographical Landscape 2023-2028 (%)
- Exhibits67: Chart on Geographic comparison
- Exhibits68: Data Table on Geographic comparison
- Exhibits69: Chart on North America - Market size and forecast 2023-2028 ($ million)
- Exhibits70: Data Table on North America - Market size and forecast 2023-2028 ($ million)
- Exhibits71: Chart on North America - Year-over-year growth 2023-2028 (%)
- Exhibits72: Data Table on North America - Year-over-year growth 2023-2028 (%)
- Exhibits73: Chart on Europe - Market size and forecast 2023-2028 ($ million)
- Exhibits74: Data Table on Europe - Market size and forecast 2023-2028 ($ million)
- Exhibits75: Chart on Europe - Year-over-year growth 2023-2028 (%)
- Exhibits76: Data Table on Europe - Year-over-year growth 2023-2028 (%)
- Exhibits77: Chart on Asia - Market size and forecast 2023-2028 ($ million)
- Exhibits78: Data Table on Asia - Market size and forecast 2023-2028 ($ million)
- Exhibits79: Chart on Asia - Year-over-year growth 2023-2028 (%)
- Exhibits80: Data Table on Asia - Year-over-year growth 2023-2028 (%)
- Exhibits81: Chart on Rest of World (ROW) - Market size and forecast 2023-2028 ($ million)
- Exhibits82: Data Table on Rest of World (ROW) - Market size and forecast 2023-2028 ($ million)
- Exhibits83: Chart on Rest of World (ROW) - Year-over-year growth 2023-2028 (%)
- Exhibits84: Data Table on Rest of World (ROW) - Year-over-year growth 2023-2028 (%)
- Exhibits85: Chart on US - Market size and forecast 2023-2028 ($ million)
- Exhibits86: Data Table on US - Market size and forecast 2023-2028 ($ million)
- Exhibits87: Chart on US - Year-over-year growth 2023-2028 (%)
- Exhibits88: Data Table on US - Year-over-year growth 2023-2028 (%)
- Exhibits89: Chart on UK - Market size and forecast 2023-2028 ($ million)
- Exhibits90: Data Table on UK - Market size and forecast 2023-2028 ($ million)
- Exhibits91: Chart on UK - Year-over-year growth 2023-2028 (%)
- Exhibits92: Data Table on UK - Year-over-year growth 2023-2028 (%)
- Exhibits93: Chart on Germany - Market size and forecast 2023-2028 ($ million)
- Exhibits94: Data Table on Germany - Market size and forecast 2023-2028 ($ million)
- Exhibits95: Chart on Germany - Year-over-year growth 2023-2028 (%)
- Exhibits96: Data Table on Germany - Year-over-year growth 2023-2028 (%)
- Exhibits97: Chart on Canada - Market size and forecast 2023-2028 ($ million)
- Exhibits98: Data Table on Canada - Market size and forecast 2023-2028 ($ million)
- Exhibits99: Chart on Canada - Year-over-year growth 2023-2028 (%)
- Exhibits100: Data Table on Canada - Year-over-year growth 2023-2028 (%)
- Exhibits101: Chart on China - Market size and forecast 2023-2028 ($ million)
- Exhibits102: Data Table on China - Market size and forecast 2023-2028 ($ million)
- Exhibits103: Chart on China - Year-over-year growth 2023-2028 (%)
- Exhibits104: Data Table on China - Year-over-year growth 2023-2028 (%)
- Exhibits105: Market opportunity By Geographical Landscape ($ million)
- Exhibits106: Data Tables on Market opportunity By Geographical Landscape ($ million)
- Exhibits107: Impact of drivers and challenges in 2023 and 2028
- Exhibits108: Overview on criticality of inputs and factors of differentiation
- Exhibits109: Overview on factors of disruption
- Exhibits110: Impact of key risks on business
- Exhibits111: Companies covered
- Exhibits112: Matrix on companies position and classification
- Exhibits113: ACCU SCOPE Inc. - Overview
- Exhibits114: ACCU SCOPE Inc. - Product / Service
- Exhibits115: ACCU SCOPE Inc. - Key offerings
- Exhibits116: Agilent Technologies Inc. - Overview
- Exhibits117: Agilent Technologies Inc. - Business segments
- Exhibits118: Agilent Technologies Inc. - Key news
- Exhibits119: Agilent Technologies Inc. - Key offerings
- Exhibits120: Agilent Technologies Inc. - Segment focus
- Exhibits121: AMETEK Inc. - Overview
- Exhibits122: AMETEK Inc. - Business segments
- Exhibits123: AMETEK Inc. - Key news
- Exhibits124: AMETEK Inc. - Key offerings
- Exhibits125: AMETEK Inc. - Segment focus
- Exhibits126: AmScope - Overview
- Exhibits127: AmScope - Product / Service
- Exhibits128: AmScope - Key offerings
- Exhibits129: Bruker Corp. - Overview
- Exhibits130: Bruker Corp. - Business segments
- Exhibits131: Bruker Corp. - Key news
- Exhibits132: Bruker Corp. - Key offerings
- Exhibits133: Bruker Corp. - Segment focus
- Exhibits134: Carl Zeiss AG - Overview
- Exhibits135: Carl Zeiss AG - Product / Service
- Exhibits136: Carl Zeiss AG - Key news
- Exhibits137: Carl Zeiss AG - Key offerings
- Exhibits138: Danaher Corp. - Overview
- Exhibits139: Danaher Corp. - Business segments
- Exhibits140: Danaher Corp. - Key news
- Exhibits141: Danaher Corp. - Key offerings
- Exhibits142: Danaher Corp. - Segment focus
- Exhibits143: Hirox Co. Ltd. - Overview
- Exhibits144: Hirox Co. Ltd. - Product / Service
- Exhibits145: Hirox Co. Ltd. - Key offerings
- Exhibits146: Hitachi Ltd. - Overview
- Exhibits147: Hitachi Ltd. - Business segments
- Exhibits148: Hitachi Ltd. - Key news
- Exhibits149: Hitachi Ltd. - Key offerings
- Exhibits150: Hitachi Ltd. - Segment focus
- Exhibits151: Keyence Corp. - Overview
- Exhibits152: Keyence Corp. - Product / Service
- Exhibits153: Keyence Corp. - Key offerings
- Exhibits154: KLA Corp. - Overview
- Exhibits155: KLA Corp. - Business segments
- Exhibits156: KLA Corp. - Key offerings
- Exhibits157: KLA Corp. - Segment focus
- Exhibits158: Labomed Inc. - Overview
- Exhibits159: Labomed Inc. - Product / Service
- Exhibits160: Labomed Inc. - Key offerings
- Exhibits161: Nikon Corp. - Overview
- Exhibits162: Nikon Corp. - Business segments
- Exhibits163: Nikon Corp. - Key news
- Exhibits164: Nikon Corp. - Key offerings
- Exhibits165: Nikon Corp. - Segment focus
- Exhibits166: Olympus Corp. - Overview
- Exhibits167: Olympus Corp. - Business segments
- Exhibits168: Olympus Corp. - Key news
- Exhibits169: Olympus Corp. - Key offerings
- Exhibits170: Olympus Corp. - Segment focus
- Exhibits171: PCE Holding GmbH - Overview
- Exhibits172: PCE Holding GmbH - Product / Service
- Exhibits173: PCE Holding GmbH - Key offerings
- Exhibits174: Inclusions checklist
- Exhibits175: Exclusions checklist
- Exhibits176: Currency conversion rates for US$
- Exhibits177: Research methodology
- Exhibits178: Information sources
- Exhibits179: Data validation
- Exhibits180: Validation techniques employed for market sizing
- Exhibits181: Data synthesis
- Exhibits182: 360 degree market analysis
- Exhibits183: List of abbreviations
The 3D optical microscope market is forecasted to grow by USD 130.6 mn during 2023-2028, accelerating at a CAGR of 8.64% during the forecast period. The report on the 3d optical microscope market provides a holistic analysis, market size and forecast, trends, growth drivers, and challenges, as well as vendor analysis covering around 25 vendors.
The report offers an up-to-date analysis regarding the current market scenario, the latest trends and drivers, and the overall market environment. The market is driven by increased application of 3D optical microscopes in various industries, increasing funding for R and D, and growing use of root cause failure analysis in different industries.
Technavio's 3D optical microscope market is segmented as below:
| Market Scope | |
|---|---|
| Base Year | 2024 |
| End Year | 2028 |
| Series Year | 2024-2028 |
| Growth Momentum | Accelerate |
| YOY 2024 | 7.67% |
| CAGR | 8.64% |
| Incremental Value | $130.6mn |
By End-user
- Aerospace and automotive
- Healthcare
- Others
By Type
- White light interferometry
- Laser scanning confocal microscopy
By Geographical Landscape
- North America
- Europe
- Asia
- Rest of World (ROW)
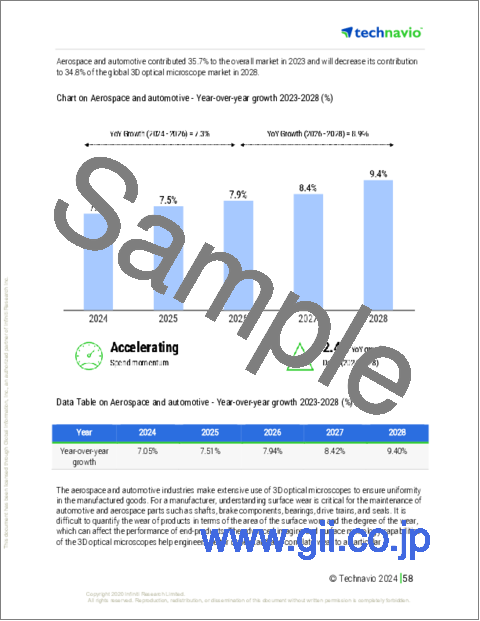
This study identifies the growing aerospace and automotive sectors as one of the prime reasons driving the 3D optical microscope market growth during the next few years. Also, integration of innovative technologies in 3D optical microscopes and growing number of collaborations with academic institutes will lead to sizable demand in the market.
The report on the 3D optical microscope market covers the following areas:
- 3D optical microscope market sizing
- 3D optical microscope market forecast
- 3D optical microscope market industry analysis
The robust vendor analysis is designed to help clients improve their market position, and in line with this, this report provides a detailed analysis of several leading 3D optical microscope market vendors that include ACCU SCOPE Inc., AEP Technology, Agilent Technologies Inc., Alicona Imaging GmbH, AMETEK Inc., AmScope, Bruker Corp., Carl Zeiss AG, Celestron Acquisition LLC, Danaher Corp., Hirox Co. Ltd., Hitachi Ltd., Keyence Corp., KLA Corp., Labomed Inc., Mahr GmbH, Nanovea, Nikon Corp., Olympus Corp., and PCE Holding GmbH. Also, the 3D optical microscope market analysis report includes information on upcoming trends and challenges that will influence market growth. This is to help companies strategize and leverage all forthcoming growth opportunities.
The study was conducted using an objective combination of primary and secondary information including inputs from key participants in the industry. The report contains a comprehensive market and vendor landscape in addition to an analysis of the key vendors.
The publisher presents a detailed picture of the market by the way of study, synthesis, and summation of data from multiple sources by an analysis of key parameters such as profit, pricing, competition, and promotions. IT presents various market facets by identifying the key industry influencers. The data presented is comprehensive, reliable, and a result of extensive research - both primary and secondary. The market research reports provide a complete competitive landscape and an in-depth vendor selection methodology and analysis using qualitative and quantitative research to forecast the accurate market growth.
Table of Contents
1 Executive Summary
- 1.1 Market overview
- Executive Summary - Chart on Market Overview
- Executive Summary - Data Table on Market Overview
- Executive Summary - Chart on Global Market Characteristics
- Executive Summary - Chart on Market By Geographical Landscape
- Executive Summary - Chart on Market Segmentation by End-user
- Executive Summary - Chart on Market Segmentation by Type
- Executive Summary - Chart on Incremental Growth
- Executive Summary - Data Table on Incremental Growth
- Executive Summary - Chart on Company Market Positioning
2 Market Landscape
- 2.1 Market ecosystem
- Parent Market
- Data Table on - Parent Market
- 2.2 Market characteristics
- Market characteristics analysis
- 2.3 Value chain analysis
- Value Chain Analysis
3 Market Sizing
- 3.1 Market definition
- Offerings of companies included in the market definition
- 3.2 Market segment analysis
- Market segments
- 3.3 Market size 2023
- 3.4 Market outlook: Forecast for 2023-2028
- Chart on Global - Market size and forecast 2023-2028 ($ million)
- Data Table on Global - Market size and forecast 2023-2028 ($ million)
- Chart on Global Market: Year-over-year growth 2023-2028 (%)
- Data Table on Global Market: Year-over-year growth 2023-2028 (%)
4 Historic Market Size
- 4.1 Global 3D Optical Microscope Market 2018 - 2022
- Historic Market Size - Data Table on Global 3D Optical Microscope Market 2018 - 2022 ($ million)
- 4.2 End-user segment analysis 2018 - 2022
- Historic Market Size - End-user Segment 2018 - 2022 ($ million)
- 4.3 Type segment analysis 2018 - 2022
- Historic Market Size - Type Segment 2018 - 2022 ($ million)
- 4.4 Geography segment analysis 2018 - 2022
- Historic Market Size - Geography Segment 2018 - 2022 ($ million)
- 4.5 Country segment analysis 2018 - 2022
- Historic Market Size - Country Segment 2018 - 2022 ($ million)
5 Five Forces Analysis
- 5.1 Five forces summary
- Five forces analysis - Comparison between 2023 and 2028
- 5.2 Bargaining power of buyers
- Bargaining power of buyers - Impact of key factors 2023 and 2028
- 5.3 Bargaining power of suppliers
- Bargaining power of suppliers - Impact of key factors in 2023 and 2028
- 5.4 Threat of new entrants
- Threat of new entrants - Impact of key factors in 2023 and 2028
- 5.5 Threat of substitutes
- Threat of substitutes - Impact of key factors in 2023 and 2028
- 5.6 Threat of rivalry
- Threat of rivalry - Impact of key factors in 2023 and 2028
- 5.7 Market condition
- Chart on Market condition - Five forces 2023 and 2028
6 Market Segmentation by End-user
- 6.1 Market segments
- Chart on End-user - Market share 2023-2028 (%)
- Data Table on End-user - Market share 2023-2028 (%)
- 6.2 Comparison by End-user
- Chart on Comparison by End-user
- Data Table on Comparison by End-user
- 6.3 Aerospace and automotive - Market size and forecast 2023-2028
- Chart on Aerospace and automotive - Market size and forecast 2023-2028 ($ million)
- Data Table on Aerospace and automotive - Market size and forecast 2023-2028 ($ million)
- Chart on Aerospace and automotive - Year-over-year growth 2023-2028 (%)
- Data Table on Aerospace and automotive - Year-over-year growth 2023-2028 (%)
- 6.4 Healthcare - Market size and forecast 2023-2028
- Chart on Healthcare - Market size and forecast 2023-2028 ($ million)
- Data Table on Healthcare - Market size and forecast 2023-2028 ($ million)
- Chart on Healthcare - Year-over-year growth 2023-2028 (%)
- Data Table on Healthcare - Year-over-year growth 2023-2028 (%)
- 6.5 Others - Market size and forecast 2023-2028
- Chart on Others - Market size and forecast 2023-2028 ($ million)
- Data Table on Others - Market size and forecast 2023-2028 ($ million)
- Chart on Others - Year-over-year growth 2023-2028 (%)
- Data Table on Others - Year-over-year growth 2023-2028 (%)
- 6.6 Market opportunity by End-user
- Market opportunity by End-user ($ million)
- Data Table on Market opportunity by End-user ($ million)
7 Market Segmentation by Type
- 7.1 Market segments
- Chart on Type - Market share 2023-2028 (%)
- Data Table on Type - Market share 2023-2028 (%)
- 7.2 Comparison by Type
- Chart on Comparison by Type
- Data Table on Comparison by Type
- 7.3 White light interferometry - Market size and forecast 2023-2028
- Chart on White light interferometry - Market size and forecast 2023-2028 ($ million)
- Data Table on White light interferometry - Market size and forecast 2023-2028 ($ million)
- Chart on White light interferometry - Year-over-year growth 2023-2028 (%)
- Data Table on White light interferometry - Year-over-year growth 2023-2028 (%)
- 7.4 Laser scanning confocal microscopy - Market size and forecast 2023-2028
- Chart on Laser scanning confocal microscopy - Market size and forecast 2023-2028 ($ million)
- Data Table on Laser scanning confocal microscopy - Market size and forecast 2023-2028 ($ million)
- Chart on Laser scanning confocal microscopy - Year-over-year growth 2023-2028 (%)
- Data Table on Laser scanning confocal microscopy - Year-over-year growth 2023-2028 (%)
- 7.5 Market opportunity by Type
- Market opportunity by Type ($ million)
- Data Table on Market opportunity by Type ($ million)
8 Customer Landscape
- 8.1 Customer landscape overview
- Analysis of price sensitivity, lifecycle, customer purchase basket, adoption rates, and purchase criteria
9 Geographic Landscape
- 9.1 Geographic segmentation
- Chart on Market share By Geographical Landscape 2023-2028 (%)
- Data Table on Market share By Geographical Landscape 2023-2028 (%)
- 9.2 Geographic comparison
- Chart on Geographic comparison
- Data Table on Geographic comparison
- 9.3 North America - Market size and forecast 2023-2028
- Chart on North America - Market size and forecast 2023-2028 ($ million)
- Data Table on North America - Market size and forecast 2023-2028 ($ million)
- Chart on North America - Year-over-year growth 2023-2028 (%)
- Data Table on North America - Year-over-year growth 2023-2028 (%)
- 9.4 Europe - Market size and forecast 2023-2028
- Chart on Europe - Market size and forecast 2023-2028 ($ million)
- Data Table on Europe - Market size and forecast 2023-2028 ($ million)
- Chart on Europe - Year-over-year growth 2023-2028 (%)
- Data Table on Europe - Year-over-year growth 2023-2028 (%)
- 9.5 Asia - Market size and forecast 2023-2028
- Chart on Asia - Market size and forecast 2023-2028 ($ million)
- Data Table on Asia - Market size and forecast 2023-2028 ($ million)
- Chart on Asia - Year-over-year growth 2023-2028 (%)
- Data Table on Asia - Year-over-year growth 2023-2028 (%)
- 9.6 Rest of World (ROW) - Market size and forecast 2023-2028
- Chart on Rest of World (ROW) - Market size and forecast 2023-2028 ($ million)
- Data Table on Rest of World (ROW) - Market size and forecast 2023-2028 ($ million)
- Chart on Rest of World (ROW) - Year-over-year growth 2023-2028 (%)
- Data Table on Rest of World (ROW) - Year-over-year growth 2023-2028 (%)
- 9.7 US - Market size and forecast 2023-2028
- Chart on US - Market size and forecast 2023-2028 ($ million)
- Data Table on US - Market size and forecast 2023-2028 ($ million)
- Chart on US - Year-over-year growth 2023-2028 (%)
- Data Table on US - Year-over-year growth 2023-2028 (%)
- 9.8 UK - Market size and forecast 2023-2028
- Chart on UK - Market size and forecast 2023-2028 ($ million)
- Data Table on UK - Market size and forecast 2023-2028 ($ million)
- Chart on UK - Year-over-year growth 2023-2028 (%)
- Data Table on UK - Year-over-year growth 2023-2028 (%)
- 9.9 Germany - Market size and forecast 2023-2028
- Chart on Germany - Market size and forecast 2023-2028 ($ million)
- Data Table on Germany - Market size and forecast 2023-2028 ($ million)
- Chart on Germany - Year-over-year growth 2023-2028 (%)
- Data Table on Germany - Year-over-year growth 2023-2028 (%)
- 9.10 Canada - Market size and forecast 2023-2028
- Chart on Canada - Market size and forecast 2023-2028 ($ million)
- Data Table on Canada - Market size and forecast 2023-2028 ($ million)
- Chart on Canada - Year-over-year growth 2023-2028 (%)
- Data Table on Canada - Year-over-year growth 2023-2028 (%)
- 9.11 China - Market size and forecast 2023-2028
- Chart on China - Market size and forecast 2023-2028 ($ million)
- Data Table on China - Market size and forecast 2023-2028 ($ million)
- Chart on China - Year-over-year growth 2023-2028 (%)
- Data Table on China - Year-over-year growth 2023-2028 (%)
- 9.12 Market opportunity By Geographical Landscape
- Market opportunity By Geographical Landscape ($ million)
- Data Tables on Market opportunity By Geographical Landscape ($ million)
10 Drivers, Challenges, and Opportunity/Restraints
- 10.1 Market drivers
- 10.2 Market challenges
- 10.3 Impact of drivers and challenges
- Impact of drivers and challenges in 2023 and 2028
- 10.4 Market opportunities/restraints
11 Competitive Landscape
- 11.1 Overview
- 11.2 Competitive Landscape
- Overview on criticality of inputs and factors of differentiation
- 11.3 Landscape disruption
- Overview on factors of disruption
- 11.4 Industry risks
- Impact of key risks on business
12 Competitive Analysis
- 12.1 Companies profiled
- Companies covered
- 12.2 Market positioning of companies
- Matrix on companies position and classification
- 12.3 ACCU SCOPE Inc.
- ACCU SCOPE Inc. - Overview
- ACCU SCOPE Inc. - Product / Service
- ACCU SCOPE Inc. - Key offerings
- 12.4 Agilent Technologies Inc.
- Agilent Technologies Inc. - Overview
- Agilent Technologies Inc. - Business segments
- Agilent Technologies Inc. - Key news
- Agilent Technologies Inc. - Key offerings
- Agilent Technologies Inc. - Segment focus
- 12.5 AMETEK Inc.
- AMETEK Inc. - Overview
- AMETEK Inc. - Business segments
- AMETEK Inc. - Key news
- AMETEK Inc. - Key offerings
- AMETEK Inc. - Segment focus
- 12.6 AmScope
- AmScope - Overview
- AmScope - Product / Service
- AmScope - Key offerings
- 12.7 Bruker Corp.
- Bruker Corp. - Overview
- Bruker Corp. - Business segments
- Bruker Corp. - Key news
- Bruker Corp. - Key offerings
- Bruker Corp. - Segment focus
- 12.8 Carl Zeiss AG
- Carl Zeiss AG - Overview
- Carl Zeiss AG - Product / Service
- Carl Zeiss AG - Key news
- Carl Zeiss AG - Key offerings
- 12.9 Danaher Corp.
- Danaher Corp. - Overview
- Danaher Corp. - Business segments
- Danaher Corp. - Key news
- Danaher Corp. - Key offerings
- Danaher Corp. - Segment focus
- 12.10 Hirox Co. Ltd.
- Hirox Co. Ltd. - Overview
- Hirox Co. Ltd. - Product / Service
- Hirox Co. Ltd. - Key offerings
- 12.11 Hitachi Ltd.
- Hitachi Ltd. - Overview
- Hitachi Ltd. - Business segments
- Hitachi Ltd. - Key news
- Hitachi Ltd. - Key offerings
- Hitachi Ltd. - Segment focus
- 12.12 Keyence Corp.
- Keyence Corp. - Overview
- Keyence Corp. - Product / Service
- Keyence Corp. - Key offerings
- 12.13 KLA Corp.
- KLA Corp. - Overview
- KLA Corp. - Business segments
- KLA Corp. - Key offerings
- KLA Corp. - Segment focus
- 12.14 Labomed Inc.
- Labomed Inc. - Overview
- Labomed Inc. - Product / Service
- Labomed Inc. - Key offerings
- 12.15 Nikon Corp.
- Nikon Corp. - Overview
- Nikon Corp. - Business segments
- Nikon Corp. - Key news
- Nikon Corp. - Key offerings
- Nikon Corp. - Segment focus
- 12.16 Olympus Corp.
- Olympus Corp. - Overview
- Olympus Corp. - Business segments
- Olympus Corp. - Key news
- Olympus Corp. - Key offerings
- Olympus Corp. - Segment focus
- 12.17 PCE Holding GmbH
- PCE Holding GmbH - Overview
- PCE Holding GmbH - Product / Service
- PCE Holding GmbH - Key offerings
13 Appendix
- 13.1 Scope of the report
- 13.2 Inclusions and exclusions checklist
- Inclusions checklist
- Exclusions checklist
- 13.3 Currency conversion rates for US$
- Currency conversion rates for US$
- 13.4 Research methodology
- Research methodology
- 13.5 Data procurement
- Information sources
- 13.6 Data validation
- Data validation
- 13.7 Validation techniques employed for market sizing
- Validation techniques employed for market sizing
- 13.8 Data synthesis
- Data synthesis
- 13.9 360 degree market analysis
- 360 degree market analysis
- 13.10 List of abbreviations
- List of abbreviations

