|
|
市場調査レポート
商品コード
1516164
アルコール準備パッドの世界市場 2024-2028Global alcohol prep pads market 2024-2028 |
||||||
|
|||||||
カスタマイズ可能
|
|||||||


| アルコール準備パッドの世界市場 2024-2028 |
|
出版日: 2024年06月11日
発行: TechNavio
ページ情報: 英文 167 Pages
納期: 即納可能
|

全表示
- 概要
- 図表
- 目次
アルコール準備パッド市場は2023-2028年に4億5,120万米ドル、予測期間中のCAGRは15.2%で成長すると予測されます。
当レポートでは、アルコール準備パッド市場の全体的な分析、市場規模・予測、動向、成長促進要因、課題、約25のベンダーを網羅したベンダー分析などを掲載しています。
現在の市場シナリオ、最新動向と促進要因、市場環境全体に関する最新分析を提供しています。市場は、世界の外科手術件数の増加、スポーツや交通事故での死亡傷害件数の増加、ワクチン生産量の増加などが牽引しています。
| 市場範囲 | |
|---|---|
| 基準年 | 2024 |
| 終了年 | 2028 |
| 予測期間 | 2024-2028 |
| 成長モメンタム | 加速 |
| 前年比2024年 | 12.86% |
| CAGR | 15.2% |
| 増分額 | 4億5,120万米ドル |
本調査では、今後数年間におけるアルコール準備パッド市場の成長を促進する主な要因の1つとして、オンライン小売業者の利用可能性の増加を挙げています。また、アジアにおけるベンダーの普及拡大や糖尿病性慢性創傷の増加も市場の大きな需要につながります。
目次
第1章 エグゼクティブサマリー
- 市場概要
第2章 市場情勢
- 市場エコシステム
- 市場の特徴
- バリューチェーン分析
第3章 市場規模の評価
- 市場の定義
- 市場セグメント分析
- 市場規模 2023
- 市場の見通し 2023-2028
第4章 市場規模実績
- 世界アルコール準備パッド市場 2018-2022
- エンドユーザー別セグメント分析 2018-2022
- 製品別セグメント分析 2018-2022
- 地域別セグメント分析 2018-2022
- 国別セグメント分析 2018-2022
第5章 ファイブフォース分析
- ファイブフォースの要約
- 買い手の交渉力
- 供給企業の交渉力
- 新規参入業者の脅威
- 代替品の脅威
- 競争の脅威
- 市況
第6章 市場セグメンテーション:エンドユーザー別
- 市場セグメンテーション
- 比較:エンドユーザー別
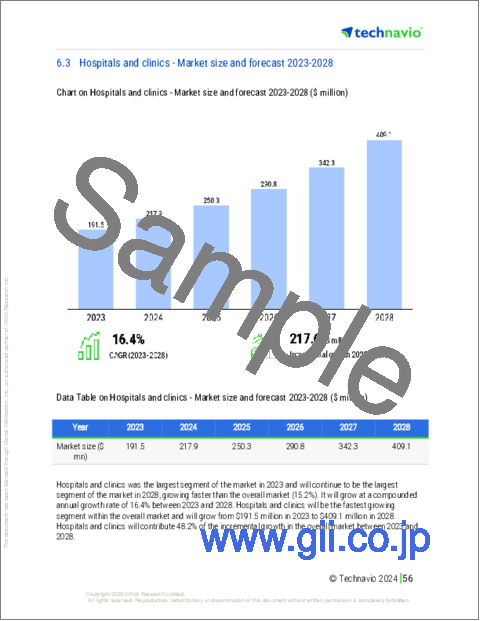
- 病院と診療所:市場規模と予測 2023-2028
- 外来手術センター:市場規模と予測 2023-2028
- その他:市場規模と予測 2023-2028
- 市場機会:エンドユーザー別
第7章 市場セグメンテーション:製品別
- 市場セグメンテーション
- 比較:製品別
- アルコール綿球:市場規模と予測 2023-2028
- アルコール綿シート:市場規模と予測 2023-2028
- 市場機会:製品別
第8章 顧客情勢
- 顧客情勢の概要
第9章 地域別情勢
- 地域別セグメンテーション
- 地域別比較
- 北米:市場規模と予測 2023-2028
- 欧州:市場規模と予測 2023-2028
- アジア:市場規模と予測 2023-2028
- 世界のその他の地域:市場規模と予測 2023-2028
- 米国:市場規模と予測 2023-2028
- 中国:市場規模と予測 2023-2028
- ドイツ:市場規模と予測 2023-2028
- フランス:市場規模と予測 2023-2028
- 英国:市場規模と予測 2023-2028
- 市場機会:地域情勢別
第10章 促進要因・課題・機会・抑制要因
- 市場促進要因
- 市場の課題
- 促進要因と課題の影響
- 市場の機会・抑制要因
第11章 競合情勢
- 概要
- 競合情勢
- 混乱の状況
- 業界のリスク
第12章 競合分析
- 企業プロファイル
- 企業の市場ポジショニング
- AdvaCare Pharma
- Allison Medical Inc.
- Avantor Inc.
- B.Braun SE
- Baxter International Inc.
- Cardinal Health Inc.
- Care Touch
- CareNow Medical Pvt. Ltd.
- Delta Hi Tech Inc.
- Dynarex Corp.
- McKesson Corp.
- Medline Industries LP
- Nipro Corp.
- PDI Inc.
- Thermo Fisher Scientific Inc.
第13章 付録
Exhibits:
- Exhibits1: Executive Summary - Chart on Market Overview
- Exhibits2: Executive Summary - Data Table on Market Overview
- Exhibits3: Executive Summary - Chart on Global Market Characteristics
- Exhibits4: Executive Summary - Chart on Market By Geographical Landscape
- Exhibits5: Executive Summary - Chart on Market Segmentation by End-user
- Exhibits6: Executive Summary - Chart on Market Segmentation by Product
- Exhibits7: Executive Summary - Chart on Incremental Growth
- Exhibits8: Executive Summary - Data Table on Incremental Growth
- Exhibits9: Executive Summary - Chart on Company Market Positioning
- Exhibits10: Parent Market
- Exhibits11: Data Table on - Parent Market
- Exhibits12: Market characteristics analysis
- Exhibits13: Value Chain Analysis
- Exhibits14: Offerings of companies included in the market definition
- Exhibits15: Market segments
- Exhibits16: Chart on Global - Market size and forecast 2023-2028 ($ million)
- Exhibits17: Data Table on Global - Market size and forecast 2023-2028 ($ million)
- Exhibits18: Chart on Global Market: Year-over-year growth 2023-2028 (%)
- Exhibits19: Data Table on Global Market: Year-over-year growth 2023-2028 (%)
- Exhibits20: Historic Market Size - Data Table on Global Alcohol Prep Pads Market 2018 - 2022 ($ million)
- Exhibits21: Historic Market Size - End-user Segment 2018 - 2022 ($ million)
- Exhibits22: Historic Market Size - Product Segment 2018 - 2022 ($ million)
- Exhibits23: Historic Market Size - Geography Segment 2018 - 2022 ($ million)
- Exhibits24: Historic Market Size - Country Segment 2018 - 2022 ($ million)
- Exhibits25: Five forces analysis - Comparison between 2023 and 2028
- Exhibits26: Bargaining power of buyers - Impact of key factors 2023 and 2028
- Exhibits27: Bargaining power of suppliers - Impact of key factors in 2023 and 2028
- Exhibits28: Threat of new entrants - Impact of key factors in 2023 and 2028
- Exhibits29: Threat of substitutes - Impact of key factors in 2023 and 2028
- Exhibits30: Threat of rivalry - Impact of key factors in 2023 and 2028
- Exhibits31: Chart on Market condition - Five forces 2023 and 2028
- Exhibits32: Chart on End-user - Market share 2023-2028 (%)
- Exhibits33: Data Table on End-user - Market share 2023-2028 (%)
- Exhibits34: Chart on Comparison by End-user
- Exhibits35: Data Table on Comparison by End-user
- Exhibits36: Chart on Hospitals and clinics - Market size and forecast 2023-2028 ($ million)
- Exhibits37: Data Table on Hospitals and clinics - Market size and forecast 2023-2028 ($ million)
- Exhibits38: Chart on Hospitals and clinics - Year-over-year growth 2023-2028 (%)
- Exhibits39: Data Table on Hospitals and clinics - Year-over-year growth 2023-2028 (%)
- Exhibits40: Chart on ASCs - Market size and forecast 2023-2028 ($ million)
- Exhibits41: Data Table on ASCs - Market size and forecast 2023-2028 ($ million)
- Exhibits42: Chart on ASCs - Year-over-year growth 2023-2028 (%)
- Exhibits43: Data Table on ASCs - Year-over-year growth 2023-2028 (%)
- Exhibits44: Chart on Others - Market size and forecast 2023-2028 ($ million)
- Exhibits45: Data Table on Others - Market size and forecast 2023-2028 ($ million)
- Exhibits46: Chart on Others - Year-over-year growth 2023-2028 (%)
- Exhibits47: Data Table on Others - Year-over-year growth 2023-2028 (%)
- Exhibits48: Market opportunity by End-user ($ million)
- Exhibits49: Data Table on Market opportunity by End-user ($ million)
- Exhibits50: Chart on Product - Market share 2023-2028 (%)
- Exhibits51: Data Table on Product - Market share 2023-2028 (%)
- Exhibits52: Chart on Comparison by Product
- Exhibits53: Data Table on Comparison by Product
- Exhibits54: Chart on Alcohol cotton balls - Market size and forecast 2023-2028 ($ million)
- Exhibits55: Data Table on Alcohol cotton balls - Market size and forecast 2023-2028 ($ million)
- Exhibits56: Chart on Alcohol cotton balls - Year-over-year growth 2023-2028 (%)
- Exhibits57: Data Table on Alcohol cotton balls - Year-over-year growth 2023-2028 (%)
- Exhibits58: Chart on Alcohol cotton sheet - Market size and forecast 2023-2028 ($ million)
- Exhibits59: Data Table on Alcohol cotton sheet - Market size and forecast 2023-2028 ($ million)
- Exhibits60: Chart on Alcohol cotton sheet - Year-over-year growth 2023-2028 (%)
- Exhibits61: Data Table on Alcohol cotton sheet - Year-over-year growth 2023-2028 (%)
- Exhibits62: Market opportunity by Product ($ million)
- Exhibits63: Data Table on Market opportunity by Product ($ million)
- Exhibits64: Analysis of price sensitivity, lifecycle, customer purchase basket, adoption rates, and purchase criteria
- Exhibits65: Chart on Market share By Geographical Landscape 2023-2028 (%)
- Exhibits66: Data Table on Market share By Geographical Landscape 2023-2028 (%)
- Exhibits67: Chart on Geographic comparison
- Exhibits68: Data Table on Geographic comparison
- Exhibits69: Chart on North America - Market size and forecast 2023-2028 ($ million)
- Exhibits70: Data Table on North America - Market size and forecast 2023-2028 ($ million)
- Exhibits71: Chart on North America - Year-over-year growth 2023-2028 (%)
- Exhibits72: Data Table on North America - Year-over-year growth 2023-2028 (%)
- Exhibits73: Chart on Europe - Market size and forecast 2023-2028 ($ million)
- Exhibits74: Data Table on Europe - Market size and forecast 2023-2028 ($ million)
- Exhibits75: Chart on Europe - Year-over-year growth 2023-2028 (%)
- Exhibits76: Data Table on Europe - Year-over-year growth 2023-2028 (%)
- Exhibits77: Chart on Asia - Market size and forecast 2023-2028 ($ million)
- Exhibits78: Data Table on Asia - Market size and forecast 2023-2028 ($ million)
- Exhibits79: Chart on Asia - Year-over-year growth 2023-2028 (%)
- Exhibits80: Data Table on Asia - Year-over-year growth 2023-2028 (%)
- Exhibits81: Chart on Rest of World (ROW) - Market size and forecast 2023-2028 ($ million)
- Exhibits82: Data Table on Rest of World (ROW) - Market size and forecast 2023-2028 ($ million)
- Exhibits83: Chart on Rest of World (ROW) - Year-over-year growth 2023-2028 (%)
- Exhibits84: Data Table on Rest of World (ROW) - Year-over-year growth 2023-2028 (%)
- Exhibits85: Chart on US - Market size and forecast 2023-2028 ($ million)
- Exhibits86: Data Table on US - Market size and forecast 2023-2028 ($ million)
- Exhibits87: Chart on US - Year-over-year growth 2023-2028 (%)
- Exhibits88: Data Table on US - Year-over-year growth 2023-2028 (%)
- Exhibits89: Chart on China - Market size and forecast 2023-2028 ($ million)
- Exhibits90: Data Table on China - Market size and forecast 2023-2028 ($ million)
- Exhibits91: Chart on China - Year-over-year growth 2023-2028 (%)
- Exhibits92: Data Table on China - Year-over-year growth 2023-2028 (%)
- Exhibits93: Chart on Germany - Market size and forecast 2023-2028 ($ million)
- Exhibits94: Data Table on Germany - Market size and forecast 2023-2028 ($ million)
- Exhibits95: Chart on Germany - Year-over-year growth 2023-2028 (%)
- Exhibits96: Data Table on Germany - Year-over-year growth 2023-2028 (%)
- Exhibits97: Chart on France - Market size and forecast 2023-2028 ($ million)
- Exhibits98: Data Table on France - Market size and forecast 2023-2028 ($ million)
- Exhibits99: Chart on France - Year-over-year growth 2023-2028 (%)
- Exhibits100: Data Table on France - Year-over-year growth 2023-2028 (%)
- Exhibits101: Chart on UK - Market size and forecast 2023-2028 ($ million)
- Exhibits102: Data Table on UK - Market size and forecast 2023-2028 ($ million)
- Exhibits103: Chart on UK - Year-over-year growth 2023-2028 (%)
- Exhibits104: Data Table on UK - Year-over-year growth 2023-2028 (%)
- Exhibits105: Market opportunity By Geographical Landscape ($ million)
- Exhibits106: Data Tables on Market opportunity By Geographical Landscape ($ million)
- Exhibits107: Impact of drivers and challenges in 2023 and 2028
- Exhibits108: Overview on criticality of inputs and factors of differentiation
- Exhibits109: Overview on factors of disruption
- Exhibits110: Impact of key risks on business
- Exhibits111: Companies covered
- Exhibits112: Matrix on companies position and classification
- Exhibits113: AdvaCare Pharma - Overview
- Exhibits114: AdvaCare Pharma - Product / Service
- Exhibits115: AdvaCare Pharma - Key offerings
- Exhibits116: Allison Medical Inc. - Overview
- Exhibits117: Allison Medical Inc. - Product / Service
- Exhibits118: Allison Medical Inc. - Key offerings
- Exhibits119: Avantor Inc. - Overview
- Exhibits120: Avantor Inc. - Business segments
- Exhibits121: Avantor Inc. - Key news
- Exhibits122: Avantor Inc. - Key offerings
- Exhibits123: Avantor Inc. - Segment focus
- Exhibits124: B.Braun SE - Overview
- Exhibits125: B.Braun SE - Business segments
- Exhibits126: B.Braun SE - Key news
- Exhibits127: B.Braun SE - Key offerings
- Exhibits128: B.Braun SE - Segment focus
- Exhibits129: Baxter International Inc. - Overview
- Exhibits130: Baxter International Inc. - Business segments
- Exhibits131: Baxter International Inc. - Key news
- Exhibits132: Baxter International Inc. - Key offerings
- Exhibits133: Baxter International Inc. - Segment focus
- Exhibits134: Cardinal Health Inc. - Overview
- Exhibits135: Cardinal Health Inc. - Business segments
- Exhibits136: Cardinal Health Inc. - Key news
- Exhibits137: Cardinal Health Inc. - Key offerings
- Exhibits138: Cardinal Health Inc. - Segment focus
- Exhibits139: Care Touch - Overview
- Exhibits140: Care Touch - Product / Service
- Exhibits141: Care Touch - Key offerings
- Exhibits142: CareNow Medical Pvt. Ltd. - Overview
- Exhibits143: CareNow Medical Pvt. Ltd. - Product / Service
- Exhibits144: CareNow Medical Pvt. Ltd. - Key offerings
- Exhibits145: Delta Hi Tech Inc. - Overview
- Exhibits146: Delta Hi Tech Inc. - Product / Service
- Exhibits147: Delta Hi Tech Inc. - Key offerings
- Exhibits148: Dynarex Corp. - Overview
- Exhibits149: Dynarex Corp. - Product / Service
- Exhibits150: Dynarex Corp. - Key offerings
- Exhibits151: McKesson Corp. - Overview
- Exhibits152: McKesson Corp. - Business segments
- Exhibits153: McKesson Corp. - Key news
- Exhibits154: McKesson Corp. - Key offerings
- Exhibits155: McKesson Corp. - Segment focus
- Exhibits156: Medline Industries LP - Overview
- Exhibits157: Medline Industries LP - Product / Service
- Exhibits158: Medline Industries LP - Key offerings
- Exhibits159: Nipro Corp. - Overview
- Exhibits160: Nipro Corp. - Business segments
- Exhibits161: Nipro Corp. - Key offerings
- Exhibits162: Nipro Corp. - Segment focus
- Exhibits163: PDI Inc. - Overview
- Exhibits164: PDI Inc. - Product / Service
- Exhibits165: PDI Inc. - Key offerings
- Exhibits166: Thermo Fisher Scientific Inc. - Overview
- Exhibits167: Thermo Fisher Scientific Inc. - Business segments
- Exhibits168: Thermo Fisher Scientific Inc. - Key news
- Exhibits169: Thermo Fisher Scientific Inc. - Key offerings
- Exhibits170: Thermo Fisher Scientific Inc. - Segment focus
- Exhibits171: Inclusions checklist
- Exhibits172: Exclusions checklist
- Exhibits173: Currency conversion rates for US$
- Exhibits174: Research methodology
- Exhibits175: Information sources
- Exhibits176: Data validation
- Exhibits177: Validation techniques employed for market sizing
- Exhibits178: Data synthesis
- Exhibits179: 360 degree market analysis
- Exhibits180: List of abbreviations
The alcohol prep pads market is forecasted to grow by USD 451.2 mn during 2023-2028, accelerating at a CAGR of 15.2% during the forecast period. The report on the alcohol prep pads market provides a holistic analysis, market size and forecast, trends, growth drivers, and challenges, as well as vendor analysis covering around 25 vendors.
The report offers an up-to-date analysis regarding the current market scenario, the latest trends and drivers, and the overall market environment. The market is driven by rising number of surgical procedures worldwide, growing number of fatal injuries in sports and road accidents, and increasing vaccine production.
Technavio's alcohol prep pads market is segmented as below:
| Market Scope | |
|---|---|
| Base Year | 2024 |
| End Year | 2028 |
| Series Year | 2024-2028 |
| Growth Momentum | Accelerate |
| YOY 2024 | 12.86% |
| CAGR | 15.2% |
| Incremental Value | $451.2mn |
By End-user
- Hospitals and clinics
- ASCs
- Others
By Product
- Alcohol cotton balls
- Alcohol cotton sheet
By Geographical Landscape
- North America
- Europe
- Asia
- Rest of World (ROW)
This study identifies the increasing availability of online retailers as one of the prime reasons driving the alcohol prep pads market growth during the next few years. Also, growing penetration of vendors in Asia and rising incidence of chronic diabetic wounds will lead to sizable demand in the market.
The report on the alcohol prep pads market covers the following areas:
- Alcohol prep pads market sizing
- Alcohol prep pads market forecast
- Alcohol prep pads market industry analysis
The robust vendor analysis is designed to help clients improve their market position, and in line with this, this report provides a detailed analysis of several leading alcohol prep pads market vendors that include AdvaCare Pharma, Allison Medical Inc., Avantor Inc., B.Braun SE, Baxter International Inc., Cardinal Health Inc., Care Touch, CareNow Medical Pvt. Ltd., Delta Hi Tech Inc., DUKAL Corp., Dynarex Corp., GAMA Healthcare Ltd., McKesson Corp., Medline Industries LP, Nipro Corp., Penta Bioscience Products, Phoenix Healthcare Solutions LLC, PDI Inc., Reynard Health Supplies, and Thermo Fisher Scientific Inc.. Also, the alcohol prep pads market analysis report includes information on upcoming trends and challenges that will influence market growth. This is to help companies strategize and leverage all forthcoming growth opportunities.
The study was conducted using an objective combination of primary and secondary information including inputs from key participants in the industry. The report contains a comprehensive market and vendor landscape in addition to an analysis of the key vendors.
The publisher presents a detailed picture of the market by the way of study, synthesis, and summation of data from multiple sources by an analysis of key parameters such as profit, pricing, competition, and promotions. It presents various market facets by identifying the key industry influencers. The data presented is comprehensive, reliable, and a result of extensive research - both primary and secondary. The market research reports provide a complete competitive landscape and an in-depth vendor selection methodology and analysis using qualitative and quantitative research to forecast the accurate market growth.
Table of Contents
1 Executive Summary
- 1.1 Market overview
- Executive Summary - Chart on Market Overview
- Executive Summary - Data Table on Market Overview
- Executive Summary - Chart on Global Market Characteristics
- Executive Summary - Chart on Market By Geographical Landscape
- Executive Summary - Chart on Market Segmentation by End-user
- Executive Summary - Chart on Market Segmentation by Product
- Executive Summary - Chart on Incremental Growth
- Executive Summary - Data Table on Incremental Growth
- Executive Summary - Chart on Company Market Positioning
2 Market Landscape
- 2.1 Market ecosystem
- Parent Market
- Data Table on - Parent Market
- 2.2 Market characteristics
- Market characteristics analysis
- 2.3 Value chain analysis
- Value Chain Analysis
3 Market Sizing
- 3.1 Market definition
- Offerings of companies included in the market definition
- 3.2 Market segment analysis
- Market segments
- 3.3 Market size 2023
- 3.4 Market outlook: Forecast for 2023-2028
- Chart on Global - Market size and forecast 2023-2028 ($ million)
- Data Table on Global - Market size and forecast 2023-2028 ($ million)
- Chart on Global Market: Year-over-year growth 2023-2028 (%)
- Data Table on Global Market: Year-over-year growth 2023-2028 (%)
4 Historic Market Size
- 4.1 Global Alcohol Prep Pads Market 2018 - 2022
- Historic Market Size - Data Table on Global Alcohol Prep Pads Market 2018 - 2022 ($ million)
- 4.2 End-user segment analysis 2018 - 2022
- Historic Market Size - End-user Segment 2018 - 2022 ($ million)
- 4.3 Product segment analysis 2018 - 2022
- Historic Market Size - Product Segment 2018 - 2022 ($ million)
- 4.4 Geography segment analysis 2018 - 2022
- Historic Market Size - Geography Segment 2018 - 2022 ($ million)
- 4.5 Country segment analysis 2018 - 2022
- Historic Market Size - Country Segment 2018 - 2022 ($ million)
5 Five Forces Analysis
- 5.1 Five forces summary
- Five forces analysis - Comparison between 2023 and 2028
- 5.2 Bargaining power of buyers
- Bargaining power of buyers - Impact of key factors 2023 and 2028
- 5.3 Bargaining power of suppliers
- Bargaining power of suppliers - Impact of key factors in 2023 and 2028
- 5.4 Threat of new entrants
- Threat of new entrants - Impact of key factors in 2023 and 2028
- 5.5 Threat of substitutes
- Threat of substitutes - Impact of key factors in 2023 and 2028
- 5.6 Threat of rivalry
- Threat of rivalry - Impact of key factors in 2023 and 2028
- 5.7 Market condition
- Chart on Market condition - Five forces 2023 and 2028
6 Market Segmentation by End-user
- 6.1 Market segments
- Chart on End-user - Market share 2023-2028 (%)
- Data Table on End-user - Market share 2023-2028 (%)
- 6.2 Comparison by End-user
- Chart on Comparison by End-user
- Data Table on Comparison by End-user
- 6.3 Hospitals and clinics - Market size and forecast 2023-2028
- Chart on Hospitals and clinics - Market size and forecast 2023-2028 ($ million)
- Data Table on Hospitals and clinics - Market size and forecast 2023-2028 ($ million)
- Chart on Hospitals and clinics - Year-over-year growth 2023-2028 (%)
- Data Table on Hospitals and clinics - Year-over-year growth 2023-2028 (%)
- 6.4 ASCs - Market size and forecast 2023-2028
- Chart on ASCs - Market size and forecast 2023-2028 ($ million)
- Data Table on ASCs - Market size and forecast 2023-2028 ($ million)
- Chart on ASCs - Year-over-year growth 2023-2028 (%)
- Data Table on ASCs - Year-over-year growth 2023-2028 (%)
- 6.5 Others - Market size and forecast 2023-2028
- Chart on Others - Market size and forecast 2023-2028 ($ million)
- Data Table on Others - Market size and forecast 2023-2028 ($ million)
- Chart on Others - Year-over-year growth 2023-2028 (%)
- Data Table on Others - Year-over-year growth 2023-2028 (%)
- 6.6 Market opportunity by End-user
- Market opportunity by End-user ($ million)
- Data Table on Market opportunity by End-user ($ million)
7 Market Segmentation by Product
- 7.1 Market segments
- Chart on Product - Market share 2023-2028 (%)
- Data Table on Product - Market share 2023-2028 (%)
- 7.2 Comparison by Product
- Chart on Comparison by Product
- Data Table on Comparison by Product
- 7.3 Alcohol cotton balls - Market size and forecast 2023-2028
- Chart on Alcohol cotton balls - Market size and forecast 2023-2028 ($ million)
- Data Table on Alcohol cotton balls - Market size and forecast 2023-2028 ($ million)
- Chart on Alcohol cotton balls - Year-over-year growth 2023-2028 (%)
- Data Table on Alcohol cotton balls - Year-over-year growth 2023-2028 (%)
- 7.4 Alcohol cotton sheet - Market size and forecast 2023-2028
- Chart on Alcohol cotton sheet - Market size and forecast 2023-2028 ($ million)
- Data Table on Alcohol cotton sheet - Market size and forecast 2023-2028 ($ million)
- Chart on Alcohol cotton sheet - Year-over-year growth 2023-2028 (%)
- Data Table on Alcohol cotton sheet - Year-over-year growth 2023-2028 (%)
- 7.5 Market opportunity by Product
- Market opportunity by Product ($ million)
- Data Table on Market opportunity by Product ($ million)
8 Customer Landscape
- 8.1 Customer landscape overview
- Analysis of price sensitivity, lifecycle, customer purchase basket, adoption rates, and purchase criteria
9 Geographic Landscape
- 9.1 Geographic segmentation
- Chart on Market share By Geographical Landscape 2023-2028 (%)
- Data Table on Market share By Geographical Landscape 2023-2028 (%)
- 9.2 Geographic comparison
- Chart on Geographic comparison
- Data Table on Geographic comparison
- 9.3 North America - Market size and forecast 2023-2028
- Chart on North America - Market size and forecast 2023-2028 ($ million)
- Data Table on North America - Market size and forecast 2023-2028 ($ million)
- Chart on North America - Year-over-year growth 2023-2028 (%)
- Data Table on North America - Year-over-year growth 2023-2028 (%)
- 9.4 Europe - Market size and forecast 2023-2028
- Chart on Europe - Market size and forecast 2023-2028 ($ million)
- Data Table on Europe - Market size and forecast 2023-2028 ($ million)
- Chart on Europe - Year-over-year growth 2023-2028 (%)
- Data Table on Europe - Year-over-year growth 2023-2028 (%)
- 9.5 Asia - Market size and forecast 2023-2028
- Chart on Asia - Market size and forecast 2023-2028 ($ million)
- Data Table on Asia - Market size and forecast 2023-2028 ($ million)
- Chart on Asia - Year-over-year growth 2023-2028 (%)
- Data Table on Asia - Year-over-year growth 2023-2028 (%)
- 9.6 Rest of World (ROW) - Market size and forecast 2023-2028
- Chart on Rest of World (ROW) - Market size and forecast 2023-2028 ($ million)
- Data Table on Rest of World (ROW) - Market size and forecast 2023-2028 ($ million)
- Chart on Rest of World (ROW) - Year-over-year growth 2023-2028 (%)
- Data Table on Rest of World (ROW) - Year-over-year growth 2023-2028 (%)
- 9.7 US - Market size and forecast 2023-2028
- Chart on US - Market size and forecast 2023-2028 ($ million)
- Data Table on US - Market size and forecast 2023-2028 ($ million)
- Chart on US - Year-over-year growth 2023-2028 (%)
- Data Table on US - Year-over-year growth 2023-2028 (%)
- 9.8 China - Market size and forecast 2023-2028
- Chart on China - Market size and forecast 2023-2028 ($ million)
- Data Table on China - Market size and forecast 2023-2028 ($ million)
- Chart on China - Year-over-year growth 2023-2028 (%)
- Data Table on China - Year-over-year growth 2023-2028 (%)
- 9.9 Germany - Market size and forecast 2023-2028
- Chart on Germany - Market size and forecast 2023-2028 ($ million)
- Data Table on Germany - Market size and forecast 2023-2028 ($ million)
- Chart on Germany - Year-over-year growth 2023-2028 (%)
- Data Table on Germany - Year-over-year growth 2023-2028 (%)
- 9.10 France - Market size and forecast 2023-2028
- Chart on France - Market size and forecast 2023-2028 ($ million)
- Data Table on France - Market size and forecast 2023-2028 ($ million)
- Chart on France - Year-over-year growth 2023-2028 (%)
- Data Table on France - Year-over-year growth 2023-2028 (%)
- 9.11 UK - Market size and forecast 2023-2028
- Chart on UK - Market size and forecast 2023-2028 ($ million)
- Data Table on UK - Market size and forecast 2023-2028 ($ million)
- Chart on UK - Year-over-year growth 2023-2028 (%)
- Data Table on UK - Year-over-year growth 2023-2028 (%)
- 9.12 Market opportunity By Geographical Landscape
- Market opportunity By Geographical Landscape ($ million)
- Data Tables on Market opportunity By Geographical Landscape ($ million)
10 Drivers, Challenges, and Opportunity/Restraints
- 10.1 Market drivers
- 10.2 Market challenges
- 10.3 Impact of drivers and challenges
- Impact of drivers and challenges in 2023 and 2028
- 10.4 Market opportunities/restraints
11 Competitive Landscape
- 11.1 Overview
- 11.2 Competitive Landscape
- Overview on criticality of inputs and factors of differentiation
- 11.3 Landscape disruption
- Overview on factors of disruption
- 11.4 Industry risks
- Impact of key risks on business
12 Competitive Analysis
- 12.1 Companies profiled
- Companies covered
- 12.2 Market positioning of companies
- Matrix on companies position and classification
- 12.3 AdvaCare Pharma
- AdvaCare Pharma - Overview
- AdvaCare Pharma - Product / Service
- AdvaCare Pharma - Key offerings
- 12.4 Allison Medical Inc.
- Allison Medical Inc. - Overview
- Allison Medical Inc. - Product / Service
- Allison Medical Inc. - Key offerings
- 12.5 Avantor Inc.
- Avantor Inc. - Overview
- Avantor Inc. - Business segments
- Avantor Inc. - Key news
- Avantor Inc. - Key offerings
- Avantor Inc. - Segment focus
- 12.6 B.Braun SE
- B.Braun SE - Overview
- B.Braun SE - Business segments
- B.Braun SE - Key news
- B.Braun SE - Key offerings
- B.Braun SE - Segment focus
- 12.7 Baxter International Inc.
- Baxter International Inc. - Overview
- Baxter International Inc. - Business segments
- Baxter International Inc. - Key news
- Baxter International Inc. - Key offerings
- Baxter International Inc. - Segment focus
- 12.8 Cardinal Health Inc.
- Cardinal Health Inc. - Overview
- Cardinal Health Inc. - Business segments
- Cardinal Health Inc. - Key news
- Cardinal Health Inc. - Key offerings
- Cardinal Health Inc. - Segment focus
- 12.9 Care Touch
- Care Touch - Overview
- Care Touch - Product / Service
- Care Touch - Key offerings
- 12.10 CareNow Medical Pvt. Ltd.
- CareNow Medical Pvt. Ltd. - Overview
- CareNow Medical Pvt. Ltd. - Product / Service
- CareNow Medical Pvt. Ltd. - Key offerings
- 12.11 Delta Hi Tech Inc.
- Delta Hi Tech Inc. - Overview
- Delta Hi Tech Inc. - Product / Service
- Delta Hi Tech Inc. - Key offerings
- 12.12 Dynarex Corp.
- Dynarex Corp. - Overview
- Dynarex Corp. - Product / Service
- Dynarex Corp. - Key offerings
- 12.13 McKesson Corp.
- McKesson Corp. - Overview
- McKesson Corp. - Business segments
- McKesson Corp. - Key news
- McKesson Corp. - Key offerings
- McKesson Corp. - Segment focus
- 12.14 Medline Industries LP
- Medline Industries LP - Overview
- Medline Industries LP - Product / Service
- Medline Industries LP - Key offerings
- 12.15 Nipro Corp.
- Nipro Corp. - Overview
- Nipro Corp. - Business segments
- Nipro Corp. - Key offerings
- Nipro Corp. - Segment focus
- 12.16 PDI Inc.
- PDI Inc. - Overview
- PDI Inc. - Product / Service
- PDI Inc. - Key offerings
- 12.17 Thermo Fisher Scientific Inc.
- Thermo Fisher Scientific Inc. - Overview
- Thermo Fisher Scientific Inc. - Business segments
- Thermo Fisher Scientific Inc. - Key news
- Thermo Fisher Scientific Inc. - Key offerings
- Thermo Fisher Scientific Inc. - Segment focus
13 Appendix
- 13.1 Scope of the report
- 13.2 Inclusions and exclusions checklist
- Inclusions checklist
- Exclusions checklist
- 13.3 Currency conversion rates for US$
- Currency conversion rates for US$
- 13.4 Research methodology
- Research methodology
- 13.5 Data procurement
- Information sources
- 13.6 Data validation
- Data validation
- 13.7 Validation techniques employed for market sizing
- Validation techniques employed for market sizing
- 13.8 Data synthesis
- Data synthesis
- 13.9 360 degree market analysis
- 360 degree market analysis
- 13.10 List of abbreviations
- List of abbreviations

