|
|
市場調査レポート
商品コード
1491564
5G機器の世界市場 2024-2028Global 5G equipment market 2024-2028 |
||||||
|
|||||||
カスタマイズ可能
|
|||||||

| 5G機器の世界市場 2024-2028 |
|
出版日: 2024年05月17日
発行: TechNavio
ページ情報: 英文 181 Pages
納期: 即納可能
|

全表示
- 概要
- 図表
- 目次
5G機器市場は2023-2028年に1,469億5,470万米ドル、予測期間中のCAGRは81.05%で成長すると予測されます。
当レポートでは、5G機器市場の全体的な分析、市場規模・予測、動向、成長促進要因、課題、約25のベンダーを網羅したベンダー分析などを掲載しています。
現在の市場シナリオ、最新動向と促進要因、市場環境全体に関する最新分析を提供しています。市場は、スマートシティ向けの5Gネットワークの採用、スマートフォンの普及と接続性向上に対する需要の高まり、高速ネットワーク接続に対する政府の取り組みなどが牽引しています。
| 市場範囲 | |
|---|---|
| 基準年 | 2024 |
| 終了年 | 2028 |
| 予測期間 | 2024-2028 |
| 成長モメンタム | 加速 |
| 前年比2024年 | 69.9% |
| CAGR | 81.05% |
| 増分額 | 1,469億5,470万米ドル |
本調査では、今後数年間の5G機器市場成長を牽引する主要因の1つとして、5Gネットワークの研究開発と展開の拡大を挙げています。また、商用化前の5G試験や市場参入企業間の戦略的コラボレーションの増加が、市場の大きな需要につながります。
目次
第1章 エグゼクティブサマリー
- 市場概要
第2章 市場情勢
- 市場エコシステム
- 市場の特徴
- バリューチェーン分析
第3章 市場規模の評価
- 市場の定義
- 市場セグメント分析
- 市場規模 2023
- 市場の見通し 2023-2028
第4章 市場規模実績
- 世界5G機器市場 2018-2022
- 製品セグメント分析 2018-2022
- エンドユーザーセグメント分析 2018-2022
- 地域別セグメント分析 2018-2022
- 国別セグメント分析 2018-2022
第5章 ファイブフォース分析
- ファイブフォースの要約
- 買い手の交渉力
- 供給企業の交渉力
- 新規参入業者の脅威
- 代替品の脅威
- 競争の脅威
- 市況
第6章 市場セグメンテーション:製品別
- 市場セグメンテーション
- 比較:製品別
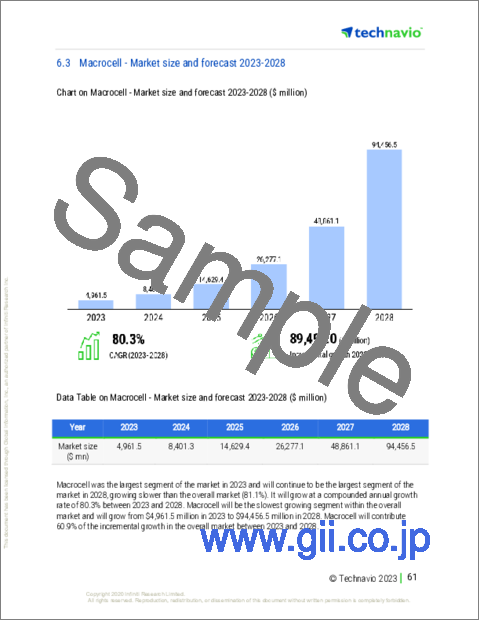
- マクロセル:市場規模と予測 2023-2028
- 小型セル:市場規模と予測 2023-2028
- その他:市場規模と予測 2023-2028
- 市場機会:製品別
第7章 市場セグメンテーション:エンドユーザー別
- 市場セグメンテーション
- 比較:エンドユーザー別
- 非小売業:市場規模と予測 2023-2028
- 小売部門:市場規模と予測 2023-2028
- 市場機会:エンドユーザー別
第8章 顧客情勢
- 顧客情勢の概要
第9章 地域別情勢
- 地域別セグメンテーション
- 地域別比較
- 北米:市場規模と予測 2023-2028
- 欧州:市場規模と予測 2023-2028
- アジア太平洋:市場規模と予測 2023-2028
- 中東・アフリカ:市場規模と予測 2023-2028
- 南米:市場規模と予測 2023-2028
- 米国:市場規模と予測 2023-2028
- 中国:市場規模と予測 2023-2028
- 英国:市場規模と予測 2023-2028
- 韓国:市場規模と予測 2023-2028
- 日本:市場規模と予測 2023-2028
- 市場機会:地域情勢別
第10章 促進要因・課題・機会・抑制要因
- 市場促進要因
- 市場の課題
- 促進要因と課題の影響
- 市場の機会・抑制要因
第11章 競合情勢
- 概要
- 競合情勢
- 混乱の状況
- 業界のリスク
第12章 競合分析
- 企業プロファイル
- 企業の市場ポジショニング
- Airspan Networks Holdings Inc.
- Altiostar
- Analog Devices Inc.
- Cisco Systems Inc.
- Comba Telecom Systems Holdings Ltd.
- CommScope Holding Co. Inc.
- Fujitsu Ltd.
- Huawei Investment and Holding Co. Ltd.
- NEC Corp.
- Nokia Corp.
- Qorvo Inc.
- Qualcomm Inc.
- Samsung Electronics Co. Ltd.
- Telefonaktiebolaget LM Ericsson
- ZTE Corp.
第13章 付録
Exhibits:
- Exhibits1: Executive Summary - Chart on Market Overview
- Exhibits2: Executive Summary - Data Table on Market Overview
- Exhibits3: Executive Summary - Chart on Global Market Characteristics
- Exhibits4: Executive Summary - Chart on Market By Geographical Landscape
- Exhibits5: Executive Summary - Chart on Market Segmentation by Product
- Exhibits6: Executive Summary - Chart on Market Segmentation by End-user
- Exhibits7: Executive Summary - Chart on Incremental Growth
- Exhibits8: Executive Summary - Data Table on Incremental Growth
- Exhibits9: Executive Summary - Chart on Company Market Positioning
- Exhibits10: Parent Market
- Exhibits11: Data Table on - Parent Market
- Exhibits12: Market characteristics analysis
- Exhibits13: Value Chain Analysis
- Exhibits14: Offerings of companies included in the market definition
- Exhibits15: Market segments
- Exhibits16: Chart on Global - Market size and forecast 2023-2028 ($ million)
- Exhibits17: Data Table on Global - Market size and forecast 2023-2028 ($ million)
- Exhibits18: Chart on Global Market: Year-over-year growth 2023-2028 (%)
- Exhibits19: Data Table on Global Market: Year-over-year growth 2023-2028 (%)
- Exhibits20: Historic Market Size - Data Table on Global 5G Equipment Market 2018 - 2022 ($ million)
- Exhibits21: Historic Market Size - Product Segment 2018 - 2022 ($ million)
- Exhibits22: Historic Market Size - End-user Segment 2018 - 2022 ($ million)
- Exhibits23: Historic Market Size - Geography Segment 2018 - 2022 ($ million)
- Exhibits24: Historic Market Size - Country Segment 2018 - 2022 ($ million)
- Exhibits25: Five forces analysis - Comparison between 2023 and 2028
- Exhibits26: Bargaining power of buyers - Impact of key factors 2023 and 2028
- Exhibits27: Bargaining power of suppliers - Impact of key factors in 2023 and 2028
- Exhibits28: Threat of new entrants - Impact of key factors in 2023 and 2028
- Exhibits29: Threat of substitutes - Impact of key factors in 2023 and 2028
- Exhibits30: Threat of rivalry - Impact of key factors in 2023 and 2028
- Exhibits31: Chart on Market condition - Five forces 2023 and 2028
- Exhibits32: Chart on Product - Market share 2023-2028 (%)
- Exhibits33: Data Table on Product - Market share 2023-2028 (%)
- Exhibits34: Chart on Comparison by Product
- Exhibits35: Data Table on Comparison by Product
- Exhibits36: Chart on Macrocell - Market size and forecast 2023-2028 ($ million)
- Exhibits37: Data Table on Macrocell - Market size and forecast 2023-2028 ($ million)
- Exhibits38: Chart on Macrocell - Year-over-year growth 2023-2028 (%)
- Exhibits39: Data Table on Macrocell - Year-over-year growth 2023-2028 (%)
- Exhibits40: Chart on Small cell - Market size and forecast 2023-2028 ($ million)
- Exhibits41: Data Table on Small cell - Market size and forecast 2023-2028 ($ million)
- Exhibits42: Chart on Small cell - Year-over-year growth 2023-2028 (%)
- Exhibits43: Data Table on Small cell - Year-over-year growth 2023-2028 (%)
- Exhibits44: Chart on Others - Market size and forecast 2023-2028 ($ million)
- Exhibits45: Data Table on Others - Market size and forecast 2023-2028 ($ million)
- Exhibits46: Chart on Others - Year-over-year growth 2023-2028 (%)
- Exhibits47: Data Table on Others - Year-over-year growth 2023-2028 (%)
- Exhibits48: Market opportunity by Product ($ million)
- Exhibits49: Data Table on Market opportunity by Product ($ million)
- Exhibits50: Chart on End-user - Market share 2023-2028 (%)
- Exhibits51: Data Table on End-user - Market share 2023-2028 (%)
- Exhibits52: Chart on Comparison by End-user
- Exhibits53: Data Table on Comparison by End-user
- Exhibits54: Chart on Non-retail sector - Market size and forecast 2023-2028 ($ million)
- Exhibits55: Data Table on Non-retail sector - Market size and forecast 2023-2028 ($ million)
- Exhibits56: Chart on Non-retail sector - Year-over-year growth 2023-2028 (%)
- Exhibits57: Data Table on Non-retail sector - Year-over-year growth 2023-2028 (%)
- Exhibits58: Chart on Retail sector - Market size and forecast 2023-2028 ($ million)
- Exhibits59: Data Table on Retail sector - Market size and forecast 2023-2028 ($ million)
- Exhibits60: Chart on Retail sector - Year-over-year growth 2023-2028 (%)
- Exhibits61: Data Table on Retail sector - Year-over-year growth 2023-2028 (%)
- Exhibits62: Market opportunity by End-user ($ million)
- Exhibits63: Data Table on Market opportunity by End-user ($ million)
- Exhibits64: Analysis of price sensitivity, lifecycle, customer purchase basket, adoption rates, and purchase criteria
- Exhibits65: Chart on Market share By Geographical Landscape 2023-2028 (%)
- Exhibits66: Data Table on Market share By Geographical Landscape 2023-2028 (%)
- Exhibits67: Chart on Geographic comparison
- Exhibits68: Data Table on Geographic comparison
- Exhibits69: Chart on North America - Market size and forecast 2023-2028 ($ million)
- Exhibits70: Data Table on North America - Market size and forecast 2023-2028 ($ million)
- Exhibits71: Chart on North America - Year-over-year growth 2023-2028 (%)
- Exhibits72: Data Table on North America - Year-over-year growth 2023-2028 (%)
- Exhibits73: Chart on Europe - Market size and forecast 2023-2028 ($ million)
- Exhibits74: Data Table on Europe - Market size and forecast 2023-2028 ($ million)
- Exhibits75: Chart on Europe - Year-over-year growth 2023-2028 (%)
- Exhibits76: Data Table on Europe - Year-over-year growth 2023-2028 (%)
- Exhibits77: Chart on APAC - Market size and forecast 2023-2028 ($ million)
- Exhibits78: Data Table on APAC - Market size and forecast 2023-2028 ($ million)
- Exhibits79: Chart on APAC - Year-over-year growth 2023-2028 (%)
- Exhibits80: Data Table on APAC - Year-over-year growth 2023-2028 (%)
- Exhibits81: Chart on Middle East and Africa - Market size and forecast 2023-2028 ($ million)
- Exhibits82: Data Table on Middle East and Africa - Market size and forecast 2023-2028 ($ million)
- Exhibits83: Chart on Middle East and Africa - Year-over-year growth 2023-2028 (%)
- Exhibits84: Data Table on Middle East and Africa - Year-over-year growth 2023-2028 (%)
- Exhibits85: Chart on South America - Market size and forecast 2023-2028 ($ million)
- Exhibits86: Data Table on South America - Market size and forecast 2023-2028 ($ million)
- Exhibits87: Chart on South America - Year-over-year growth 2023-2028 (%)
- Exhibits88: Data Table on South America - Year-over-year growth 2023-2028 (%)
- Exhibits89: Chart on US - Market size and forecast 2023-2028 ($ million)
- Exhibits90: Data Table on US - Market size and forecast 2023-2028 ($ million)
- Exhibits91: Chart on US - Year-over-year growth 2023-2028 (%)
- Exhibits92: Data Table on US - Year-over-year growth 2023-2028 (%)
- Exhibits93: Chart on China - Market size and forecast 2023-2028 ($ million)
- Exhibits94: Data Table on China - Market size and forecast 2023-2028 ($ million)
- Exhibits95: Chart on China - Year-over-year growth 2023-2028 (%)
- Exhibits96: Data Table on China - Year-over-year growth 2023-2028 (%)
- Exhibits97: Chart on UK - Market size and forecast 2023-2028 ($ million)
- Exhibits98: Data Table on UK - Market size and forecast 2023-2028 ($ million)
- Exhibits99: Chart on UK - Year-over-year growth 2023-2028 (%)
- Exhibits100: Data Table on UK - Year-over-year growth 2023-2028 (%)
- Exhibits101: Chart on South Korea - Market size and forecast 2023-2028 ($ million)
- Exhibits102: Data Table on South Korea - Market size and forecast 2023-2028 ($ million)
- Exhibits103: Chart on South Korea - Year-over-year growth 2023-2028 (%)
- Exhibits104: Data Table on South Korea - Year-over-year growth 2023-2028 (%)
- Exhibits105: Chart on Japan - Market size and forecast 2023-2028 ($ million)
- Exhibits106: Data Table on Japan - Market size and forecast 2023-2028 ($ million)
- Exhibits107: Chart on Japan - Year-over-year growth 2023-2028 (%)
- Exhibits108: Data Table on Japan - Year-over-year growth 2023-2028 (%)
- Exhibits109: Market opportunity By Geographical Landscape ($ million)
- Exhibits110: Data Tables on Market opportunity By Geographical Landscape ($ million)
- Exhibits111: Impact of drivers and challenges in 2023 and 2028
- Exhibits112: Overview on criticality of inputs and factors of differentiation
- Exhibits113: Overview on factors of disruption
- Exhibits114: Impact of key risks on business
- Exhibits115: Companies covered
- Exhibits116: Matrix on companies position and classification
- Exhibits117: Airspan Networks Holdings Inc. - Overview
- Exhibits118: Airspan Networks Holdings Inc. - Product / Service
- Exhibits119: Airspan Networks Holdings Inc. - Key offerings
- Exhibits120: Altiostar - Overview
- Exhibits121: Altiostar - Product / Service
- Exhibits122: Altiostar - Key offerings
- Exhibits123: Analog Devices Inc. - Overview
- Exhibits124: Analog Devices Inc. - Business segments
- Exhibits125: Analog Devices Inc. - Key news
- Exhibits126: Analog Devices Inc. - Key offerings
- Exhibits127: Analog Devices Inc. - Segment focus
- Exhibits128: Cisco Systems Inc. - Overview
- Exhibits129: Cisco Systems Inc. - Business segments
- Exhibits130: Cisco Systems Inc. - Key news
- Exhibits131: Cisco Systems Inc. - Key offerings
- Exhibits132: Cisco Systems Inc. - Segment focus
- Exhibits133: Comba Telecom Systems Holdings Ltd. - Overview
- Exhibits134: Comba Telecom Systems Holdings Ltd. - Business segments
- Exhibits135: Comba Telecom Systems Holdings Ltd. - Key offerings
- Exhibits136: Comba Telecom Systems Holdings Ltd. - Segment focus
- Exhibits137: CommScope Holding Co. Inc. - Overview
- Exhibits138: CommScope Holding Co. Inc. - Business segments
- Exhibits139: CommScope Holding Co. Inc. - Key offerings
- Exhibits140: CommScope Holding Co. Inc. - Segment focus
- Exhibits141: Fujitsu Ltd. - Overview
- Exhibits142: Fujitsu Ltd. - Business segments
- Exhibits143: Fujitsu Ltd. - Key news
- Exhibits144: Fujitsu Ltd. - Key offerings
- Exhibits145: Fujitsu Ltd. - Segment focus
- Exhibits146: Huawei Investment and Holding Co. Ltd. - Overview
- Exhibits147: Huawei Investment and Holding Co. Ltd. - Product / Service
- Exhibits148: Huawei Investment and Holding Co. Ltd. - Key news
- Exhibits149: Huawei Investment and Holding Co. Ltd. - Key offerings
- Exhibits150: NEC Corp. - Overview
- Exhibits151: NEC Corp. - Business segments
- Exhibits152: NEC Corp. - Key news
- Exhibits153: NEC Corp. - Key offerings
- Exhibits154: NEC Corp. - Segment focus
- Exhibits155: Nokia Corp. - Overview
- Exhibits156: Nokia Corp. - Business segments
- Exhibits157: Nokia Corp. - Key offerings
- Exhibits158: Nokia Corp. - Segment focus
- Exhibits159: Qorvo Inc. - Overview
- Exhibits160: Qorvo Inc. - Business segments
- Exhibits161: Qorvo Inc. - Key news
- Exhibits162: Qorvo Inc. - Key offerings
- Exhibits163: Qorvo Inc. - Segment focus
- Exhibits164: Qualcomm Inc. - Overview
- Exhibits165: Qualcomm Inc. - Business segments
- Exhibits166: Qualcomm Inc. - Key news
- Exhibits167: Qualcomm Inc. - Key offerings
- Exhibits168: Qualcomm Inc. - Segment focus
- Exhibits169: Samsung Electronics Co. Ltd. - Overview
- Exhibits170: Samsung Electronics Co. Ltd. - Business segments
- Exhibits171: Samsung Electronics Co. Ltd. - Key news
- Exhibits172: Samsung Electronics Co. Ltd. - Key offerings
- Exhibits173: Samsung Electronics Co. Ltd. - Segment focus
- Exhibits174: Telefonaktiebolaget LM Ericsson - Overview
- Exhibits175: Telefonaktiebolaget LM Ericsson - Business segments
- Exhibits176: Telefonaktiebolaget LM Ericsson - Key news
- Exhibits177: Telefonaktiebolaget LM Ericsson - Key offerings
- Exhibits178: Telefonaktiebolaget LM Ericsson - Segment focus
- Exhibits179: ZTE Corp. - Overview
- Exhibits180: ZTE Corp. - Business segments
- Exhibits181: ZTE Corp. - Key offerings
- Exhibits182: ZTE Corp. - Segment focus
- Exhibits183: Inclusions checklist
- Exhibits184: Exclusions checklist
- Exhibits185: Currency conversion rates for US$
- Exhibits186: Research methodology
- Exhibits187: Information sources
- Exhibits188: Data validation
- Exhibits189: Validation techniques employed for market sizing
- Exhibits190: Data synthesis
- Exhibits191: 360 degree market analysis
- Exhibits192: List of abbreviations
The 5g equipment market is forecasted to grow by USD 146954.7 mn during 2023-2028, accelerating at a CAGR of 81.05% during the forecast period. The report on the 5g equipment market provides a holistic analysis, market size and forecast, trends, growth drivers, and challenges, as well as vendor analysis covering around 25 vendors.
The report offers an up-to-date analysis regarding the current market scenario, the latest trends and drivers, and the overall market environment. The market is driven by the adoption of 5g networks for smart cities, the growing adoption of smartphones and demand for better connectivity, and government initiatives for high-speed network connectivity.
Technavio's 5g equipment market is segmented as below:
| Market Scope | |
|---|---|
| Base Year | 2024 |
| End Year | 2028 |
| Series Year | 2024-2028 |
| Growth Momentum | Accelerate |
| YOY 2024 | 69.9% |
| CAGR | 81.05% |
| Incremental Value | $146954.7mn |
ByProduct
- Macrocell
- Small cell
- Others
ByEnd-user
- Non-retail sector
- Retail sector
ByGeography
- North America
- Europe
- APAC
- Middle East and Africa
- South America
This study identifies the growing R&D and deployment of the 5g network as one of the prime reasons driving the 5g equipment market growth during the next few years. Also, the growing number of pre-commercial 5g trials and strategic collaboration among market participants will lead to sizable demand in the market.
The report on the 5g equipment market covers the following areas:
- 5g equipment market sizing
- 5g equipment market forecast
- 5g equipment market industry analysis
The robust vendor analysis is designed to help clients improve their market position, and in line with this, this report provides a detailed analysis of several leading 5g equipment market vendors that include Airspan Networks Holdings Inc., Alpha Networks Inc., Altiostar, Analog Devices Inc., Cisco Systems Inc., Comba Telecom Systems Holdings Ltd., CommScope Holding Co. Inc., Fujitsu Ltd., Huawei Technologies Co., Ltd., Infinite Electronics Inc., Laird Connectivity, Mavenir Systems Inc., NEC Corp., Nokia Corp., Qorvo Inc., Qualcomm Inc., Samsung Electronics Co. Ltd., Telefonaktiebolaget LM Ericsson, Wireless Excellence Ltd., and ZTE Corp.. Also, the 5g equipment market analysis report includes information on upcoming trends and challenges that will influence market growth. This is to help companies strategize and leverage all forthcoming growth opportunities.
The study was conducted using an objective combination of primary and secondary information including inputs from key participants in the industry. The report contains a comprehensive market and vendor landscape in addition to an analysis of the key vendors.
The publisher presents a detailed picture of the market by way of study, synthesis, and summation of data from multiple sources through an analysis of key parameters such as profit, pricing, competition, and promotions. It presents various market facets by identifying the key industry influencers. The data presented is comprehensive, reliable, and a result of extensive research - both primary and secondary. The market research reports provide a complete competitive landscape and an in-depth vendor selection methodology and analysis using qualitative and quantitative research to forecast accurate market growth.
Table of Contents
1 Executive Summary
- 1.1 Market overview
- Executive Summary - Chart on Market Overview
- Executive Summary - Data Table on Market Overview
- Executive Summary - Chart on Global Market Characteristics
- Executive Summary - Chart on Market By Geographical Landscape
- Executive Summary - Chart on Market Segmentation by Product
- Executive Summary - Chart on Market Segmentation by End-user
- Executive Summary - Chart on Incremental Growth
- Executive Summary - Data Table on Incremental Growth
- Executive Summary - Chart on Company Market Positioning
2 Market Landscape
- 2.1 Market ecosystem
- Parent Market
- Data Table on - Parent Market
- 2.2 Market characteristics
- Market characteristics analysis
- 2.3 Value chain analysis
- Value Chain Analysis
3 Market Sizing
- 3.1 Market definition
- Offerings of companies included in the market definition
- 3.2 Market segment analysis
- Market segments
- 3.3 Market size 2023
- 3.4 Market outlook: Forecast for 2023-2028
- Chart on Global - Market size and forecast 2023-2028 ($ million)
- Data Table on Global - Market size and forecast 2023-2028 ($ million)
- Chart on Global Market: Year-over-year growth 2023-2028 (%)
- Data Table on Global Market: Year-over-year growth 2023-2028 (%)
4 Historic Market Size
- 4.1 Global 5G Equipment Market 2018 - 2022
- Historic Market Size - Data Table on Global 5G Equipment Market 2018 - 2022 ($ million)
- 4.2 Product segment analysis 2018 - 2022
- Historic Market Size - Product Segment 2018 - 2022 ($ million)
- 4.3 End-user segment analysis 2018 - 2022
- Historic Market Size - End-user Segment 2018 - 2022 ($ million)
- 4.4 Geography segment analysis 2018 - 2022
- Historic Market Size - Geography Segment 2018 - 2022 ($ million)
- 4.5 Country segment analysis 2018 - 2022
- Historic Market Size - Country Segment 2018 - 2022 ($ million)
5 Five Forces Analysis
- 5.1 Five forces summary
- Five forces analysis - Comparison between 2023 and 2028
- 5.2 Bargaining power of buyers
- Bargaining power of buyers - Impact of key factors 2023 and 2028
- 5.3 Bargaining power of suppliers
- Bargaining power of suppliers - Impact of key factors in 2023 and 2028
- 5.4 Threat of new entrants
- Threat of new entrants - Impact of key factors in 2023 and 2028
- 5.5 Threat of substitutes
- Threat of substitutes - Impact of key factors in 2023 and 2028
- 5.6 Threat of rivalry
- Threat of rivalry - Impact of key factors in 2023 and 2028
- 5.7 Market condition
- Chart on Market condition - Five forces 2023 and 2028
6 Market Segmentation by Product
- 6.1 Market segments
- Chart on Product - Market share 2023-2028 (%)
- Data Table on Product - Market share 2023-2028 (%)
- 6.2 Comparison by Product
- Chart on Comparison by Product
- Data Table on Comparison by Product
- 6.3 Macrocell - Market size and forecast 2023-2028
- Chart on Macrocell - Market size and forecast 2023-2028 ($ million)
- Data Table on Macrocell - Market size and forecast 2023-2028 ($ million)
- Chart on Macrocell - Year-over-year growth 2023-2028 (%)
- Data Table on Macrocell - Year-over-year growth 2023-2028 (%)
- 6.4 Small cell - Market size and forecast 2023-2028
- Chart on Small cell - Market size and forecast 2023-2028 ($ million)
- Data Table on Small cell - Market size and forecast 2023-2028 ($ million)
- Chart on Small cell - Year-over-year growth 2023-2028 (%)
- Data Table on Small cell - Year-over-year growth 2023-2028 (%)
- 6.5 Others - Market size and forecast 2023-2028
- Chart on Others - Market size and forecast 2023-2028 ($ million)
- Data Table on Others - Market size and forecast 2023-2028 ($ million)
- Chart on Others - Year-over-year growth 2023-2028 (%)
- Data Table on Others - Year-over-year growth 2023-2028 (%)
- 6.6 Market opportunity by Product
- Market opportunity by Product ($ million)
- Data Table on Market opportunity by Product ($ million)
7 Market Segmentation by End-user
- 7.1 Market segments
- Chart on End-user - Market share 2023-2028 (%)
- Data Table on End-user - Market share 2023-2028 (%)
- 7.2 Comparison by End-user
- Chart on Comparison by End-user
- Data Table on Comparison by End-user
- 7.3 Non-retail sector - Market size and forecast 2023-2028
- Chart on Non-retail sector - Market size and forecast 2023-2028 ($ million)
- Data Table on Non-retail sector - Market size and forecast 2023-2028 ($ million)
- Chart on Non-retail sector - Year-over-year growth 2023-2028 (%)
- Data Table on Non-retail sector - Year-over-year growth 2023-2028 (%)
- 7.4 Retail sector - Market size and forecast 2023-2028
- Chart on Retail sector - Market size and forecast 2023-2028 ($ million)
- Data Table on Retail sector - Market size and forecast 2023-2028 ($ million)
- Chart on Retail sector - Year-over-year growth 2023-2028 (%)
- Data Table on Retail sector - Year-over-year growth 2023-2028 (%)
- 7.5 Market opportunity by End-user
- Market opportunity by End-user ($ million)
- Data Table on Market opportunity by End-user ($ million)
8 Customer Landscape
- 8.1 Customer landscape overview
- Analysis of price sensitivity, lifecycle, customer purchase basket, adoption rates, and purchase criteria
9 Geographic Landscape
- 9.1 Geographic segmentation
- Chart on Market share By Geographical Landscape 2023-2028 (%)
- Data Table on Market share By Geographical Landscape 2023-2028 (%)
- 9.2 Geographic comparison
- Chart on Geographic comparison
- Data Table on Geographic comparison
- 9.3 North America - Market size and forecast 2023-2028
- Chart on North America - Market size and forecast 2023-2028 ($ million)
- Data Table on North America - Market size and forecast 2023-2028 ($ million)
- Chart on North America - Year-over-year growth 2023-2028 (%)
- Data Table on North America - Year-over-year growth 2023-2028 (%)
- 9.4 Europe - Market size and forecast 2023-2028
- Chart on Europe - Market size and forecast 2023-2028 ($ million)
- Data Table on Europe - Market size and forecast 2023-2028 ($ million)
- Chart on Europe - Year-over-year growth 2023-2028 (%)
- Data Table on Europe - Year-over-year growth 2023-2028 (%)
- 9.5 APAC - Market size and forecast 2023-2028
- Chart on APAC - Market size and forecast 2023-2028 ($ million)
- Data Table on APAC - Market size and forecast 2023-2028 ($ million)
- Chart on APAC - Year-over-year growth 2023-2028 (%)
- Data Table on APAC - Year-over-year growth 2023-2028 (%)
- 9.6 Middle East and Africa - Market size and forecast 2023-2028
- Chart on Middle East and Africa - Market size and forecast 2023-2028 ($ million)
- Data Table on Middle East and Africa - Market size and forecast 2023-2028 ($ million)
- Chart on Middle East and Africa - Year-over-year growth 2023-2028 (%)
- Data Table on Middle East and Africa - Year-over-year growth 2023-2028 (%)
- 9.7 South America - Market size and forecast 2023-2028
- Chart on South America - Market size and forecast 2023-2028 ($ million)
- Data Table on South America - Market size and forecast 2023-2028 ($ million)
- Chart on South America - Year-over-year growth 2023-2028 (%)
- Data Table on South America - Year-over-year growth 2023-2028 (%)
- 9.8 US - Market size and forecast 2023-2028
- Chart on US - Market size and forecast 2023-2028 ($ million)
- Data Table on US - Market size and forecast 2023-2028 ($ million)
- Chart on US - Year-over-year growth 2023-2028 (%)
- Data Table on US - Year-over-year growth 2023-2028 (%)
- 9.9 China - Market size and forecast 2023-2028
- Chart on China - Market size and forecast 2023-2028 ($ million)
- Data Table on China - Market size and forecast 2023-2028 ($ million)
- Chart on China - Year-over-year growth 2023-2028 (%)
- Data Table on China - Year-over-year growth 2023-2028 (%)
- 9.10 UK - Market size and forecast 2023-2028
- Chart on UK - Market size and forecast 2023-2028 ($ million)
- Data Table on UK - Market size and forecast 2023-2028 ($ million)
- Chart on UK - Year-over-year growth 2023-2028 (%)
- Data Table on UK - Year-over-year growth 2023-2028 (%)
- 9.11 South Korea - Market size and forecast 2023-2028
- Chart on South Korea - Market size and forecast 2023-2028 ($ million)
- Data Table on South Korea - Market size and forecast 2023-2028 ($ million)
- Chart on South Korea - Year-over-year growth 2023-2028 (%)
- Data Table on South Korea - Year-over-year growth 2023-2028 (%)
- 9.12 Japan - Market size and forecast 2023-2028
- Chart on Japan - Market size and forecast 2023-2028 ($ million)
- Data Table on Japan - Market size and forecast 2023-2028 ($ million)
- Chart on Japan - Year-over-year growth 2023-2028 (%)
- Data Table on Japan - Year-over-year growth 2023-2028 (%)
- 9.13 Market opportunity By Geographical Landscape
- Market opportunity By Geographical Landscape ($ million)
- Data Tables on Market opportunity By Geographical Landscape ($ million)
10 Drivers, Challenges, and Opportunity/Restraints
- 10.1 Market drivers
- 10.2 Market challenges
- 10.3 Impact of drivers and challenges
- Impact of drivers and challenges in 2023 and 2028
- 10.4 Market opportunities/restraints
11 Competitive Landscape
- 11.1 Overview
- 11.2 Competitive Landscape
- Overview on criticality of inputs and factors of differentiation
- 11.3 Landscape disruption
- Overview on factors of disruption
- 11.4 Industry risks
- Impact of key risks on business
12 Competitive Analysis
- 12.1 Companies profiled
- Companies covered
- 12.2 Market positioning of companies
- Matrix on companies position and classification
- 12.3 Airspan Networks Holdings Inc.
- Airspan Networks Holdings Inc. - Overview
- Airspan Networks Holdings Inc. - Product / Service
- Airspan Networks Holdings Inc. - Key offerings
- 12.4 Altiostar
- Altiostar - Overview
- Altiostar - Product / Service
- Altiostar - Key offerings
- 12.5 Analog Devices Inc.
- Analog Devices Inc. - Overview
- Analog Devices Inc. - Business segments
- Analog Devices Inc. - Key news
- Analog Devices Inc. - Key offerings
- Analog Devices Inc. - Segment focus
- 12.6 Cisco Systems Inc.
- Cisco Systems Inc. - Overview
- Cisco Systems Inc. - Business segments
- Cisco Systems Inc. - Key news
- Cisco Systems Inc. - Key offerings
- Cisco Systems Inc. - Segment focus
- 12.7 Comba Telecom Systems Holdings Ltd.
- Comba Telecom Systems Holdings Ltd. - Overview
- Comba Telecom Systems Holdings Ltd. - Business segments
- Comba Telecom Systems Holdings Ltd. - Key offerings
- Comba Telecom Systems Holdings Ltd. - Segment focus
- 12.8 CommScope Holding Co. Inc.
- CommScope Holding Co. Inc. - Overview
- CommScope Holding Co. Inc. - Business segments
- CommScope Holding Co. Inc. - Key offerings
- CommScope Holding Co. Inc. - Segment focus
- 12.9 Fujitsu Ltd.
- Fujitsu Ltd. - Overview
- Fujitsu Ltd. - Business segments
- Fujitsu Ltd. - Key news
- Fujitsu Ltd. - Key offerings
- Fujitsu Ltd. - Segment focus
- 12.10 Huawei Investment and Holding Co. Ltd.
- Huawei Investment and Holding Co. Ltd. - Overview
- Huawei Investment and Holding Co. Ltd. - Product / Service
- Huawei Investment and Holding Co. Ltd. - Key news
- Huawei Investment and Holding Co. Ltd. - Key offerings
- 12.11 NEC Corp.
- NEC Corp. - Overview
- NEC Corp. - Business segments
- NEC Corp. - Key news
- NEC Corp. - Key offerings
- NEC Corp. - Segment focus
- 12.12 Nokia Corp.
- Nokia Corp. - Overview
- Nokia Corp. - Business segments
- Nokia Corp. - Key offerings
- Nokia Corp. - Segment focus
- 12.13 Qorvo Inc.
- Qorvo Inc. - Overview
- Qorvo Inc. - Business segments
- Qorvo Inc. - Key news
- Qorvo Inc. - Key offerings
- Qorvo Inc. - Segment focus
- 12.14 Qualcomm Inc.
- Qualcomm Inc. - Overview
- Qualcomm Inc. - Business segments
- Qualcomm Inc. - Key news
- Qualcomm Inc. - Key offerings
- Qualcomm Inc. - Segment focus
- 12.15 Samsung Electronics Co. Ltd.
- Samsung Electronics Co. Ltd. - Overview
- Samsung Electronics Co. Ltd. - Business segments
- Samsung Electronics Co. Ltd. - Key news
- Samsung Electronics Co. Ltd. - Key offerings
- Samsung Electronics Co. Ltd. - Segment focus
- 12.16 Telefonaktiebolaget LM Ericsson
- Telefonaktiebolaget LM Ericsson - Overview
- Telefonaktiebolaget LM Ericsson - Business segments
- Telefonaktiebolaget LM Ericsson - Key news
- Telefonaktiebolaget LM Ericsson - Key offerings
- Telefonaktiebolaget LM Ericsson - Segment focus
- 12.17 ZTE Corp.
- ZTE Corp. - Overview
- ZTE Corp. - Business segments
- ZTE Corp. - Key offerings
- ZTE Corp. - Segment focus
13 Appendix
- 13.1 Scope of the report
- 13.2 Inclusions and exclusions checklist
- Inclusions checklist
- Exclusions checklist
- 13.3 Currency conversion rates for US$
- Currency conversion rates for US$
- 13.4 Research methodology
- Research methodology
- 13.5 Data procurement
- Information sources
- 13.6 Data validation
- Data validation
- 13.7 Validation techniques employed for market sizing
- Validation techniques employed for market sizing
- 13.8 Data synthesis
- Data synthesis
- 13.9 360 degree market analysis
- 360 degree market analysis
- 13.10 List of abbreviations
- List of abbreviations

