|
|
市場調査レポート
商品コード
1502495
デジタル出荷の世界市場 2024-2028Global digital shipment market 2024-2028 |
||||||

|
|||||||
カスタマイズ可能
|
|||||||


| デジタル出荷の世界市場 2024-2028 |
|
出版日: 2024年05月21日
発行: TechNavio
ページ情報: 英文 166 Pages
納期: 即納可能
|

全表示
- 概要
- 図表
- 目次
Technavio社は、デジタル出荷市場を調査し、2023年から2028年にかけて941億7,170万米ドル、予測期間中のCAGR 29.17%で成長すると予測しています。
当レポートでは、デジタル出荷市場の全体的な分析、市場規模・予測、動向、成長促進要因、課題、約25のベンダーを網羅したベンダー分析などを掲載しています。
現在の市場シナリオ、最新動向と促進要因、市場環境全体に関する最新分析を提供しています。市場は、より迅速で合理化されたサービスに対する顧客需要の増加、新技術の登場、デジタル化を採用する企業の増加によって牽引されています。
| 市場範囲 | |
|---|---|
| 基準年 | 2024 |
| 終了年 | 2028 |
| 予測期間 | 2024-2028 |
| 成長モメンタム | 加速 |
| 前年比2024年 | 22.16% |
| CAGR | 29.17% |
| 増分額 | 941億7,170万米ドル |
本調査では、サプライチェーンの世界化が今後数年間のデジタル出荷市場成長を牽引する主要因の1つであると指摘しています。また、インダストリー4.0統合やeコマースの急成長も市場の大きな需要につながります。
目次
第1章 エグゼクティブサマリー
- 市場概要
第2章 市場情勢
- 市場エコシステム
- 市場の特徴
- バリューチェーン分析
第3章 市場規模の評価
- 市場の定義
- 市場セグメント分析
- 市場規模 2023
- 市場の見通し 2023-2028
第4章 市場規模実績
- 世界デジタル出荷市場 2018-2022
- タイプ別セグメント分析 2018-2022
- 展開別セグメント分析 2018-2022
- 地域別セグメント分析 2018-2022
- 国別セグメント分析 2018-2022
第5章 ファイブフォース分析
- ファイブフォースの要約
- 買い手の交渉力
- 供給企業の交渉力
- 新規参入業者の脅威
- 代替品の脅威
- 競争の脅威
- 市況
第6章 市場セグメンテーション:タイプ別
- 市場セグメンテーション
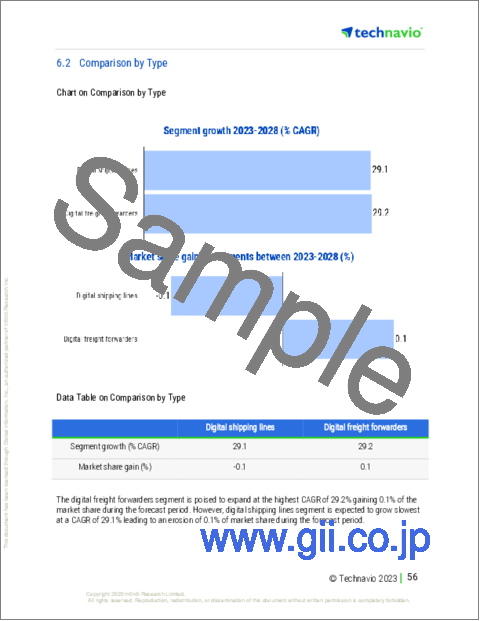
- 比較:タイプ別
- デジタル海運会社:市場規模と予測 2023-2028
- デジタル貨物運送業者:市場規模と予測 2023-2028
- 市場機会:タイプ別
第7章 市場セグメンテーション:展開別
- 市場セグメンテーション
- 比較:展開別
- クラウド:市場規模と予測 2023-2028
- オンプレミス:市場規模と予測 2023-2028
- 市場機会:展開別
第8章 顧客情勢
- 顧客情勢の概要
第9章 地域別情勢
- 地域別セグメンテーション
- 地域別比較
- アジア太平洋:市場規模と予測 2023-2028
- 北米:市場規模と予測 2023-2028
- 欧州:市場規模と予測 2023-2028
- 中東・アフリカ:市場規模と予測 2023-2028
- 南米:市場規模と予測 2023-2028
- 中国:市場規模と予測 2023-2028
- 米国:市場規模と予測 2023-2028
- 日本:市場規模と予測 2023-2028
- ドイツ:市場規模と予測 2023-2028
- 韓国:市場規模と予測 2023-2028
- 市場機会:地域情勢別
第10章 促進要因・課題・機会・抑制要因
- 市場促進要因
- 市場の課題
- 促進要因と課題の影響
- 市場の機会・抑制要因
第11章 競合情勢
- 概要
- 競合情勢
- 混乱の状況
- 業界のリスク
第12章 競合分析
- 企業プロファイル
- 企業の市場ポジショニング
- AP Moller Maersk AS
- Boxnbiz Technologies Pvt. Ltd.
- CMA CGM Group
- COSCO Shipping International Co. Ltd.
- Deutsche Post AG
- Evergreen Marine Corp. Taiwan Ltd.
- FedEx Corp.
- Flexport Inc.
- Forto GmbH
- Hapag Lloyd AG
- HMM Europe Ltd.
- MSC Mediterranean Shipping Co. SA
- Ocean Network Express Pte. Ltd.
- Yang Ming Marine Transport Corp.
- ZIM Integrated Shipping Services Ltd.
第13章 付録
Exhibits:
- Exhibits1: Executive Summary - Chart on Market Overview
- Exhibits2: Executive Summary - Data Table on Market Overview
- Exhibits3: Executive Summary - Chart on Global Market Characteristics
- Exhibits4: Executive Summary - Chart on Market By Geographical Landscape
- Exhibits5: Executive Summary - Chart on Market Segmentation by Type
- Exhibits6: Executive Summary - Chart on Market Segmentation by Deployment
- Exhibits7: Executive Summary - Chart on Incremental Growth
- Exhibits8: Executive Summary - Data Table on Incremental Growth
- Exhibits9: Executive Summary - Chart on Company Market Positioning
- Exhibits10: Parent Market
- Exhibits11: Data Table on - Parent Market
- Exhibits12: Market characteristics analysis
- Exhibits13: Value Chain Analysis
- Exhibits14: Offerings of companies included in the market definition
- Exhibits15: Market segments
- Exhibits16: Chart on Global - Market size and forecast 2023-2028 ($ million)
- Exhibits17: Data Table on Global - Market size and forecast 2023-2028 ($ million)
- Exhibits18: Chart on Global Market: Year-over-year growth 2023-2028 (%)
- Exhibits19: Data Table on Global Market: Year-over-year growth 2023-2028 (%)
- Exhibits20: Historic Market Size - Data Table on Global Digital Shipment Market 2018 - 2022 ($ million)
- Exhibits21: Historic Market Size - Type Segment 2018 - 2022 ($ million)
- Exhibits22: Historic Market Size - Deployment Segment 2018 - 2022 ($ million)
- Exhibits23: Historic Market Size - Geography Segment 2018 - 2022 ($ million)
- Exhibits24: Historic Market Size - Country Segment 2018 - 2022 ($ million)
- Exhibits25: Five forces analysis - Comparison between 2023 and 2028
- Exhibits26: Bargaining power of buyers - Impact of key factors 2023 and 2028
- Exhibits27: Bargaining power of suppliers - Impact of key factors in 2023 and 2028
- Exhibits28: Threat of new entrants - Impact of key factors in 2023 and 2028
- Exhibits29: Threat of substitutes - Impact of key factors in 2023 and 2028
- Exhibits30: Threat of rivalry - Impact of key factors in 2023 and 2028
- Exhibits31: Chart on Market condition - Five forces 2023 and 2028
- Exhibits32: Chart on Type - Market share 2023-2028 (%)
- Exhibits33: Data Table on Type - Market share 2023-2028 (%)
- Exhibits34: Chart on Comparison by Type
- Exhibits35: Data Table on Comparison by Type
- Exhibits36: Chart on Digital shipping lines - Market size and forecast 2023-2028 ($ million)
- Exhibits37: Data Table on Digital shipping lines - Market size and forecast 2023-2028 ($ million)
- Exhibits38: Chart on Digital shipping lines - Year-over-year growth 2023-2028 (%)
- Exhibits39: Data Table on Digital shipping lines - Year-over-year growth 2023-2028 (%)
- Exhibits40: Chart on Digital freight forwarders - Market size and forecast 2023-2028 ($ million)
- Exhibits41: Data Table on Digital freight forwarders - Market size and forecast 2023-2028 ($ million)
- Exhibits42: Chart on Digital freight forwarders - Year-over-year growth 2023-2028 (%)
- Exhibits43: Data Table on Digital freight forwarders - Year-over-year growth 2023-2028 (%)
- Exhibits44: Market opportunity by Type ($ million)
- Exhibits45: Data Table on Market opportunity by Type ($ million)
- Exhibits46: Chart on Deployment - Market share 2023-2028 (%)
- Exhibits47: Data Table on Deployment - Market share 2023-2028 (%)
- Exhibits48: Chart on Comparison by Deployment
- Exhibits49: Data Table on Comparison by Deployment
- Exhibits50: Chart on Cloud - Market size and forecast 2023-2028 ($ million)
- Exhibits51: Data Table on Cloud - Market size and forecast 2023-2028 ($ million)
- Exhibits52: Chart on Cloud - Year-over-year growth 2023-2028 (%)
- Exhibits53: Data Table on Cloud - Year-over-year growth 2023-2028 (%)
- Exhibits54: Chart on On-premises - Market size and forecast 2023-2028 ($ million)
- Exhibits55: Data Table on On-premises - Market size and forecast 2023-2028 ($ million)
- Exhibits56: Chart on On-premises - Year-over-year growth 2023-2028 (%)
- Exhibits57: Data Table on On-premises - Year-over-year growth 2023-2028 (%)
- Exhibits58: Market opportunity by Deployment ($ million)
- Exhibits59: Data Table on Market opportunity by Deployment ($ million)
- Exhibits60: Analysis of price sensitivity, lifecycle, customer purchase basket, adoption rates, and purchase criteria
- Exhibits61: Chart on Market share By Geographical Landscape 2023-2028 (%)
- Exhibits62: Data Table on Market share By Geographical Landscape 2023-2028 (%)
- Exhibits63: Chart on Geographic comparison
- Exhibits64: Data Table on Geographic comparison
- Exhibits65: Chart on APAC - Market size and forecast 2023-2028 ($ million)
- Exhibits66: Data Table on APAC - Market size and forecast 2023-2028 ($ million)
- Exhibits67: Chart on APAC - Year-over-year growth 2023-2028 (%)
- Exhibits68: Data Table on APAC - Year-over-year growth 2023-2028 (%)
- Exhibits69: Chart on North America - Market size and forecast 2023-2028 ($ million)
- Exhibits70: Data Table on North America - Market size and forecast 2023-2028 ($ million)
- Exhibits71: Chart on North America - Year-over-year growth 2023-2028 (%)
- Exhibits72: Data Table on North America - Year-over-year growth 2023-2028 (%)
- Exhibits73: Chart on Europe - Market size and forecast 2023-2028 ($ million)
- Exhibits74: Data Table on Europe - Market size and forecast 2023-2028 ($ million)
- Exhibits75: Chart on Europe - Year-over-year growth 2023-2028 (%)
- Exhibits76: Data Table on Europe - Year-over-year growth 2023-2028 (%)
- Exhibits77: Chart on Middle East and Africa - Market size and forecast 2023-2028 ($ million)
- Exhibits78: Data Table on Middle East and Africa - Market size and forecast 2023-2028 ($ million)
- Exhibits79: Chart on Middle East and Africa - Year-over-year growth 2023-2028 (%)
- Exhibits80: Data Table on Middle East and Africa - Year-over-year growth 2023-2028 (%)
- Exhibits81: Chart on South America - Market size and forecast 2023-2028 ($ million)
- Exhibits82: Data Table on South America - Market size and forecast 2023-2028 ($ million)
- Exhibits83: Chart on South America - Year-over-year growth 2023-2028 (%)
- Exhibits84: Data Table on South America - Year-over-year growth 2023-2028 (%)
- Exhibits85: Chart on China - Market size and forecast 2023-2028 ($ million)
- Exhibits86: Data Table on China - Market size and forecast 2023-2028 ($ million)
- Exhibits87: Chart on China - Year-over-year growth 2023-2028 (%)
- Exhibits88: Data Table on China - Year-over-year growth 2023-2028 (%)
- Exhibits89: Chart on US - Market size and forecast 2023-2028 ($ million)
- Exhibits90: Data Table on US - Market size and forecast 2023-2028 ($ million)
- Exhibits91: Chart on US - Year-over-year growth 2023-2028 (%)
- Exhibits92: Data Table on US - Year-over-year growth 2023-2028 (%)
- Exhibits93: Chart on Japan - Market size and forecast 2023-2028 ($ million)
- Exhibits94: Data Table on Japan - Market size and forecast 2023-2028 ($ million)
- Exhibits95: Chart on Japan - Year-over-year growth 2023-2028 (%)
- Exhibits96: Data Table on Japan - Year-over-year growth 2023-2028 (%)
- Exhibits97: Chart on Germany - Market size and forecast 2023-2028 ($ million)
- Exhibits98: Data Table on Germany - Market size and forecast 2023-2028 ($ million)
- Exhibits99: Chart on Germany - Year-over-year growth 2023-2028 (%)
- Exhibits100: Data Table on Germany - Year-over-year growth 2023-2028 (%)
- Exhibits101: Chart on South Korea - Market size and forecast 2023-2028 ($ million)
- Exhibits102: Data Table on South Korea - Market size and forecast 2023-2028 ($ million)
- Exhibits103: Chart on South Korea - Year-over-year growth 2023-2028 (%)
- Exhibits104: Data Table on South Korea - Year-over-year growth 2023-2028 (%)
- Exhibits105: Market opportunity By Geographical Landscape ($ million)
- Exhibits106: Data Tables on Market opportunity By Geographical Landscape ($ million)
- Exhibits107: Impact of drivers and challenges in 2023 and 2028
- Exhibits108: Overview on criticality of inputs and factors of differentiation
- Exhibits109: Overview on factors of disruption
- Exhibits110: Impact of key risks on business
- Exhibits111: Companies covered
- Exhibits112: Matrix on companies position and classification
- Exhibits113: AP Moller Maersk AS - Overview
- Exhibits114: AP Moller Maersk AS - Business segments
- Exhibits115: AP Moller Maersk AS - Key news
- Exhibits116: AP Moller Maersk AS - Key offerings
- Exhibits117: AP Moller Maersk AS - Segment focus
- Exhibits118: Boxnbiz Technologies Pvt. Ltd. - Overview
- Exhibits119: Boxnbiz Technologies Pvt. Ltd. - Product / Service
- Exhibits120: Boxnbiz Technologies Pvt. Ltd. - Key offerings
- Exhibits121: CMA CGM Group - Overview
- Exhibits122: CMA CGM Group - Product / Service
- Exhibits123: CMA CGM Group - Key news
- Exhibits124: CMA CGM Group - Key offerings
- Exhibits125: COSCO Shipping International Co. Ltd. - Overview
- Exhibits126: COSCO Shipping International Co. Ltd. - Business segments
- Exhibits127: COSCO Shipping International Co. Ltd. - Key offerings
- Exhibits128: COSCO Shipping International Co. Ltd. - Segment focus
- Exhibits129: Deutsche Post AG - Overview
- Exhibits130: Deutsche Post AG - Product / Service
- Exhibits131: Deutsche Post AG - Key news
- Exhibits132: Deutsche Post AG - Key offerings
- Exhibits133: Evergreen Marine Corp. Taiwan Ltd. - Overview
- Exhibits134: Evergreen Marine Corp. Taiwan Ltd. - Business segments
- Exhibits135: Evergreen Marine Corp. Taiwan Ltd. - Key offerings
- Exhibits136: Evergreen Marine Corp. Taiwan Ltd. - Segment focus
- Exhibits137: FedEx Corp. - Overview
- Exhibits138: FedEx Corp. - Business segments
- Exhibits139: FedEx Corp. - Key offerings
- Exhibits140: FedEx Corp. - Segment focus
- Exhibits141: Flexport Inc. - Overview
- Exhibits142: Flexport Inc. - Product / Service
- Exhibits143: Flexport Inc. - Key offerings
- Exhibits144: Forto GmbH - Overview
- Exhibits145: Forto GmbH - Product / Service
- Exhibits146: Forto GmbH - Key offerings
- Exhibits147: Hapag Lloyd AG - Overview
- Exhibits148: Hapag Lloyd AG - Product / Service
- Exhibits149: Hapag Lloyd AG - Key news
- Exhibits150: Hapag Lloyd AG - Key offerings
- Exhibits151: HMM Europe Ltd. - Overview
- Exhibits152: HMM Europe Ltd. - Product / Service
- Exhibits153: HMM Europe Ltd. - Key offerings
- Exhibits154: MSC Mediterranean Shipping Co. SA - Overview
- Exhibits155: MSC Mediterranean Shipping Co. SA - Product / Service
- Exhibits156: MSC Mediterranean Shipping Co. SA - Key offerings
- Exhibits157: Ocean Network Express Pte. Ltd. - Overview
- Exhibits158: Ocean Network Express Pte. Ltd. - Product / Service
- Exhibits159: Ocean Network Express Pte. Ltd. - Key offerings
- Exhibits160: Yang Ming Marine Transport Corp. - Overview
- Exhibits161: Yang Ming Marine Transport Corp. - Product / Service
- Exhibits162: Yang Ming Marine Transport Corp. - Key offerings
- Exhibits163: ZIM Integrated Shipping Services Ltd. - Overview
- Exhibits164: ZIM Integrated Shipping Services Ltd. - Product / Service
- Exhibits165: ZIM Integrated Shipping Services Ltd. - Key offerings
- Exhibits166: Inclusions checklist
- Exhibits167: Exclusions checklist
- Exhibits168: Currency conversion rates for US$
- Exhibits169: Research methodology
- Exhibits170: Information sources
- Exhibits171: Data validation
- Exhibits172: Validation techniques employed for market sizing
- Exhibits173: Data synthesis
- Exhibits174: 360 degree market analysis
- Exhibits175: List of abbreviations
Technavio has been monitoring the digital shipment market and is forecast to grow by $ 94171.7 mn during 2023-2028, accelerating at a CAGR of 29.17% during the forecast period. Our report on the digital shipment market provides a holistic analysis, market size and forecast, trends, growth drivers, and challenges, as well as vendor analysis covering around 25 vendors.
The report offers an up-to-date analysis regarding the current market scenario, the latest trends and drivers, and the overall market environment. The market is driven by increasing customer demand for faster and more streamlined services, advent of new technologies, and increasing number of companies embracing digitalization.
Technavio's digital shipment market is segmented as below:
| Market Scope | |
|---|---|
| Base Year | 2024 |
| End Year | 2028 |
| Series Year | 2024-2028 |
| Growth Momentum | Accelerate |
| YOY 2024 | 22.16% |
| CAGR | 29.17% |
| Incremental Value | $94171.7mn |
By Type
- Digital shipping lines
- Digital freight forwarders
By Deployment
- Cloud
- On-premises
By Geographical Landscape
- APAC
- North America
- Europe
- Middle East and Africa
- South America
This study identifies the globalization in the supply chain as one of the prime reasons driving the digital shipment market growth during the next few years. Also, industry 4.0 integration and rapid growth of e-commerce will lead to sizable demand in the market.
Technavio presents a detailed picture of the market by the way of study, synthesis, and summation of data from multiple sources by an analysis of key parameters. Our report on the digital shipment market covers the following areas:
- Digital shipment market sizing
- Digital shipment market forecast
- Digital shipment market industry analysis
Technavio's robust vendor analysis is designed to help clients improve their market position, and in line with this, this report provides a detailed analysis of several leading digital shipment market vendors that include AP Moller Maersk AS, Boxnbiz Technologies Pvt. Ltd., CMA CGM Group, COSCO Shipping International Co. Ltd., Descartes Systems Group Inc., Deutsche Post AG, Evergreen Marine Corp. Taiwan Ltd., FedEx Corp., Flexport Inc., Forto GmbH, Hapag Lloyd AG, HMM Europe Ltd., Kuehne Nagel Management AG, MSC Mediterranean Shipping Co. SA, Ocean Network Express Pte. Ltd., Pacific International Lines Pte. Ltd., TRAXENS, Yang Ming Marine Transport Corp., Zencargo, and ZIM Integrated Shipping Services Ltd.. Also, the digital shipment market analysis report includes information on upcoming trends and challenges that will influence market growth. This is to help companies strategize and leverage all forthcoming growth opportunities.
The study was conducted using an objective combination of primary and secondary information including inputs from key participants in the industry. The report contains a comprehensive market and vendor landscape in addition to an analysis of the key vendors.
Technavio presents a detailed picture of the market by the way of study, synthesis, and summation of data from multiple sources by an analysis of key parameters such as profit, pricing, competition, and promotions. It presents various market facets by identifying the key industry influencers. The data presented is comprehensive, reliable, and a result of extensive research - both primary and secondary. Technavio's market research reports provide a complete competitive landscape and an in-depth vendor selection methodology and analysis using qualitative and quantitative research to forecast accurate market growth.
Table of Contents
1 Executive Summary
- 1.1 Market overview
- Executive Summary - Chart on Market Overview
- Executive Summary - Data Table on Market Overview
- Executive Summary - Chart on Global Market Characteristics
- Executive Summary - Chart on Market By Geographical Landscape
- Executive Summary - Chart on Market Segmentation by Type
- Executive Summary - Chart on Market Segmentation by Deployment
- Executive Summary - Chart on Incremental Growth
- Executive Summary - Data Table on Incremental Growth
- Executive Summary - Chart on Company Market Positioning
2 Market Landscape
- 2.1 Market ecosystem
- Parent Market
- Data Table on - Parent Market
- 2.2 Market characteristics
- Market characteristics analysis
- 2.3 Value chain analysis
- Value Chain Analysis
3 Market Sizing
- 3.1 Market definition
- Offerings of companies included in the market definition
- 3.2 Market segment analysis
- Market segments
- 3.3 Market size 2023
- 3.4 Market outlook: Forecast for 2023-2028
- Chart on Global - Market size and forecast 2023-2028 ($ million)
- Data Table on Global - Market size and forecast 2023-2028 ($ million)
- Chart on Global Market: Year-over-year growth 2023-2028 (%)
- Data Table on Global Market: Year-over-year growth 2023-2028 (%)
4 Historic Market Size
- 4.1 Global Digital Shipment Market 2018 - 2022
- Historic Market Size - Data Table on Global Digital Shipment Market 2018 - 2022 ($ million)
- 4.2 Type segment analysis 2018 - 2022
- Historic Market Size - Type Segment 2018 - 2022 ($ million)
- 4.3 Deployment segment analysis 2018 - 2022
- Historic Market Size - Deployment Segment 2018 - 2022 ($ million)
- 4.4 Geography segment analysis 2018 - 2022
- Historic Market Size - Geography Segment 2018 - 2022 ($ million)
- 4.5 Country segment analysis 2018 - 2022
- Historic Market Size - Country Segment 2018 - 2022 ($ million)
5 Five Forces Analysis
- 5.1 Five forces summary
- Five forces analysis - Comparison between 2023 and 2028
- 5.2 Bargaining power of buyers
- Bargaining power of buyers - Impact of key factors 2023 and 2028
- 5.3 Bargaining power of suppliers
- Bargaining power of suppliers - Impact of key factors in 2023 and 2028
- 5.4 Threat of new entrants
- Threat of new entrants - Impact of key factors in 2023 and 2028
- 5.5 Threat of substitutes
- Threat of substitutes - Impact of key factors in 2023 and 2028
- 5.6 Threat of rivalry
- Threat of rivalry - Impact of key factors in 2023 and 2028
- 5.7 Market condition
- Chart on Market condition - Five forces 2023 and 2028
6 Market Segmentation by Type
- 6.1 Market segments
- Chart on Type - Market share 2023-2028 (%)
- Data Table on Type - Market share 2023-2028 (%)
- 6.2 Comparison by Type
- Chart on Comparison by Type
- Data Table on Comparison by Type
- 6.3 Digital shipping lines - Market size and forecast 2023-2028
- Chart on Digital shipping lines - Market size and forecast 2023-2028 ($ million)
- Data Table on Digital shipping lines - Market size and forecast 2023-2028 ($ million)
- Chart on Digital shipping lines - Year-over-year growth 2023-2028 (%)
- Data Table on Digital shipping lines - Year-over-year growth 2023-2028 (%)
- 6.4 Digital freight forwarders - Market size and forecast 2023-2028
- Chart on Digital freight forwarders - Market size and forecast 2023-2028 ($ million)
- Data Table on Digital freight forwarders - Market size and forecast 2023-2028 ($ million)
- Chart on Digital freight forwarders - Year-over-year growth 2023-2028 (%)
- Data Table on Digital freight forwarders - Year-over-year growth 2023-2028 (%)
- 6.5 Market opportunity by Type
- Market opportunity by Type ($ million)
- Data Table on Market opportunity by Type ($ million)
7 Market Segmentation by Deployment
- 7.1 Market segments
- Chart on Deployment - Market share 2023-2028 (%)
- Data Table on Deployment - Market share 2023-2028 (%)
- 7.2 Comparison by Deployment
- Chart on Comparison by Deployment
- Data Table on Comparison by Deployment
- 7.3 Cloud - Market size and forecast 2023-2028
- Chart on Cloud - Market size and forecast 2023-2028 ($ million)
- Data Table on Cloud - Market size and forecast 2023-2028 ($ million)
- Chart on Cloud - Year-over-year growth 2023-2028 (%)
- Data Table on Cloud - Year-over-year growth 2023-2028 (%)
- 7.4 On-premises - Market size and forecast 2023-2028
- Chart on On-premises - Market size and forecast 2023-2028 ($ million)
- Data Table on On-premises - Market size and forecast 2023-2028 ($ million)
- Chart on On-premises - Year-over-year growth 2023-2028 (%)
- Data Table on On-premises - Year-over-year growth 2023-2028 (%)
- 7.5 Market opportunity by Deployment
- Market opportunity by Deployment ($ million)
- Data Table on Market opportunity by Deployment ($ million)
8 Customer Landscape
- 8.1 Customer landscape overview
- Analysis of price sensitivity, lifecycle, customer purchase basket, adoption rates, and purchase criteria
9 Geographic Landscape
- 9.1 Geographic segmentation
- Chart on Market share By Geographical Landscape 2023-2028 (%)
- Data Table on Market share By Geographical Landscape 2023-2028 (%)
- 9.2 Geographic comparison
- Chart on Geographic comparison
- Data Table on Geographic comparison
- 9.3 APAC - Market size and forecast 2023-2028
- Chart on APAC - Market size and forecast 2023-2028 ($ million)
- Data Table on APAC - Market size and forecast 2023-2028 ($ million)
- Chart on APAC - Year-over-year growth 2023-2028 (%)
- Data Table on APAC - Year-over-year growth 2023-2028 (%)
- 9.4 North America - Market size and forecast 2023-2028
- Chart on North America - Market size and forecast 2023-2028 ($ million)
- Data Table on North America - Market size and forecast 2023-2028 ($ million)
- Chart on North America - Year-over-year growth 2023-2028 (%)
- Data Table on North America - Year-over-year growth 2023-2028 (%)
- 9.5 Europe - Market size and forecast 2023-2028
- Chart on Europe - Market size and forecast 2023-2028 ($ million)
- Data Table on Europe - Market size and forecast 2023-2028 ($ million)
- Chart on Europe - Year-over-year growth 2023-2028 (%)
- Data Table on Europe - Year-over-year growth 2023-2028 (%)
- 9.6 Middle East and Africa - Market size and forecast 2023-2028
- Chart on Middle East and Africa - Market size and forecast 2023-2028 ($ million)
- Data Table on Middle East and Africa - Market size and forecast 2023-2028 ($ million)
- Chart on Middle East and Africa - Year-over-year growth 2023-2028 (%)
- Data Table on Middle East and Africa - Year-over-year growth 2023-2028 (%)
- 9.7 South America - Market size and forecast 2023-2028
- Chart on South America - Market size and forecast 2023-2028 ($ million)
- Data Table on South America - Market size and forecast 2023-2028 ($ million)
- Chart on South America - Year-over-year growth 2023-2028 (%)
- Data Table on South America - Year-over-year growth 2023-2028 (%)
- 9.8 China - Market size and forecast 2023-2028
- Chart on China - Market size and forecast 2023-2028 ($ million)
- Data Table on China - Market size and forecast 2023-2028 ($ million)
- Chart on China - Year-over-year growth 2023-2028 (%)
- Data Table on China - Year-over-year growth 2023-2028 (%)
- 9.9 US - Market size and forecast 2023-2028
- Chart on US - Market size and forecast 2023-2028 ($ million)
- Data Table on US - Market size and forecast 2023-2028 ($ million)
- Chart on US - Year-over-year growth 2023-2028 (%)
- Data Table on US - Year-over-year growth 2023-2028 (%)
- 9.10 Japan - Market size and forecast 2023-2028
- Chart on Japan - Market size and forecast 2023-2028 ($ million)
- Data Table on Japan - Market size and forecast 2023-2028 ($ million)
- Chart on Japan - Year-over-year growth 2023-2028 (%)
- Data Table on Japan - Year-over-year growth 2023-2028 (%)
- 9.11 Germany - Market size and forecast 2023-2028
- Chart on Germany - Market size and forecast 2023-2028 ($ million)
- Data Table on Germany - Market size and forecast 2023-2028 ($ million)
- Chart on Germany - Year-over-year growth 2023-2028 (%)
- Data Table on Germany - Year-over-year growth 2023-2028 (%)
- 9.12 South Korea - Market size and forecast 2023-2028
- Chart on South Korea - Market size and forecast 2023-2028 ($ million)
- Data Table on South Korea - Market size and forecast 2023-2028 ($ million)
- Chart on South Korea - Year-over-year growth 2023-2028 (%)
- Data Table on South Korea - Year-over-year growth 2023-2028 (%)
- 9.13 Market opportunity By Geographical Landscape
- Market opportunity By Geographical Landscape ($ million)
- Data Tables on Market opportunity By Geographical Landscape ($ million)
10 Drivers, Challenges, and Opportunity/Restraints
- 10.1 Market drivers
- 10.2 Market challenges
- 10.3 Impact of drivers and challenges
- Impact of drivers and challenges in 2023 and 2028
- 10.4 Market opportunities/restraints
11 Competitive Landscape
- 11.1 Overview
- 11.2 Competitive Landscape
- Overview on criticality of inputs and factors of differentiation
- 11.3 Landscape disruption
- Overview on factors of disruption
- 11.4 Industry risks
- Impact of key risks on business
12 Competitive Analysis
- 12.1 Companies profiled
- Companies covered
- 12.2 Market positioning of companies
- Matrix on companies position and classification
- 12.3 AP Moller Maersk AS
- AP Moller Maersk AS - Overview
- AP Moller Maersk AS - Business segments
- AP Moller Maersk AS - Key news
- AP Moller Maersk AS - Key offerings
- AP Moller Maersk AS - Segment focus
- 12.4 Boxnbiz Technologies Pvt. Ltd.
- Boxnbiz Technologies Pvt. Ltd. - Overview
- Boxnbiz Technologies Pvt. Ltd. - Product / Service
- Boxnbiz Technologies Pvt. Ltd. - Key offerings
- 12.5 CMA CGM Group
- CMA CGM Group - Overview
- CMA CGM Group - Product / Service
- CMA CGM Group - Key news
- CMA CGM Group - Key offerings
- 12.6 COSCO Shipping International Co. Ltd.
- COSCO Shipping International Co. Ltd. - Overview
- COSCO Shipping International Co. Ltd. - Business segments
- COSCO Shipping International Co. Ltd. - Key offerings
- COSCO Shipping International Co. Ltd. - Segment focus
- 12.7 Deutsche Post AG
- Deutsche Post AG - Overview
- Deutsche Post AG - Product / Service
- Deutsche Post AG - Key news
- Deutsche Post AG - Key offerings
- 12.8 Evergreen Marine Corp. Taiwan Ltd.
- Evergreen Marine Corp. Taiwan Ltd. - Overview
- Evergreen Marine Corp. Taiwan Ltd. - Business segments
- Evergreen Marine Corp. Taiwan Ltd. - Key offerings
- Evergreen Marine Corp. Taiwan Ltd. - Segment focus
- 12.9 FedEx Corp.
- FedEx Corp. - Overview
- FedEx Corp. - Business segments
- FedEx Corp. - Key offerings
- FedEx Corp. - Segment focus
- 12.10 Flexport Inc.
- Flexport Inc. - Overview
- Flexport Inc. - Product / Service
- Flexport Inc. - Key offerings
- 12.11 Forto GmbH
- Forto GmbH - Overview
- Forto GmbH - Product / Service
- Forto GmbH - Key offerings
- 12.12 Hapag Lloyd AG
- Hapag Lloyd AG - Overview
- Hapag Lloyd AG - Product / Service
- Hapag Lloyd AG - Key news
- Hapag Lloyd AG - Key offerings
- 12.13 HMM Europe Ltd.
- HMM Europe Ltd. - Overview
- HMM Europe Ltd. - Product / Service
- HMM Europe Ltd. - Key offerings
- 12.14 MSC Mediterranean Shipping Co. SA
- MSC Mediterranean Shipping Co. SA - Overview
- MSC Mediterranean Shipping Co. SA - Product / Service
- MSC Mediterranean Shipping Co. SA - Key offerings
- 12.15 Ocean Network Express Pte. Ltd.
- Ocean Network Express Pte. Ltd. - Overview
- Ocean Network Express Pte. Ltd. - Product / Service
- Ocean Network Express Pte. Ltd. - Key offerings
- 12.16 Yang Ming Marine Transport Corp.
- Yang Ming Marine Transport Corp. - Overview
- Yang Ming Marine Transport Corp. - Product / Service
- Yang Ming Marine Transport Corp. - Key offerings
- 12.17 ZIM Integrated Shipping Services Ltd.
- ZIM Integrated Shipping Services Ltd. - Overview
- ZIM Integrated Shipping Services Ltd. - Product / Service
- ZIM Integrated Shipping Services Ltd. - Key offerings
13 Appendix
- 13.1 Scope of the report
- 13.2 Inclusions and exclusions checklist
- Inclusions checklist
- Exclusions checklist
- 13.3 Currency conversion rates for US$
- Currency conversion rates for US$
- 13.4 Research methodology
- Research methodology
- 13.5 Data procurement
- Information sources
- 13.6 Data validation
- Data validation
- 13.7 Validation techniques employed for market sizing
- Validation techniques employed for market sizing
- 13.8 Data synthesis
- Data synthesis
- 360 degree market analysis
- 360 degree market analysis
- 13.10 List of abbreviations
- List of abbreviations

