|
|
市場調査レポート
商品コード
1975401
交通安全製品の世界市場 2026年~2030年Global Traffic Safety Products Market 2026-2030 |
||||||
|
|||||||
カスタマイズ可能
|
|||||||

| 交通安全製品の世界市場 2026年~2030年 |
|
出版日: 2026年03月09日
発行: TechNavio
ページ情報: 英文 304 Pages
納期: 即納可能
|

概要
世界の交通安全製品市場は、2025年から2030年にかけて15億7,150万米ドルの成長が見込まれ、予測期間中のCAGRは7.0%と予測されています。
本報告書では、世界の交通安全製品市場に関する包括的な分析、市場規模と予測、動向、成長要因、課題に加え、約25社のベンダー分析を提供しております。
本レポートは、現在の市場状況、最新の市場動向と促進要因、市場環境全般に関する最新の分析を提供します。市場は、ビジョン・ゼロの枠組みと国家道路安全戦略の制度化、高度道路交通システム(ITS)、AI搭載エッジ監視ソリューションの台頭、持続可能な材料科学、エコ認証安全装備への需要によって牽引されています。
本調査は、業界の主要関係者からの情報を含む、一次情報と二次情報の客観的な組み合わせを用いて実施されました。本レポートには、主要企業の分析に加え、包括的な市場規模データ、地域別分析を伴うセグメント、ベンダー情勢が含まれています。レポートには過去データと予測データが掲載されています。
| 市場範囲 | |
|---|---|
| 基準年 | 2026年 |
| 終了年 | 2030年 |
| 予測期間 | 2026-2030 |
| 成長モメンタム | 加速 |
| 前年比2026年 | 6.6% |
| CAGR | 7% |
| 増分額 | 15億7,150万米ドル |
本調査では、今後数年間における世界の交通安全製品市場の成長を牽引する主な要因の一つとして、自律型道路維持管理システムおよびインフラ監視システムの普及が挙げられます。また、次世代のアクティブセーフティおよび乗員保護プロトコルの進歩、ならびにスマート道路標示やデジタル対応インフラの戦略的拡大が、市場において相当な需要を生み出すものと見込まれます。
目次
第1章 エグゼクティブサマリー
第2章 Technavio分析
- 価格・ライフサイクル・顧客購入バスケット・採用率・購入基準の分析
- インプットの重要性と差別化の要因
- 混乱の要因
- 促進要因と課題の影響
第3章 市場情勢
- 市場エコシステム
- 市場の特徴
- バリューチェーン分析
第4章 市場規模
- 市場の定義
- 市場セグメント分析
- 市場規模 2025
- 市場の見通し 2025-2030
第5章 市場規模実績
- 交通安全製品の世界市場 2020-2024
- 製品セグメント分析 2020-2024
- エンドユーザーセグメント分析 2020-2024
- 用途別セグメント分析 2020-2024
- 地域別セグメント分析 2020-2024
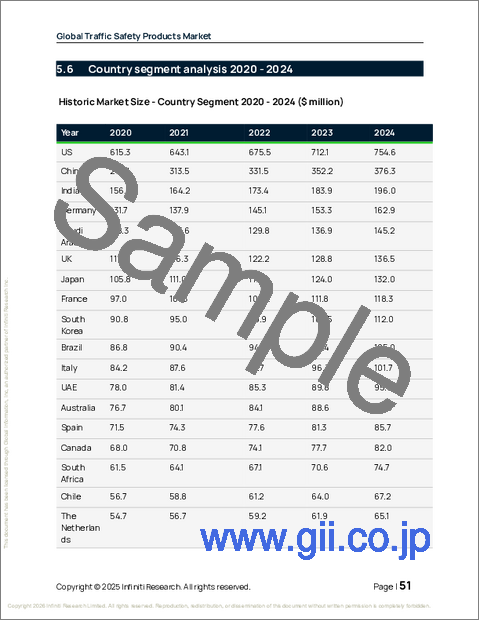
- 国別セグメント分析 2020-2024
第6章 定性分析
- AIの影響:交通安全製品の世界市場
第7章 ファイブフォース分析
- ファイブフォースの要約
- 買い手の交渉力
- 供給企業の交渉力
- 新規参入業者の脅威
- 代替品の脅威
- 競争の脅威
- 市況
第8章 市場セグメンテーション:製品別
- 比較:製品別
- 交通用ベストおよびレインウェア
- チューブ式区画標示器
- 交通コーン
- 交通用バリケード
- その他
- 市場機会:製品別
第9章 市場セグメンテーション:エンドユーザー別
- 比較:エンドユーザー別
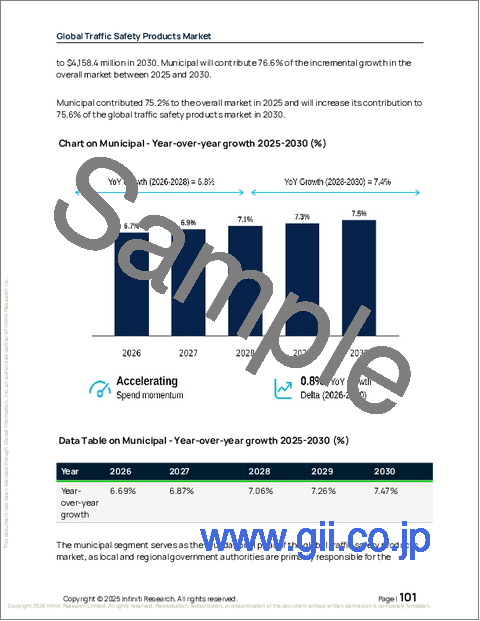
- 自治体向け
- 産業用・商業用
- 市場機会:エンドユーザー別
第10章 市場セグメンテーション:用途別
- 比較:用途別
- 高速道路および自動車道
- 都市道路および街路
- 歩行者専用区域
- 駐車場および工業地域
- 市場機会:用途別
第11章 顧客情勢
第12章 地域別情勢
- 地域別セグメンテーション
- 地域別比較
- アジア太平洋
- 中国
- インド
- 日本
- 韓国
- オーストラリア
- インドネシア
- 北米
- 米国
- カナダ
- メキシコ
- 欧州
- ドイツ
- 英国
- フランス
- イタリア
- スペイン
- オランダ
- 中東・アフリカ
- サウジアラビア
- アラブ首長国連邦
- 南アフリカ
- トルコ
- イスラエル
- 南米
- ブラジル
- チリ
- アルゼンチン
- 市場機会:地域別
第13章 促進要因・課題・機会
- 市場促進要因
- 市場の課題
- 促進要因と課題の影響
- 市場機会
第14章 競合情勢
- 概要
- 競合情勢
- 混乱の状況
- 業界のリスク
第15章 競合分析
- 企業プロファイル
- 企業ランキング指標
- 企業の市場ポジショニング
- 3M Co.
- Arcosa Inc.
- Avery Dennison Corp.
- Brite Line Inc.
- Hill and Smith Inc.
- Horizon Signal Technologies Inc.
- JSP Ltd.
- Lindsay Corp.
- Nippon Carbide Industries Co. Ltd.
- ORAFOL Europe GmbH
- Oxford Plastic Systems Ltd.
- SWARCO AG
- TrafFix Devices Inc.
- Valmont Industries Inc.
- Wanco Inc.
