|
|
市場調査レポート
商品コード
1685628
音声アシスタントアプリケーションの世界市場 2025~2029年Global Voice Assistant Application Market 2025-2029 |
||||||

|
|||||||
カスタマイズ可能
|
|||||||


| 音声アシスタントアプリケーションの世界市場 2025~2029年 |
|
出版日: 2025年03月14日
発行: TechNavio
ページ情報: 英文 246 Pages
納期: 即納可能
|

全表示
- 概要
- 図表
- 目次
音声アシスタントアプリケーション市場は、2024年から2029年にかけて367億4,660万米ドル、予測期間中のCAGRは46.7%で成長すると予測されています。
当レポートでは、音声アシスタントアプリケーション市場の全体的な分析、市場規模・予測、動向、成長促進要因、課題、約25のベンダーを網羅したベンダー分析などを掲載しています。
現在の市場シナリオ、最新動向と促進要因、市場環境全体に関する最新分析を提供しています。市場は、デジタルトランスフォーメーション、自律走行車の普及拡大、技術的に高度なモバイルデバイスの採用増加によって牽引されています。
| 市場範囲 | |
|---|---|
| 基準年 | 2025 |
| 終了年 | 2029 |
| 予測期間 | 2025-2029 |
| 成長モメンタム | 加速 |
| 前年比2025年 | 35.5% |
| CAGR | 46.7% |
| 増分額 | 367億4,660万米ドル |
本調査は、業界の主要参加者からのインプットを含め、一次情報と二次情報を客観的に組み合わせて実施しました。レポートには、主要企業の分析に加え、包括的な市場規模データ、地域分析によるセグメント、ベンダー情勢が含まれています。レポートには過去データと予測データがあります。
本調査では、今後数年間の音声アシスタントアプリケーション市場の成長を促進する主な理由の1つとして、スマートホームに対する需要の高まりとスマートシティの開発を挙げています。また、音声制御パーソナルアシスタントがキッチン家電に統合され、ベンダーが新発売や機能強化に注力するようになることも、市場の大きな需要につながると思われます。
目次
第1章 エグゼクティブサマリー
- 市場概要
第2章 Technavio分析
- 価格・ライフサイクル・顧客購入バスケット・採用率・購入基準の分析
- インプットの重要性と差別化の要因
- 混乱の要因
- 促進要因と課題の影響
第3章 市場情勢
- 市場エコシステム
- 市場の特徴
- バリューチェーン分析
第4章 市場規模
- 市場の定義
- 市場セグメント分析
- 市場規模 2024
- 市場の見通し 2024-2029
第5章 市場規模実績
- 音声アシスタントアプリケーションの世界市場 2019-2023
- 用途別セグメント分析 2019-2023
- 展開別セグメント分析 2019-2023
- 技術別セグメント分析 2019-2023
- エンドユーザー別セグメント分析 2019-2023
- 地域別セグメント分析 2019-2023
- 国別セグメント分析 2019-2023
第6章 定性分析
- AIの影響:音声アシスタントアプリケーションの世界市場
第7章 ファイブフォース分析
- ファイブフォースの要約
- 買い手の交渉力
- 供給企業の交渉力
- 新規参入業者の脅威
- 代替品の脅威
- 競争の脅威
- 市況
第8章 市場セグメンテーション:用途別
- 市場セグメント
- 比較:用途別
- 個人ユーザー:市場規模と予測 2024-2029
- 中小企業:市場規模と予測 2024-2029
- 大企業:市場規模と予測 2024-2029
- 市場機会:用途別
第9章 市場セグメンテーション:展開別
- 市場セグメント
- 比較:展開別
- クラウド:市場規模と予測 2024-2029
- オンプレミス:市場規模と予測 2024-2029
- 市場機会:展開別
第10章 市場セグメンテーション:技術別
- 市場セグメント
- 比較:技術別
- 音声認識:市場規模と予測 2024-2029
- テキスト読み上げ:市場規模と予測 2024-2029
- 自然言語処理:市場規模と予測 2024-2029
- 市場機会:技術別
第11章 市場セグメンテーション:エンドユーザー別
- 市場セグメント
- 比較:エンドユーザー別
- ITおよび通信:市場規模と予測 2024-2029
- 小売業とeコマース:市場規模と予測 2024-2029
- BFSI:市場規模と予測 2024-2029
- ヘルスケア:市場規模と予測 2024-2029
- その他:市場規模と予測 2024-2029
- 市場機会:エンドユーザー別
第12章 顧客情勢
- 顧客情勢の概要
第13章 地域別情勢
- 地域別セグメンテーション
- 地域別比較
- 北米:市場規模と予測 2024-2029
- 欧州:市場規模と予測 2024-2029
- アジア太平洋:市場規模と予測 2024-2029
- 中東・アフリカ:市場規模と予測 2024-2029
- 南米:市場規模と予測 2024-2029
- 米国:市場規模と予測 2024-2029
- カナダ:市場規模と予測 2024-2029
- 中国:市場規模と予測 2024-2029
- ドイツ:市場規模と予測 2024-2029
- 英国:市場規模と予測 2024-2029
- 日本:市場規模と予測 2024-2029
- フランス:市場規模と予測 2024-2029
- インド:市場規模と予測 2024-2029
- イタリア:市場規模と予測 2024-2029
- 韓国:市場規模と予測 2024-2029
- 市場機会:地域情勢別
第14章 促進要因・課題・機会・抑制要因
- 市場促進要因
- 市場の課題
- 促進要因と課題の影響
- 市場の機会・抑制要因
第15章 競合情勢
- 概要
- 競合情勢
- 混乱の状況
- 業界のリスク
第16章 競合分析
- 企業プロファイル
- 企業ランキング指数
- 企業の市場ポジショニング
- Alibaba Group Holding Ltd.
- Amazon.com Inc.
- Apple Inc.
- Artificial Solutions International AB
- Baidu Inc.
- Google LLC
- Huawei Technologies Co. Ltd.
- International Business Machines Corp.
- Microsoft Corp.
- Oracle Corp.
- Orbita Inc.
- Robin Labs
- RoboBot Studio
- Salesforce Inc.
- Samsung Electronics Co. Ltd.
第17章 付録
Exhibits:
- Exhibits1: Executive Summary - Chart on Market Overview
- Exhibits2: Executive Summary - Data Table on Market Overview
- Exhibits3: Executive Summary - Chart on Global Market Characteristics
- Exhibits4: Executive Summary - Chart on Market By Geographical Landscape
- Exhibits5: Executive Summary - Chart on Market Segmentation by Application
- Exhibits6: Executive Summary - Chart on Market Segmentation by Deployment
- Exhibits7: Executive Summary - Chart on Market Segmentation by Technology
- Exhibits8: Executive Summary - Chart on Market Segmentation by End-user
- Exhibits9: Executive Summary - Chart on Incremental Growth
- Exhibits10: Executive Summary - Data Table on Incremental Growth
- Exhibits11: Executive Summary - Chart on Company Market Positioning
- Exhibits12: Analysis of price sensitivity, lifecycle, customer purchase basket, adoption rates, and purchase criteria
- Exhibits13: Overview on criticality of inputs and factors of differentiation
- Exhibits14: Overview on factors of disruption
- Exhibits15: Impact of drivers and challenges in 2024 and 2029
- Exhibits16: Parent Market
- Exhibits17: Data Table on - Parent Market
- Exhibits18: Market characteristics analysis
- Exhibits19: Value chain analysis
- Exhibits20: Offerings of companies included in the market definition
- Exhibits21: Market segments
- Exhibits22: Chart on Global - Market size and forecast 2024-2029 ($ million)
- Exhibits23: Data Table on Global - Market size and forecast 2024-2029 ($ million)
- Exhibits24: Chart on Global Market: Year-over-year growth 2024-2029 (%)
- Exhibits25: Data Table on Global Market: Year-over-year growth 2024-2029 (%)
- Exhibits26: Historic Market Size - Data Table on Global Voice Assistant Application Market 2019 - 2023 ($ million)
- Exhibits27: Historic Market Size - Application Segment 2019 - 2023 ($ million)
- Exhibits28: Historic Market Size - Deployment Segment 2019 - 2023 ($ million)
- Exhibits29: Historic Market Size - Technology Segment 2019 - 2023 ($ million)
- Exhibits30: Historic Market Size - End-user Segment 2019 - 2023 ($ million)
- Exhibits31: Historic Market Size - Geography Segment 2019 - 2023 ($ million)
- Exhibits32: Historic Market Size - Country Segment 2019 - 2023 ($ million)
- Exhibits33: Five forces analysis - Comparison between 2024 and 2029
- Exhibits34: Bargaining power of buyers - Impact of key factors 2024 and 2029
- Exhibits35: Bargaining power of suppliers - Impact of key factors in 2024 and 2029
- Exhibits36: Threat of new entrants - Impact of key factors in 2024 and 2029
- Exhibits37: Threat of substitutes - Impact of key factors in 2024 and 2029
- Exhibits38: Threat of rivalry - Impact of key factors in 2024 and 2029
- Exhibits39: Chart on Market condition - Five forces 2024 and 2029
- Exhibits40: Chart on Application - Market share 2024-2029 (%)
- Exhibits41: Data Table on Application - Market share 2024-2029 (%)
- Exhibits42: Chart on Comparison by Application
- Exhibits43: Data Table on Comparison by Application
- Exhibits44: Chart on Individual users - Market size and forecast 2024-2029 ($ million)
- Exhibits45: Data Table on Individual users - Market size and forecast 2024-2029 ($ million)
- Exhibits46: Chart on Individual users - Year-over-year growth 2024-2029 (%)
- Exhibits47: Data Table on Individual users - Year-over-year growth 2024-2029 (%)
- Exhibits48: Chart on SMEs - Market size and forecast 2024-2029 ($ million)
- Exhibits49: Data Table on SMEs - Market size and forecast 2024-2029 ($ million)
- Exhibits50: Chart on SMEs - Year-over-year growth 2024-2029 (%)
- Exhibits51: Data Table on SMEs - Year-over-year growth 2024-2029 (%)
- Exhibits52: Chart on Large enterprises - Market size and forecast 2024-2029 ($ million)
- Exhibits53: Data Table on Large enterprises - Market size and forecast 2024-2029 ($ million)
- Exhibits54: Chart on Large enterprises - Year-over-year growth 2024-2029 (%)
- Exhibits55: Data Table on Large enterprises - Year-over-year growth 2024-2029 (%)
- Exhibits56: Market opportunity by Application ($ million)
- Exhibits57: Data Table on Market opportunity by Application ($ million)
- Exhibits58: Chart on Deployment - Market share 2024-2029 (%)
- Exhibits59: Data Table on Deployment - Market share 2024-2029 (%)
- Exhibits60: Chart on Comparison by Deployment
- Exhibits61: Data Table on Comparison by Deployment
- Exhibits62: Chart on Cloud - Market size and forecast 2024-2029 ($ million)
- Exhibits63: Data Table on Cloud - Market size and forecast 2024-2029 ($ million)
- Exhibits64: Chart on Cloud - Year-over-year growth 2024-2029 (%)
- Exhibits65: Data Table on Cloud - Year-over-year growth 2024-2029 (%)
- Exhibits66: Chart on On-premise - Market size and forecast 2024-2029 ($ million)
- Exhibits67: Data Table on On-premise - Market size and forecast 2024-2029 ($ million)
- Exhibits68: Chart on On-premise - Year-over-year growth 2024-2029 (%)
- Exhibits69: Data Table on On-premise - Year-over-year growth 2024-2029 (%)
- Exhibits70: Market opportunity by Deployment ($ million)
- Exhibits71: Data Table on Market opportunity by Deployment ($ million)
- Exhibits72: Chart on Technology - Market share 2024-2029 (%)
- Exhibits73: Data Table on Technology - Market share 2024-2029 (%)
- Exhibits74: Chart on Comparison by Technology
- Exhibits75: Data Table on Comparison by Technology
- Exhibits76: Chart on Speech recognition - Market size and forecast 2024-2029 ($ million)
- Exhibits77: Data Table on Speech recognition - Market size and forecast 2024-2029 ($ million)
- Exhibits78: Chart on Speech recognition - Year-over-year growth 2024-2029 (%)
- Exhibits79: Data Table on Speech recognition - Year-over-year growth 2024-2029 (%)
- Exhibits80: Chart on Text-to-speech - Market size and forecast 2024-2029 ($ million)
- Exhibits81: Data Table on Text-to-speech - Market size and forecast 2024-2029 ($ million)
- Exhibits82: Chart on Text-to-speech - Year-over-year growth 2024-2029 (%)
- Exhibits83: Data Table on Text-to-speech - Year-over-year growth 2024-2029 (%)
- Exhibits84: Chart on Natural language processing - Market size and forecast 2024-2029 ($ million)
- Exhibits85: Data Table on Natural language processing - Market size and forecast 2024-2029 ($ million)
- Exhibits86: Chart on Natural language processing - Year-over-year growth 2024-2029 (%)
- Exhibits87: Data Table on Natural language processing - Year-over-year growth 2024-2029 (%)
- Exhibits88: Market opportunity by Technology ($ million)
- Exhibits89: Data Table on Market opportunity by Technology ($ million)
- Exhibits90: Chart on End-user - Market share 2024-2029 (%)
- Exhibits91: Data Table on End-user - Market share 2024-2029 (%)
- Exhibits92: Chart on Comparison by End-user
- Exhibits93: Data Table on Comparison by End-user
- Exhibits94: Chart on IT and telecom - Market size and forecast 2024-2029 ($ million)
- Exhibits95: Data Table on IT and telecom - Market size and forecast 2024-2029 ($ million)
- Exhibits96: Chart on IT and telecom - Year-over-year growth 2024-2029 (%)
- Exhibits97: Data Table on IT and telecom - Year-over-year growth 2024-2029 (%)
- Exhibits98: Chart on Retail and E-commerce - Market size and forecast 2024-2029 ($ million)
- Exhibits99: Data Table on Retail and E-commerce - Market size and forecast 2024-2029 ($ million)
- Exhibits100: Chart on Retail and E-commerce - Year-over-year growth 2024-2029 (%)
- Exhibits101: Data Table on Retail and E-commerce - Year-over-year growth 2024-2029 (%)
- Exhibits102: Chart on BFSI - Market size and forecast 2024-2029 ($ million)
- Exhibits103: Data Table on BFSI - Market size and forecast 2024-2029 ($ million)
- Exhibits104: Chart on BFSI - Year-over-year growth 2024-2029 (%)
- Exhibits105: Data Table on BFSI - Year-over-year growth 2024-2029 (%)
- Exhibits106: Chart on Healthcare - Market size and forecast 2024-2029 ($ million)
- Exhibits107: Data Table on Healthcare - Market size and forecast 2024-2029 ($ million)
- Exhibits108: Chart on Healthcare - Year-over-year growth 2024-2029 (%)
- Exhibits109: Data Table on Healthcare - Year-over-year growth 2024-2029 (%)
- Exhibits110: Chart on Others - Market size and forecast 2024-2029 ($ million)
- Exhibits111: Data Table on Others - Market size and forecast 2024-2029 ($ million)
- Exhibits112: Chart on Others - Year-over-year growth 2024-2029 (%)
- Exhibits113: Data Table on Others - Year-over-year growth 2024-2029 (%)
- Exhibits114: Market opportunity by End-user ($ million)
- Exhibits115: Data Table on Market opportunity by End-user ($ million)
- Exhibits116: Analysis of price sensitivity, lifecycle, customer purchase basket, adoption rates, and purchase criteria
- Exhibits117: Chart on Market share By Geographical Landscape 2024-2029 (%)
- Exhibits118: Data Table on Market share By Geographical Landscape 2024-2029 (%)
- Exhibits119: Chart on Geographic comparison
- Exhibits120: Data Table on Geographic comparison
- Exhibits121: Chart on North America - Market size and forecast 2024-2029 ($ million)
- Exhibits122: Data Table on North America - Market size and forecast 2024-2029 ($ million)
- Exhibits123: Chart on North America - Year-over-year growth 2024-2029 (%)
- Exhibits124: Data Table on North America - Year-over-year growth 2024-2029 (%)
- Exhibits125: Chart on Europe - Market size and forecast 2024-2029 ($ million)
- Exhibits126: Data Table on Europe - Market size and forecast 2024-2029 ($ million)
- Exhibits127: Chart on Europe - Year-over-year growth 2024-2029 (%)
- Exhibits128: Data Table on Europe - Year-over-year growth 2024-2029 (%)
- Exhibits129: Chart on APAC - Market size and forecast 2024-2029 ($ million)
- Exhibits130: Data Table on APAC - Market size and forecast 2024-2029 ($ million)
- Exhibits131: Chart on APAC - Year-over-year growth 2024-2029 (%)
- Exhibits132: Data Table on APAC - Year-over-year growth 2024-2029 (%)
- Exhibits133: Chart on Middle East and Africa - Market size and forecast 2024-2029 ($ million)
- Exhibits134: Data Table on Middle East and Africa - Market size and forecast 2024-2029 ($ million)
- Exhibits135: Chart on Middle East and Africa - Year-over-year growth 2024-2029 (%)
- Exhibits136: Data Table on Middle East and Africa - Year-over-year growth 2024-2029 (%)
- Exhibits137: Chart on South America - Market size and forecast 2024-2029 ($ million)
- Exhibits138: Data Table on South America - Market size and forecast 2024-2029 ($ million)
- Exhibits139: Chart on South America - Year-over-year growth 2024-2029 (%)
- Exhibits140: Data Table on South America - Year-over-year growth 2024-2029 (%)
- Exhibits141: Chart on US - Market size and forecast 2024-2029 ($ million)
- Exhibits142: Data Table on US - Market size and forecast 2024-2029 ($ million)
- Exhibits143: Chart on US - Year-over-year growth 2024-2029 (%)
- Exhibits144: Data Table on US - Year-over-year growth 2024-2029 (%)
- Exhibits145: Chart on Canada - Market size and forecast 2024-2029 ($ million)
- Exhibits146: Data Table on Canada - Market size and forecast 2024-2029 ($ million)
- Exhibits147: Chart on Canada - Year-over-year growth 2024-2029 (%)
- Exhibits148: Data Table on Canada - Year-over-year growth 2024-2029 (%)
- Exhibits149: Chart on China - Market size and forecast 2024-2029 ($ million)
- Exhibits150: Data Table on China - Market size and forecast 2024-2029 ($ million)
- Exhibits151: Chart on China - Year-over-year growth 2024-2029 (%)
- Exhibits152: Data Table on China - Year-over-year growth 2024-2029 (%)
- Exhibits153: Chart on Germany - Market size and forecast 2024-2029 ($ million)
- Exhibits154: Data Table on Germany - Market size and forecast 2024-2029 ($ million)
- Exhibits155: Chart on Germany - Year-over-year growth 2024-2029 (%)
- Exhibits156: Data Table on Germany - Year-over-year growth 2024-2029 (%)
- Exhibits157: Chart on UK - Market size and forecast 2024-2029 ($ million)
- Exhibits158: Data Table on UK - Market size and forecast 2024-2029 ($ million)
- Exhibits159: Chart on UK - Year-over-year growth 2024-2029 (%)
- Exhibits160: Data Table on UK - Year-over-year growth 2024-2029 (%)
- Exhibits161: Chart on Japan - Market size and forecast 2024-2029 ($ million)
- Exhibits162: Data Table on Japan - Market size and forecast 2024-2029 ($ million)
- Exhibits163: Chart on Japan - Year-over-year growth 2024-2029 (%)
- Exhibits164: Data Table on Japan - Year-over-year growth 2024-2029 (%)
- Exhibits165: Chart on France - Market size and forecast 2024-2029 ($ million)
- Exhibits166: Data Table on France - Market size and forecast 2024-2029 ($ million)
- Exhibits167: Chart on France - Year-over-year growth 2024-2029 (%)
- Exhibits168: Data Table on France - Year-over-year growth 2024-2029 (%)
- Exhibits169: Chart on India - Market size and forecast 2024-2029 ($ million)
- Exhibits170: Data Table on India - Market size and forecast 2024-2029 ($ million)
- Exhibits171: Chart on India - Year-over-year growth 2024-2029 (%)
- Exhibits172: Data Table on India - Year-over-year growth 2024-2029 (%)
- Exhibits173: Chart on Italy - Market size and forecast 2024-2029 ($ million)
- Exhibits174: Data Table on Italy - Market size and forecast 2024-2029 ($ million)
- Exhibits175: Chart on Italy - Year-over-year growth 2024-2029 (%)
- Exhibits176: Data Table on Italy - Year-over-year growth 2024-2029 (%)
- Exhibits177: Chart on South Korea - Market size and forecast 2024-2029 ($ million)
- Exhibits178: Data Table on South Korea - Market size and forecast 2024-2029 ($ million)
- Exhibits179: Chart on South Korea - Year-over-year growth 2024-2029 (%)
- Exhibits180: Data Table on South Korea - Year-over-year growth 2024-2029 (%)
- Exhibits181: Market opportunity By Geographical Landscape ($ million)
- Exhibits182: Data Tables on Market opportunity By Geographical Landscape ($ million)
- Exhibits183: Impact of drivers and challenges in 2024 and 2029
- Exhibits184: Overview on criticality of inputs and factors of differentiation
- Exhibits185: Overview on factors of disruption
- Exhibits186: Impact of key risks on business
- Exhibits187: Companies covered
- Exhibits188: Company ranking index
- Exhibits189: Matrix on companies position and classification
- Exhibits190: Alibaba Group Holding Ltd. - Overview
- Exhibits191: Alibaba Group Holding Ltd. - Business segments
- Exhibits192: Alibaba Group Holding Ltd. - Key news
- Exhibits193: Alibaba Group Holding Ltd. - Key offerings
- Exhibits194: Alibaba Group Holding Ltd. - Segment focus
- Exhibits195: SWOT
- Exhibits196: Amazon.com Inc. - Overview
- Exhibits197: Amazon.com Inc. - Business segments
- Exhibits198: Amazon.com Inc. - Key news
- Exhibits199: Amazon.com Inc. - Key offerings
- Exhibits200: Amazon.com Inc. - Segment focus
- Exhibits201: SWOT
- Exhibits202: Apple Inc. - Overview
- Exhibits203: Apple Inc. - Business segments
- Exhibits204: Apple Inc. - Key news
- Exhibits205: Apple Inc. - Key offerings
- Exhibits206: Apple Inc. - Segment focus
- Exhibits207: SWOT
- Exhibits208: Artificial Solutions International AB - Overview
- Exhibits209: Artificial Solutions International AB - Product / Service
- Exhibits210: Artificial Solutions International AB - Key offerings
- Exhibits211: SWOT
- Exhibits212: Baidu Inc. - Overview
- Exhibits213: Baidu Inc. - Business segments
- Exhibits214: Baidu Inc. - Key offerings
- Exhibits215: Baidu Inc. - Segment focus
- Exhibits216: SWOT
- Exhibits217: Google LLC - Overview
- Exhibits218: Google LLC - Product / Service
- Exhibits219: Google LLC - Key news
- Exhibits220: Google LLC - Key offerings
- Exhibits221: SWOT
- Exhibits222: Huawei Technologies Co. Ltd. - Overview
- Exhibits223: Huawei Technologies Co. Ltd. - Product / Service
- Exhibits224: Huawei Technologies Co. Ltd. - Key news
- Exhibits225: Huawei Technologies Co. Ltd. - Key offerings
- Exhibits226: SWOT
- Exhibits227: International Business Machines Corp. - Overview
- Exhibits228: International Business Machines Corp. - Business segments
- Exhibits229: International Business Machines Corp. - Key news
- Exhibits230: International Business Machines Corp. - Key offerings
- Exhibits231: International Business Machines Corp. - Segment focus
- Exhibits232: SWOT
- Exhibits233: Microsoft Corp. - Overview
- Exhibits234: Microsoft Corp. - Business segments
- Exhibits235: Microsoft Corp. - Key news
- Exhibits236: Microsoft Corp. - Key offerings
- Exhibits237: Microsoft Corp. - Segment focus
- Exhibits238: SWOT
- Exhibits239: Oracle Corp. - Overview
- Exhibits240: Oracle Corp. - Business segments
- Exhibits241: Oracle Corp. - Key news
- Exhibits242: Oracle Corp. - Key offerings
- Exhibits243: Oracle Corp. - Segment focus
- Exhibits244: SWOT
- Exhibits245: Orbita Inc. - Overview
- Exhibits246: Orbita Inc. - Product / Service
- Exhibits247: Orbita Inc. - Key offerings
- Exhibits248: SWOT
- Exhibits249: Robin Labs - Overview
- Exhibits250: Robin Labs - Product / Service
- Exhibits251: Robin Labs - Key offerings
- Exhibits252: SWOT
- Exhibits253: RoboBot Studio - Overview
- Exhibits254: RoboBot Studio - Product / Service
- Exhibits255: RoboBot Studio - Key offerings
- Exhibits256: SWOT
- Exhibits257: Salesforce Inc. - Overview
- Exhibits258: Salesforce Inc. - Product / Service
- Exhibits259: Salesforce Inc. - Key news
- Exhibits260: Salesforce Inc. - Key offerings
- Exhibits261: SWOT
- Exhibits262: Samsung Electronics Co. Ltd. - Overview
- Exhibits263: Samsung Electronics Co. Ltd. - Business segments
- Exhibits264: Samsung Electronics Co. Ltd. - Key news
- Exhibits265: Samsung Electronics Co. Ltd. - Key offerings
- Exhibits266: Samsung Electronics Co. Ltd. - Segment focus
- Exhibits267: SWOT
- Exhibits268: Inclusions checklist
- Exhibits269: Exclusions checklist
- Exhibits270: Currency conversion rates for US$
- Exhibits271: Research methodology
- Exhibits272: Information sources
- Exhibits273: Data validation
- Exhibits274: Validation techniques employed for market sizing
- Exhibits275: Data synthesis
- Exhibits276: 360 degree market analysis
- Exhibits277: List of abbreviations
The voice assistant application market is forecasted to grow by USD 36746.6 million during 2024-2029, accelerating at a CAGR of 46.7% during the forecast period. The report on the voice assistant application market provides a holistic analysis, market size and forecast, trends, growth drivers, and challenges, as well as vendor analysis covering around 25 vendors.
The report offers an up-to-date analysis regarding the current market scenario, the latest trends and drivers, and the overall market environment. The market is driven by digital transformation, increasing popularity of autonomous vehicles, and increasing adoption of technologically advanced mobile devices.
| Market Scope | |
|---|---|
| Base Year | 2025 |
| End Year | 2029 |
| Series Year | 2025-2029 |
| Growth Momentum | Accelerate |
| YOY 2025 | 35.5% |
| CAGR | 46.7% |
| Incremental Value | $36746.6 mn |
The study was conducted using an objective combination of primary and secondary information including inputs from key participants in the industry. The report contains a comprehensive market size data, segment with regional analysis and vendor landscape in addition to an analysis of the key companies. Reports have historic and forecast data.
Technavio's voice assistant application market is segmented as below:
By Application
- Individual users
- SMEs
- Large enterprises
By Deployment
- Cloud
- On-premise
By Technology
- Speech recognition
- Text-to-speech
- Natural language processing
By End-user
- IT and telecom
- Retail and E-commerce
- BFSI
- Healthcare
- Others
By Geographical Landscape
- North America
- Europe
- APAC
- Middle East and Africa
- South America
This study identifies the growing demand for smart homes and development of smart cities as one of the prime reasons driving the voice assistant application market growth during the next few years. Also, integration of voice-controlled personal assistants in kitchen appliances and increasing focus of vendors on new launches and feature enhancements will lead to sizable demand in the market.
The report on the voice assistant application market covers the following areas:
- Voice Assistant Application Market sizing
- Voice Assistant Application Market forecast
- Voice Assistant Application Market industry analysis
The robust vendor analysis is designed to help clients improve their market position, and in line with this, this report provides a detailed analysis of several leading voice assistant application market vendors that include Alibaba Group Holding Ltd., Amazon.com Inc., Apple Inc., Artificial Solutions International AB, Baidu Inc., Google LLC, Huawei Technologies Co. Ltd., International Business Machines Corp., Microsoft Corp., Oracle Corp., Orbita Inc., Robin Labs, RoboBot Studio, Salesforce Inc., Samsung Electronics Co. Ltd., SAP SE, SoundHound AI Inc., Verbio Technologies SL, Voiceflow Inc., and Xiaomi Inc.. Also, the voice assistant application market analysis report includes information on upcoming trends and challenges that will influence market growth. This is to help companies strategize and leverage all forthcoming growth opportunities.
The publisher presents a detailed picture of the market by the way of study, synthesis, and summation of data from multiple sources by an analysis of key parameters such as profit, pricing, competition, and promotions. It presents various market facets by identifying the key industry influencers. The data presented is comprehensive, reliable, and a result of extensive primary and secondary research. The market research reports provide a complete competitive landscape and an in-depth vendor selection methodology and analysis using qualitative and quantitative research to forecast accurate market growth.
Table of Contents
1 Executive Summary
- 1.1 Market overview
- Executive Summary - Chart on Market Overview
- Executive Summary - Data Table on Market Overview
- Executive Summary - Chart on Global Market Characteristics
- Executive Summary - Chart on Market By Geographical Landscape
- Executive Summary - Chart on Market Segmentation by Application
- Executive Summary - Chart on Market Segmentation by Deployment
- Executive Summary - Chart on Market Segmentation by Technology
- Executive Summary - Chart on Market Segmentation by End-user
- Executive Summary - Chart on Incremental Growth
- Executive Summary - Data Table on Incremental Growth
- Executive Summary - Chart on Company Market Positioning
2 Technavio Analysis
- 2.1 Analysis of price sensitivity, lifecycle, customer purchase basket, adoption rates, and purchase criteria
- Analysis of price sensitivity, lifecycle, customer purchase basket, adoption rates, and purchase criteria
- 2.2 Criticality of inputs and Factors of differentiation
- Overview on criticality of inputs and factors of differentiation
- 2.3 Factors of disruption
- Overview on factors of disruption
- 2.4 Impact of drivers and challenges
- Impact of drivers and challenges in 2024 and 2029
3 Market Landscape
- 3.1 Market ecosystem
- Parent Market
- Data Table on - Parent Market
- 3.2 Market characteristics
- Market characteristics analysis
- 3.3 Value chain analysis
- Value chain analysis
4 Market Sizing
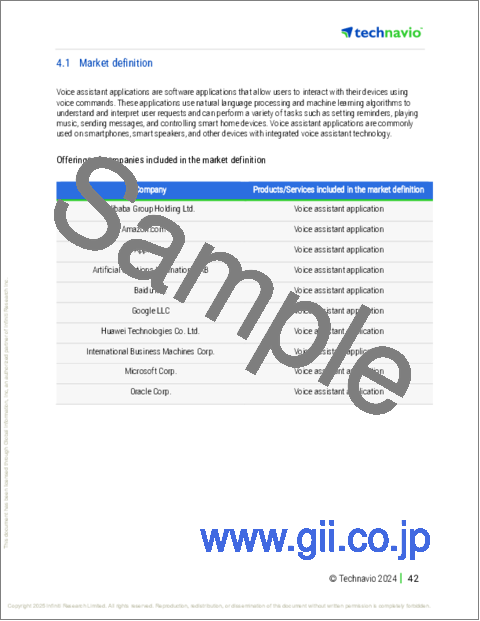
- 4.1 Market definition
- Offerings of companies included in the market definition
- 4.2 Market segment analysis
- Market segments
- 4.3 Market size 2024
- 4.4 Market outlook: Forecast for 2024-2029
- Chart on Global - Market size and forecast 2024-2029 ($ million)
- Data Table on Global - Market size and forecast 2024-2029 ($ million)
- Chart on Global Market: Year-over-year growth 2024-2029 (%)
- Data Table on Global Market: Year-over-year growth 2024-2029 (%)
5 Historic Market Size
- 5.1 Global Voice Assistant Application Market 2019 - 2023
- Historic Market Size - Data Table on Global Voice Assistant Application Market 2019 - 2023 ($ million)
- 5.2 Application segment analysis 2019 - 2023
- Historic Market Size - Application Segment 2019 - 2023 ($ million)
- 5.3 Deployment segment analysis 2019 - 2023
- Historic Market Size - Deployment Segment 2019 - 2023 ($ million)
- 5.4 Technology segment analysis 2019 - 2023
- Historic Market Size - Technology Segment 2019 - 2023 ($ million)
- 5.5 End-user segment analysis 2019 - 2023
- Historic Market Size - End-user Segment 2019 - 2023 ($ million)
- 5.6 Geography segment analysis 2019 - 2023
- Historic Market Size - Geography Segment 2019 - 2023 ($ million)
- 5.7 Country segment analysis 2019 - 2023
- Historic Market Size - Country Segment 2019 - 2023 ($ million)
6 Qualitative Analysis
- 6.1 Impact of AI on the Global Voice Assistant Application Market
7 Five Forces Analysis
- 7.1 Five forces summary
- Five forces analysis - Comparison between 2024 and 2029
- 7.2 Bargaining power of buyers
- Bargaining power of buyers - Impact of key factors 2024 and 2029
- 7.3 Bargaining power of suppliers
- Bargaining power of suppliers - Impact of key factors in 2024 and 2029
- 7.4 Threat of new entrants
- Threat of new entrants - Impact of key factors in 2024 and 2029
- 7.5 Threat of substitutes
- Threat of substitutes - Impact of key factors in 2024 and 2029
- 7.6 Threat of rivalry
- Threat of rivalry - Impact of key factors in 2024 and 2029
- 7.7 Market condition
- Chart on Market condition - Five forces 2024 and 2029
8 Market Segmentation by Application
- 8.1 Market segments
- Chart on Application - Market share 2024-2029 (%)
- Data Table on Application - Market share 2024-2029 (%)
- 8.2 Comparison by Application
- Chart on Comparison by Application
- Data Table on Comparison by Application
- 8.3 Individual users - Market size and forecast 2024-2029
- Chart on Individual users - Market size and forecast 2024-2029 ($ million)
- Data Table on Individual users - Market size and forecast 2024-2029 ($ million)
- Chart on Individual users - Year-over-year growth 2024-2029 (%)
- Data Table on Individual users - Year-over-year growth 2024-2029 (%)
- 8.4 SMEs - Market size and forecast 2024-2029
- Chart on SMEs - Market size and forecast 2024-2029 ($ million)
- Data Table on SMEs - Market size and forecast 2024-2029 ($ million)
- Chart on SMEs - Year-over-year growth 2024-2029 (%)
- Data Table on SMEs - Year-over-year growth 2024-2029 (%)
- 8.5 Large enterprises - Market size and forecast 2024-2029
- Chart on Large enterprises - Market size and forecast 2024-2029 ($ million)
- Data Table on Large enterprises - Market size and forecast 2024-2029 ($ million)
- Chart on Large enterprises - Year-over-year growth 2024-2029 (%)
- Data Table on Large enterprises - Year-over-year growth 2024-2029 (%)
- 8.6 Market opportunity by Application
- Market opportunity by Application ($ million)
- Data Table on Market opportunity by Application ($ million)
9 Market Segmentation by Deployment
- 9.1 Market segments
- Chart on Deployment - Market share 2024-2029 (%)
- Data Table on Deployment - Market share 2024-2029 (%)
- 9.2 Comparison by Deployment
- Chart on Comparison by Deployment
- Data Table on Comparison by Deployment
- 9.3 Cloud - Market size and forecast 2024-2029
- Chart on Cloud - Market size and forecast 2024-2029 ($ million)
- Data Table on Cloud - Market size and forecast 2024-2029 ($ million)
- Chart on Cloud - Year-over-year growth 2024-2029 (%)
- Data Table on Cloud - Year-over-year growth 2024-2029 (%)
- 9.4 On-premise - Market size and forecast 2024-2029
- Chart on On-premise - Market size and forecast 2024-2029 ($ million)
- Data Table on On-premise - Market size and forecast 2024-2029 ($ million)
- Chart on On-premise - Year-over-year growth 2024-2029 (%)
- Data Table on On-premise - Year-over-year growth 2024-2029 (%)
- 9.5 Market opportunity by Deployment
- Market opportunity by Deployment ($ million)
- Data Table on Market opportunity by Deployment ($ million)
10 Market Segmentation by Technology
- 10.1 Market segments
- Chart on Technology - Market share 2024-2029 (%)
- Data Table on Technology - Market share 2024-2029 (%)
- 10.2 Comparison by Technology
- Chart on Comparison by Technology
- Data Table on Comparison by Technology
- 10.3 Speech recognition - Market size and forecast 2024-2029
- Chart on Speech recognition - Market size and forecast 2024-2029 ($ million)
- Data Table on Speech recognition - Market size and forecast 2024-2029 ($ million)
- Chart on Speech recognition - Year-over-year growth 2024-2029 (%)
- Data Table on Speech recognition - Year-over-year growth 2024-2029 (%)
- 10.4 Text-to-speech - Market size and forecast 2024-2029
- Chart on Text-to-speech - Market size and forecast 2024-2029 ($ million)
- Data Table on Text-to-speech - Market size and forecast 2024-2029 ($ million)
- Chart on Text-to-speech - Year-over-year growth 2024-2029 (%)
- Data Table on Text-to-speech - Year-over-year growth 2024-2029 (%)
- 10.5 Natural language processing - Market size and forecast 2024-2029
- Chart on Natural language processing - Market size and forecast 2024-2029 ($ million)
- Data Table on Natural language processing - Market size and forecast 2024-2029 ($ million)
- Chart on Natural language processing - Year-over-year growth 2024-2029 (%)
- Data Table on Natural language processing - Year-over-year growth 2024-2029 (%)
- 10.6 Market opportunity by Technology
- Market opportunity by Technology ($ million)
- Data Table on Market opportunity by Technology ($ million)
11 Market Segmentation by End-user
- 11.1 Market segments
- Chart on End-user - Market share 2024-2029 (%)
- Data Table on End-user - Market share 2024-2029 (%)
- 11.2 Comparison by End-user
- Chart on Comparison by End-user
- Data Table on Comparison by End-user
- 11.3 IT and telecom - Market size and forecast 2024-2029
- Chart on IT and telecom - Market size and forecast 2024-2029 ($ million)
- Data Table on IT and telecom - Market size and forecast 2024-2029 ($ million)
- Chart on IT and telecom - Year-over-year growth 2024-2029 (%)
- Data Table on IT and telecom - Year-over-year growth 2024-2029 (%)
- 11.4 Retail and E-commerce - Market size and forecast 2024-2029
- Chart on Retail and E-commerce - Market size and forecast 2024-2029 ($ million)
- Data Table on Retail and E-commerce - Market size and forecast 2024-2029 ($ million)
- Chart on Retail and E-commerce - Year-over-year growth 2024-2029 (%)
- Data Table on Retail and E-commerce - Year-over-year growth 2024-2029 (%)
- 11.5 BFSI - Market size and forecast 2024-2029
- Chart on BFSI - Market size and forecast 2024-2029 ($ million)
- Data Table on BFSI - Market size and forecast 2024-2029 ($ million)
- Chart on BFSI - Year-over-year growth 2024-2029 (%)
- Data Table on BFSI - Year-over-year growth 2024-2029 (%)
- 11.6 Healthcare - Market size and forecast 2024-2029
- Chart on Healthcare - Market size and forecast 2024-2029 ($ million)
- Data Table on Healthcare - Market size and forecast 2024-2029 ($ million)
- Chart on Healthcare - Year-over-year growth 2024-2029 (%)
- Data Table on Healthcare - Year-over-year growth 2024-2029 (%)
- 11.7 Others - Market size and forecast 2024-2029
- Chart on Others - Market size and forecast 2024-2029 ($ million)
- Data Table on Others - Market size and forecast 2024-2029 ($ million)
- Chart on Others - Year-over-year growth 2024-2029 (%)
- Data Table on Others - Year-over-year growth 2024-2029 (%)
- 11.8 Market opportunity by End-user
- Market opportunity by End-user ($ million)
- Data Table on Market opportunity by End-user ($ million)
12 Customer Landscape
- 12.1 Customer landscape overview
- Analysis of price sensitivity, lifecycle, customer purchase basket, adoption rates, and purchase criteria
13 Geographic Landscape
- 13.1 Geographic segmentation
- Chart on Market share By Geographical Landscape 2024-2029 (%)
- Data Table on Market share By Geographical Landscape 2024-2029 (%)
- 13.2 Geographic comparison
- Chart on Geographic comparison
- Data Table on Geographic comparison
- 13.3 North America - Market size and forecast 2024-2029
- Chart on North America - Market size and forecast 2024-2029 ($ million)
- Data Table on North America - Market size and forecast 2024-2029 ($ million)
- Chart on North America - Year-over-year growth 2024-2029 (%)
- Data Table on North America - Year-over-year growth 2024-2029 (%)
- 13.4 Europe - Market size and forecast 2024-2029
- Chart on Europe - Market size and forecast 2024-2029 ($ million)
- Data Table on Europe - Market size and forecast 2024-2029 ($ million)
- Chart on Europe - Year-over-year growth 2024-2029 (%)
- Data Table on Europe - Year-over-year growth 2024-2029 (%)
- 13.5 APAC - Market size and forecast 2024-2029
- Chart on APAC - Market size and forecast 2024-2029 ($ million)
- Data Table on APAC - Market size and forecast 2024-2029 ($ million)
- Chart on APAC - Year-over-year growth 2024-2029 (%)
- Data Table on APAC - Year-over-year growth 2024-2029 (%)
- 13.6 Middle East and Africa - Market size and forecast 2024-2029
- Chart on Middle East and Africa - Market size and forecast 2024-2029 ($ million)
- Data Table on Middle East and Africa - Market size and forecast 2024-2029 ($ million)
- Chart on Middle East and Africa - Year-over-year growth 2024-2029 (%)
- Data Table on Middle East and Africa - Year-over-year growth 2024-2029 (%)
- 13.7 South America - Market size and forecast 2024-2029
- Chart on South America - Market size and forecast 2024-2029 ($ million)
- Data Table on South America - Market size and forecast 2024-2029 ($ million)
- Chart on South America - Year-over-year growth 2024-2029 (%)
- Data Table on South America - Year-over-year growth 2024-2029 (%)
- 13.8 US - Market size and forecast 2024-2029
- Chart on US - Market size and forecast 2024-2029 ($ million)
- Data Table on US - Market size and forecast 2024-2029 ($ million)
- Chart on US - Year-over-year growth 2024-2029 (%)
- Data Table on US - Year-over-year growth 2024-2029 (%)
- 13.9 Canada - Market size and forecast 2024-2029
- Chart on Canada - Market size and forecast 2024-2029 ($ million)
- Data Table on Canada - Market size and forecast 2024-2029 ($ million)
- Chart on Canada - Year-over-year growth 2024-2029 (%)
- Data Table on Canada - Year-over-year growth 2024-2029 (%)
- 13.10 China - Market size and forecast 2024-2029
- Chart on China - Market size and forecast 2024-2029 ($ million)
- Data Table on China - Market size and forecast 2024-2029 ($ million)
- Chart on China - Year-over-year growth 2024-2029 (%)
- Data Table on China - Year-over-year growth 2024-2029 (%)
- 13.11 Germany - Market size and forecast 2024-2029
- Chart on Germany - Market size and forecast 2024-2029 ($ million)
- Data Table on Germany - Market size and forecast 2024-2029 ($ million)
- Chart on Germany - Year-over-year growth 2024-2029 (%)
- Data Table on Germany - Year-over-year growth 2024-2029 (%)
- 13.12 UK - Market size and forecast 2024-2029
- Chart on UK - Market size and forecast 2024-2029 ($ million)
- Data Table on UK - Market size and forecast 2024-2029 ($ million)
- Chart on UK - Year-over-year growth 2024-2029 (%)
- Data Table on UK - Year-over-year growth 2024-2029 (%)
- 13.13 Japan - Market size and forecast 2024-2029
- Chart on Japan - Market size and forecast 2024-2029 ($ million)
- Data Table on Japan - Market size and forecast 2024-2029 ($ million)
- Chart on Japan - Year-over-year growth 2024-2029 (%)
- Data Table on Japan - Year-over-year growth 2024-2029 (%)
- 13.14 France - Market size and forecast 2024-2029
- Chart on France - Market size and forecast 2024-2029 ($ million)
- Data Table on France - Market size and forecast 2024-2029 ($ million)
- Chart on France - Year-over-year growth 2024-2029 (%)
- Data Table on France - Year-over-year growth 2024-2029 (%)
- 13.15 India - Market size and forecast 2024-2029
- Chart on India - Market size and forecast 2024-2029 ($ million)
- Data Table on India - Market size and forecast 2024-2029 ($ million)
- Chart on India - Year-over-year growth 2024-2029 (%)
- Data Table on India - Year-over-year growth 2024-2029 (%)
- 13.16 Italy - Market size and forecast 2024-2029
- Chart on Italy - Market size and forecast 2024-2029 ($ million)
- Data Table on Italy - Market size and forecast 2024-2029 ($ million)
- Chart on Italy - Year-over-year growth 2024-2029 (%)
- Data Table on Italy - Year-over-year growth 2024-2029 (%)
- 13.17 South Korea - Market size and forecast 2024-2029
- Chart on South Korea - Market size and forecast 2024-2029 ($ million)
- Data Table on South Korea - Market size and forecast 2024-2029 ($ million)
- Chart on South Korea - Year-over-year growth 2024-2029 (%)
- Data Table on South Korea - Year-over-year growth 2024-2029 (%)
- 13.18 Market opportunity By Geographical Landscape
- Market opportunity By Geographical Landscape ($ million)
- Data Tables on Market opportunity By Geographical Landscape ($ million)
14 Drivers, Challenges, and Opportunity/Restraints
- 14.1 Market drivers
- 14.2 Market challenges
- 14.3 Impact of drivers and challenges
- Impact of drivers and challenges in 2024 and 2029
- 14.4 Market opportunities/restraints
15 Competitive Landscape
- 15.1 Overview
- 15.2 Competitive Landscape
- Overview on criticality of inputs and factors of differentiation
- 15.3 Landscape disruption
- Overview on factors of disruption
- 15.4 Industry risks
- Impact of key risks on business
16 Competitive Analysis
- 16.1 Companies profiled
- Companies covered
- 16.2 Company ranking index
- Company ranking index
- 16.3 Market positioning of companies
- Matrix on companies position and classification
- 16.4 Alibaba Group Holding Ltd.
- Alibaba Group Holding Ltd. - Overview
- Alibaba Group Holding Ltd. - Business segments
- Alibaba Group Holding Ltd. - Key news
- Alibaba Group Holding Ltd. - Key offerings
- Alibaba Group Holding Ltd. - Segment focus
- SWOT
- 16.5 Amazon.com Inc.
- Amazon.com Inc. - Overview
- Amazon.com Inc. - Business segments
- Amazon.com Inc. - Key news
- Amazon.com Inc. - Key offerings
- Amazon.com Inc. - Segment focus
- SWOT
- 16.6 Apple Inc.
- Apple Inc. - Overview
- Apple Inc. - Business segments
- Apple Inc. - Key news
- Apple Inc. - Key offerings
- Apple Inc. - Segment focus
- SWOT
- 16.7 Artificial Solutions International AB
- Artificial Solutions International AB - Overview
- Artificial Solutions International AB - Product / Service
- Artificial Solutions International AB - Key offerings
- SWOT
- 16.8 Baidu Inc.
- Baidu Inc. - Overview
- Baidu Inc. - Business segments
- Baidu Inc. - Key offerings
- Baidu Inc. - Segment focus
- SWOT
- 16.9 Google LLC
- Google LLC - Overview
- Google LLC - Product / Service
- Google LLC - Key news
- Google LLC - Key offerings
- SWOT
- 16.10 Huawei Technologies Co. Ltd.
- Huawei Technologies Co. Ltd. - Overview
- Huawei Technologies Co. Ltd. - Product / Service
- Huawei Technologies Co. Ltd. - Key news
- Huawei Technologies Co. Ltd. - Key offerings
- SWOT
- 16.11 International Business Machines Corp.
- International Business Machines Corp. - Overview
- International Business Machines Corp. - Business segments
- International Business Machines Corp. - Key news
- International Business Machines Corp. - Key offerings
- International Business Machines Corp. - Segment focus
- SWOT
- 16.12 Microsoft Corp.
- Microsoft Corp. - Overview
- Microsoft Corp. - Business segments
- Microsoft Corp. - Key news
- Microsoft Corp. - Key offerings
- Microsoft Corp. - Segment focus
- SWOT
- 16.13 Oracle Corp.
- Oracle Corp. - Overview
- Oracle Corp. - Business segments
- Oracle Corp. - Key news
- Oracle Corp. - Key offerings
- Oracle Corp. - Segment focus
- SWOT
- 16.14 Orbita Inc.
- Orbita Inc. - Overview
- Orbita Inc. - Product / Service
- Orbita Inc. - Key offerings
- SWOT
- 16.15 Robin Labs
- Robin Labs - Overview
- Robin Labs - Product / Service
- Robin Labs - Key offerings
- SWOT
- 16.16 RoboBot Studio
- RoboBot Studio - Overview
- RoboBot Studio - Product / Service
- RoboBot Studio - Key offerings
- SWOT
- 16.17 Salesforce Inc.
- Salesforce Inc. - Overview
- Salesforce Inc. - Product / Service
- Salesforce Inc. - Key news
- Salesforce Inc. - Key offerings
- SWOT
- 16.18 Samsung Electronics Co. Ltd.
- Samsung Electronics Co. Ltd. - Overview
- Samsung Electronics Co. Ltd. - Business segments
- Samsung Electronics Co. Ltd. - Key news
- Samsung Electronics Co. Ltd. - Key offerings
- Samsung Electronics Co. Ltd. - Segment focus
- SWOT
17 Appendix
- 17.1 Scope of the report
- 17.2 Inclusions and exclusions checklist
- Inclusions checklist
- Exclusions checklist
- 17.3 Currency conversion rates for US$
- Currency conversion rates for US$
- 17.4 Research methodology
- Research methodology
- 17.5 Data procurement
- Information sources
- 17.6 Data validation
- Data validation
- 17.7 Validation techniques employed for market sizing
- Validation techniques employed for market sizing
- 17.8 Data synthesis
- Data synthesis
- 17.9 360 degree market analysis
- 360 degree market analysis
- 17.10 List of abbreviations
- List of abbreviations

