|
|
市場調査レポート
商品コード
1915385
世界のセンサー市場2026-2030年Global Sensor Market 2026-2030 |
||||||
|
|||||||
カスタマイズ可能
|
|||||||

| 世界のセンサー市場2026-2030年 |
|
出版日: 2026年01月19日
発行: TechNavio
ページ情報: 英文 340 Pages
納期: 即納可能
|

概要
世界のセンサー市場は、2025年から2030年の間に7,943億米ドル規模に成長し、予測期間中のCAGRは26.7%と予測されております。
本報告書では、世界のセンサー市場に関する包括的な分析、市場規模と予測、動向、成長要因、課題に加え、約25社のベンダー分析を提供しております。
本レポートは、現在の市場状況、最新の動向と促進要因、市場環境全般に関する最新の分析を提供します。市場は、IoT技術ベースのデバイスに対する需要の増加、スマートシティ開発におけるセンサー需要の急増、スマートフォンの利用拡大によって牽引されています。
本調査は、業界の主要関係者からの情報をはじめとする一次情報と二次情報を客観的に組み合わせて実施されました。本レポートには、主要企業の分析に加え、包括的な市場規模データ、地域別分析を伴うセグメント、ベンダー情勢が含まれています。レポートには過去データと予測データが掲載されています。
| 市場範囲 | |
|---|---|
| 基準年 | 2026年 |
| 終了年 | 2030年 |
| 予測期間 | 2026-2030 |
| 成長モメンタム | 加速 |
| 前年比2026年 | 21.1% |
| CAGR | 26.7% |
| 増分額 | 7,943億米ドル |
本調査では、今後数年間における世界のセンサー市場成長を牽引する主要要因の一つとして、ウェアラブルデバイスの普及拡大を挙げております。また、産業分野における自動化の導入増加や遠隔測定分野での応用拡大が、市場における相当な需要を生み出すものと見込まれます。
目次
第1章 エグゼクティブサマリー
第2章 Technavio分析
- 価格・ライフサイクル・顧客購入バスケット・採用率・購入基準の分析
- インプットの重要性と差別化の要因
- 混乱の要因
- 促進要因と課題の影響
第3章 市場情勢
- 市場エコシステム
- 市場の特徴
- バリューチェーン分析
第4章 市場規模
- 市場の定義
- 市場セグメント分析
- 市場規模 2025
- 市場の見通し 2025-2030
第5章 市場規模実績
- 世界のセンサー市場 2020-2024
- タイプセグメント分析 2020-2024
- 接続性セグメント分析 2020-2024
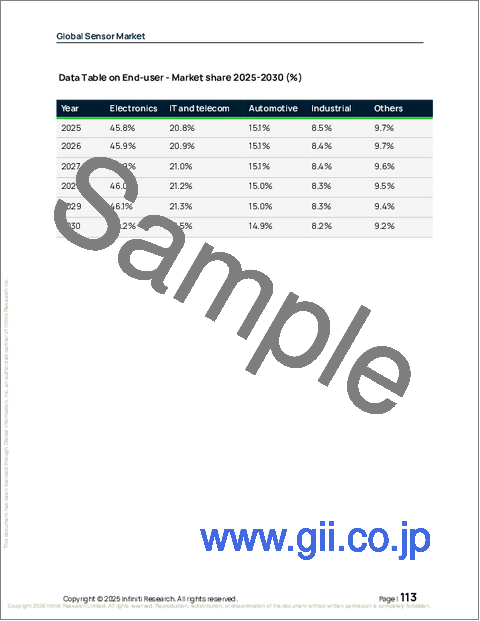
- エンドユーザーセグメント分析 2020-2024
- 技術セグメント分析 2020-2024
- 地域別セグメント分析 2020-2024
- 国別セグメント分析 2020-2024
第6章 定性分析
- AIが世界センサー市場に与える影響世界のセンサー市場
第7章 ファイブフォース分析
- ファイブフォースの要約
- 買い手の交渉力
- 供給企業の交渉力
- 新規参入業者の脅威
- 代替品の脅威
- 競争の脅威
- 市況
第8章 市場セグメンテーション:タイプ別
- 比較:タイプ別
- 温度センサー
- 圧力センサー
- イメージセンサー
- 近接センサー
- その他
- 市場機会:タイプ別
第9章 市場セグメンテーション:接続性別
- 比較:接続性別
- 有線センサー
- 無線センサー
- 市場機会:接続性別
第10章 市場セグメンテーション:エンドユーザー別
- 比較:エンドユーザー別
- 電子機器
- IT・通信
- 自動車
- 産業用
- その他
- 市場機会:エンドユーザー別
第11章 市場セグメンテーション:技術別
- 比較:技術別
- CMOS
- MEMS
- NEMS
- その他
- 市場機会:技術別
第12章 顧客情勢
第13章 地域別情勢
- 地域別セグメンテーション
- 地域別比較
- 北米
- 米国
- カナダ
- メキシコ
- アジア太平洋
- 中国
- 日本
- インド
- 韓国
- オーストラリア
- インドネシア
- 欧州
- ドイツ
- 英国
- フランス
- イタリア
- スペイン
- オランダ
- 中東・アフリカ
- サウジアラビア
- アラブ首長国連邦
- 南アフリカ
- イスラエル
- トルコ
- 南米
- ブラジル
- アルゼンチン
- コロンビア
- 市場機会:地域別
第14章 促進要因・課題・機会
- 市場促進要因
- 市場の課題
- 促進要因と課題の影響
- 市場機会
第15章 競合情勢
- 概要
- 競合情勢
- 混乱の状況
- 業界のリスク
第16章 競合分析
- 企業プロファイル
- 企業ランキング指標
- 企業の市場ポジショニング
- ABB Ltd.
- DENSO Corp.
- Honeywell International Inc.
- Infineon Technologies AG
- NXP Semiconductors NV
- OMRON Corp.
- Panasonic Holdings Corp.
- Robert Bosch GmbH
- Rockwell Automation Inc.
- Samsung Electronics Co. Ltd.
- Schneider Electric SE
- Sony Group Corp.
- STMicroelectronics NV
- TE Connectivity plc
- Texas Instruments Inc.

