|
|
市場調査レポート
商品コード
1666779
痙縮治療の世界市場 2025~2029年Global Spasticity Treatment Market 2025-2029 |
||||||

|
|||||||
カスタマイズ可能
|
|||||||


| 痙縮治療の世界市場 2025~2029年 |
|
出版日: 2025年02月26日
発行: TechNavio
ページ情報: 英文 247 Pages
納期: 即納可能
|

全表示
- 概要
- 目次
痙縮治療市場は、2024~2029年にかけて12億6,860万米ドル、予測期間中のCAGRは4.3%で成長すると予測されています。
当レポートでは、痙縮治療市場の全体的な分析、市場規模・予測、動向、成長促進要因、課題、約25のベンダーを網羅したベンダー分析などを掲載しています。
現在の市場シナリオ、最新動向と促進要因、市場環境全体に関する最新分析を提供しています。慢性疾患の増加や健康状態、ドラッグデリバリーの先端技術の利用可能性、ボツリヌス毒素やカンナビノイドの導入などが市場を牽引しています。
| 市場範囲 | |
|---|---|
| 基準年 | 2025年 |
| 終了年 | 2029年 |
| 予測期間 | 2025~2029年 |
| 成長モメンタム | 加速 |
| 前年比2025年 | 4.2% |
| CAGR | 4.3% |
| 増分額 | 12億6,860万米ドル |
本調査は、業界の主要参加者からのインプットを含め、一次情報と二次情報を客観的に組み合わせて実施しました。レポートには、主要企業の分析に加え、包括的な市場規模データ、地域別分析によるセグメント、ベンダー情勢が含まれています。レポートには履歴データと予測データがあります。
本調査では、痙縮治療向け神経刺激装置の登場が、今後数年間の痙縮治療市場成長を牽引する主要な理由の一つであると特定しています。また、痙縮に対する認識や遠隔医療、遠隔モニタリングに対する意識の高まりは、市場の大きな需要につながるでしょう。
目次
第1章 エグゼクティブサマリー
- 市場概要
第2章 Technavio別分析
- 価格・ライフサイクル・顧客購入バスケット・採用率・購入基準の分析
- インプットの重要性と差別化の要因
- 混乱の要因
- 促進要因と課題の影響
第3章 市場情勢
- 市場エコシステム
- 市場の特徴
- バリューチェーン分析
第4章 市場規模
- 市場の定義
- 市場セグメント分析
- 市場規模 2024年
- 市場展望 2024~2029年
第5章 市場規模実績
- 痙縮治療の世界市場 2019~2023年
- タイプ別セグメント分析 2019~2023年
- エンドユーザー別セグメント分析 2019~2023年
- 適応症別セグメント分析 2019~2023年
- 投与経路別セグメント分析 2019~2023年
- 地域別セグメント分析 2019~2023年
- 国別セグメント分析 2019~2023年
第6章 定性分析
- AIの影響:痙縮治療の世界市場
第7章 ファイブフォース分析
- ファイブフォースの要約
- 買い手の交渉力
- 供給企業の交渉力
- 新規参入業者の脅威
- 代替品の脅威
- 競争の脅威
- 市況
第8章 市場セグメンテーション:タイプ別
- 市場セグメント
- 比較:タイプ別
- 薬物療法:市場規模と予測 2024~2029年
- 理学療法:市場規模と予測 2024~2029年
- 外科的治療:市場規模と予測 2024~2029年
- 市場機会:タイプ別
第9章 市場セグメンテーション:エンドユーザー別
- 市場セグメント
- 比較:エンドユーザー別
- 病院:市場規模と予測 2024~2029年
- 外来手術センター:市場規模と予測 2024~2029年
- 在宅ケア設定:市場規模と予測 2024~2029年
- 専門クリニック:市場規模と予測 2024~2029年
- 診断センター:市場規模と予測 2024~2029年
- 市場機会:エンドユーザー別
第10章 市場セグメンテーション:適応症別
- 市場セグメント
- 比較:適応症別
- 脳性麻痺:市場規模と予測 2024~2029年
- 多発性硬化症:市場規模と予測 2024~2029年
- 外傷性脳損傷:市場規模と予測 2024~2029年
- その他:市場規模と予測 2024~2029年
- 市場機会:適応症別
第11章 市場セグメンテーション:投与経路別
- 市場セグメント
- 比較:投与経路別
- 経口:市場規模と予測 2024~2029年
- 非経口:市場規模と予測 2024~2029年
- 市場機会:投与経路別
第12章 顧客情勢
- 顧客情勢の概要
第13章 地域別情勢
- 地域別セグメンテーション
- 地域別比較
- 北米:市場規模と予測 2024~2029年
- 欧州:市場規模と予測 2024~2029年
- アジア:市場規模と予測 2024~2029年
- 世界のその他の地域:市場規模と予測 2024~2029年
- 米国:市場規模と予測 2024~2029年
- ドイツ:市場規模と予測 2024~2029年
- カナダ:市場規模と予測 2024~2029年
- 中国:市場規模と予測 2024~2029年
- 英国:市場規模と予測 2024~2029年
- 日本:市場規模と予測 2024~2029年
- フランス:市場規模と予測 2024~2029年
- インド:市場規模と予測 2024~2029年
- イタリア:市場規模と予測 2024~2029年
- 韓国:市場規模と予測 2024~2029年
- 市場機会:地域情勢別
第14章 促進要因・課題・機会・抑制要因
- 市場促進要因
- 市場の課題
- 促進要因と課題の影響
- 市場の機会・抑制要因
第15章 競合情勢
- 概要
- 競合情勢
- 混乱の状況
- 業界のリスク
第16章 競合分析
- 企業プロファイル
- 企業ランキング指数
- 企業の市場ポジショニング
- Abbott Laboratories
- Axonics Inc.
- Boston Scientific Corp.
- BrainsWay Ltd.
- electroCore Inc.
- LivaNova PLC
- Medtronic Plc
- NEURONETICS Inc.
- Nevro Corp.
- OMRON Corp.
- PathMaker Neurosystems Inc.
- Saebo
- Saluda Medical Pty Ltd.
- ShiraTronics
- Theranica Bio Electronics Ltd.
第17章 付録
The spasticity treatment market is forecasted to grow by USD 1268.6 million during 2024-2029, accelerating at a CAGR of 4.3% during the forecast period. The report on the spasticity treatment market provides a holistic analysis, market size and forecast, trends, growth drivers, and challenges, as well as vendor analysis covering around 25 vendors.
The report offers an up-to-date analysis regarding the current market scenario, the latest trends and drivers, and the overall market environment. The market is driven by growing incidence of chronic diseases and health conditions, availability of advanced technologies for drug delivery, and introduction of botulinum toxins and cannabinoids.
| Market Scope | |
|---|---|
| Base Year | 2025 |
| End Year | 2029 |
| Series Year | 2025-2029 |
| Growth Momentum | Accelerate |
| YOY 2025 | 4.2% |
| CAGR | 4.3% |
| Incremental Value | $1268.6 mn |
The study was conducted using an objective combination of primary and secondary information including inputs from key participants in the industry. The report contains a comprehensive market size data, segment with regional analysis and vendor landscape in addition to an analysis of the key companies. Reports have historic and forecast data.
Technavio's spasticity treatment market is segmented as below:
By Type
- Drug therapy
- Physical therapy
- Surgical treatment
By End-user
- Hospitals
- Ambulatory surgical centers
- Home care settings
- Specialty clinics
- Diagnostic centers
By Indication
- Cerebral palsy
- Multiple sclerosis
- Traumatic brain injury
- Others
By Route Of Administration
- Oral
- Parenteral
By Geographical Landscape
- North America
- Europe
- Asia
- Rest of World (ROW)
This study identifies the advent of neurostimulation devices for spasticity treatment as one of the prime reasons driving the spasticity treatment market growth during the next few years. Also, growing awareness of spasticity and telemedicine and remote monitoring for spasticity treatment will lead to sizable demand in the market.
The report on the spasticity treatment market covers the following areas:
- Spasticity Treatment Market sizing
- Spasticity Treatment Market forecast
- Spasticity Treatment Market industry analysis
The robust vendor analysis is designed to help clients improve their market position, and in line with this, this report provides a detailed analysis of several leading spasticity treatment market vendors that include Abbott Laboratories, Axonics Inc., BioWave Ltd., Boston Scientific Corp., BrainsWay Ltd., electroCore Inc., LivaNova PLC, Mayo Foundation for Medical Education and Research, Medtronic PLC, NEURONETICS Inc., Nevro Corp., OMRON Corp., PathMaker Neurosystems Inc., Rady Children's Hospital-SAN Diego, Saebo, Saluda Medical Pty Ltd., ShiraTronics, The Johns Hopkins Health System Corp., Theranica Bio Electronics Ltd., and Thync Global Inc.. Also, the spasticity treatment market analysis report includes information on upcoming trends and challenges that will influence market growth. This is to help companies strategize and leverage all forthcoming growth opportunities.
The publisher presents a detailed picture of the market by the way of study, synthesis, and summation of data from multiple sources by an analysis of key parameters such as profit, pricing, competition, and promotions. It presents various market facets by identifying the key industry influencers. The data presented is comprehensive, reliable, and a result of extensive primary and secondary research. The market research reports provide a complete competitive landscape and an in-depth vendor selection methodology and analysis using qualitative and quantitative research to forecast accurate market growth.
Table of Contents
1 Executive Summary
- 1.1 Market overview
- Executive Summary - Chart on Market Overview
- Executive Summary - Data Table on Market Overview
- Executive Summary - Chart on Global Market Characteristics
- Executive Summary - Chart on Market By Geographical Landscape
- Executive Summary - Chart on Market Segmentation by Type
- Executive Summary - Chart on Market Segmentation by End-user
- Executive Summary - Chart on Market Segmentation by Indication
- Executive Summary - Chart on Market Segmentation by Route of Administration
- Executive Summary - Chart on Incremental Growth
- Executive Summary - Data Table on Incremental Growth
- Executive Summary - Chart on Company Market Positioning
2 Technavio Analysis
- 2.1 Analysis of price sensitivity, lifecycle, customer purchase basket, adoption rates, and purchase criteria
- Analysis of price sensitivity, lifecycle, customer purchase basket, adoption rates, and purchase criteria
- 2.2 Criticality of inputs and Factors of differentiation
- Overview on criticality of inputs and factors of differentiation
- 2.3 Factors of disruption
- Overview on factors of disruption
- 2.4 Impact of drivers and challenges
- Impact of drivers and challenges in 2024 and 2029
3 Market Landscape
- 3.1 Market ecosystem
- Parent Market
- Data Table on - Parent Market
- 3.2 Market characteristics
- Market characteristics analysis
- 3.3 Value chain analysis
- Value chain analysis
4 Market Sizing
- 4.1 Market definition
- Offerings of companies included in the market definition
- 4.2 Market segment analysis
- Market segments
- 4.3 Market size 2024
- 4.4 Market outlook: Forecast for 2024-2029
- Chart on Global - Market size and forecast 2024-2029 ($ million)
- Data Table on Global - Market size and forecast 2024-2029 ($ million)
- Chart on Global Market: Year-over-year growth 2024-2029 (%)
- Data Table on Global Market: Year-over-year growth 2024-2029 (%)
5 Historic Market Size
- 5.1 Global Spasticity Treatment Market 2019 - 2023
- Historic Market Size - Data Table on Global Spasticity Treatment Market 2019 - 2023 ($ million)
- 5.2 Type segment analysis 2019 - 2023
- Historic Market Size - Type Segment 2019 - 2023 ($ million)
- 5.3 End-user segment analysis 2019 - 2023
- Historic Market Size - End-user Segment 2019 - 2023 ($ million)
- 5.4 Indication segment analysis 2019 - 2023
- Historic Market Size - Indication Segment 2019 - 2023 ($ million)
- 5.5 Route of Administration segment analysis 2019 - 2023
- Historic Market Size - Route of Administration Segment 2019 - 2023 ($ million)
- 5.6 Geography segment analysis 2019 - 2023
- Historic Market Size - Geography Segment 2019 - 2023 ($ million)
- 5.7 Country segment analysis 2019 - 2023
- Historic Market Size - Country Segment 2019 - 2023 ($ million)
6 Qualitative Analysis
- 6.1 Impact of AI on global spasticity treatment market
7 Five Forces Analysis
- 7.1 Five forces summary
- Five forces analysis - Comparison between 2024 and 2029
- 7.2 Bargaining power of buyers
- Bargaining power of buyers - Impact of key factors 2024 and 2029
- 7.3 Bargaining power of suppliers
- Bargaining power of suppliers - Impact of key factors in 2024 and 2029
- 7.4 Threat of new entrants
- Threat of new entrants - Impact of key factors in 2024 and 2029
- 7.5 Threat of substitutes
- Threat of substitutes - Impact of key factors in 2024 and 2029
- 7.6 Threat of rivalry
- Threat of rivalry - Impact of key factors in 2024 and 2029
- 7.7 Market condition
- Chart on Market condition - Five forces 2024 and 2029
8 Market Segmentation by Type
- 8.1 Market segments
- Chart on Type - Market share 2024-2029 (%)
- Data Table on Type - Market share 2024-2029 (%)
- 8.2 Comparison by Type
- Chart on Comparison by Type
- Data Table on Comparison by Type
- 8.3 Drug therapy - Market size and forecast 2024-2029
- Chart on Drug therapy - Market size and forecast 2024-2029 ($ million)
- Data Table on Drug therapy - Market size and forecast 2024-2029 ($ million)
- Chart on Drug therapy - Year-over-year growth 2024-2029 (%)
- Data Table on Drug therapy - Year-over-year growth 2024-2029 (%)
- 8.4 Physical therapy - Market size and forecast 2024-2029
- Chart on Physical therapy - Market size and forecast 2024-2029 ($ million)
- Data Table on Physical therapy - Market size and forecast 2024-2029 ($ million)
- Chart on Physical therapy - Year-over-year growth 2024-2029 (%)
- Data Table on Physical therapy - Year-over-year growth 2024-2029 (%)
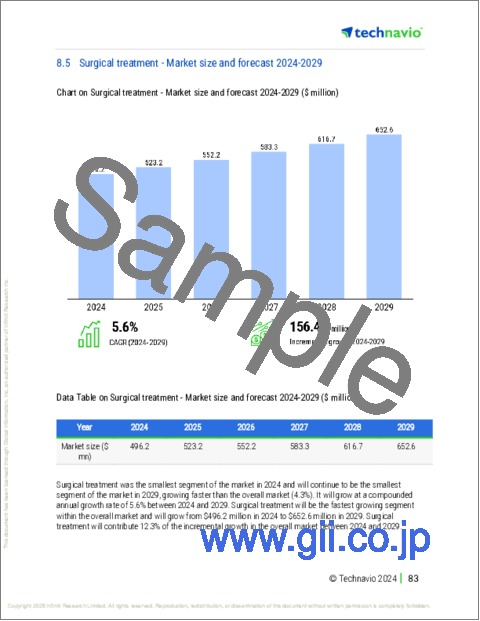
- 8.5 Surgical treatment - Market size and forecast 2024-2029
- Chart on Surgical treatment - Market size and forecast 2024-2029 ($ million)
- Data Table on Surgical treatment - Market size and forecast 2024-2029 ($ million)
- Chart on Surgical treatment - Year-over-year growth 2024-2029 (%)
- Data Table on Surgical treatment - Year-over-year growth 2024-2029 (%)
- 8.6 Market opportunity by Type
- Market opportunity by Type ($ million)
- Data Table on Market opportunity by Type ($ million)
9 Market Segmentation by End-user
- 9.1 Market segments
- Chart on End-user - Market share 2024-2029 (%)
- Data Table on End-user - Market share 2024-2029 (%)
- 9.2 Comparison by End-user
- Chart on Comparison by End-user
- Data Table on Comparison by End-user
- 9.3 Hospitals - Market size and forecast 2024-2029
- Chart on Hospitals - Market size and forecast 2024-2029 ($ million)
- Data Table on Hospitals - Market size and forecast 2024-2029 ($ million)
- Chart on Hospitals - Year-over-year growth 2024-2029 (%)
- Data Table on Hospitals - Year-over-year growth 2024-2029 (%)
- 9.4 Ambulatory surgical centers - Market size and forecast 2024-2029
- Chart on Ambulatory surgical centers - Market size and forecast 2024-2029 ($ million)
- Data Table on Ambulatory surgical centers - Market size and forecast 2024-2029 ($ million)
- Chart on Ambulatory surgical centers - Year-over-year growth 2024-2029 (%)
- Data Table on Ambulatory surgical centers - Year-over-year growth 2024-2029 (%)
- 9.5 Home care settings - Market size and forecast 2024-2029
- Chart on Home care settings - Market size and forecast 2024-2029 ($ million)
- Data Table on Home care settings - Market size and forecast 2024-2029 ($ million)
- Chart on Home care settings - Year-over-year growth 2024-2029 (%)
- Data Table on Home care settings - Year-over-year growth 2024-2029 (%)
- 9.6 Specialty clinics - Market size and forecast 2024-2029
- Chart on Specialty clinics - Market size and forecast 2024-2029 ($ million)
- Data Table on Specialty clinics - Market size and forecast 2024-2029 ($ million)
- Chart on Specialty clinics - Year-over-year growth 2024-2029 (%)
- Data Table on Specialty clinics - Year-over-year growth 2024-2029 (%)
- 9.7 Diagnostic centers - Market size and forecast 2024-2029
- Chart on Diagnostic centers - Market size and forecast 2024-2029 ($ million)
- Data Table on Diagnostic centers - Market size and forecast 2024-2029 ($ million)
- Chart on Diagnostic centers - Year-over-year growth 2024-2029 (%)
- Data Table on Diagnostic centers - Year-over-year growth 2024-2029 (%)
- 9.8 Market opportunity by End-user
- Market opportunity by End-user ($ million)
- Data Table on Market opportunity by End-user ($ million)
10 Market Segmentation by Indication
- 10.1 Market segments
- Chart on Indication - Market share 2024-2029 (%)
- Data Table on Indication - Market share 2024-2029 (%)
- 10.2 Comparison by Indication
- Chart on Comparison by Indication
- Data Table on Comparison by Indication
- 10.3 Cerebral palsy - Market size and forecast 2024-2029
- Chart on Cerebral palsy - Market size and forecast 2024-2029 ($ million)
- Data Table on Cerebral palsy - Market size and forecast 2024-2029 ($ million)
- Chart on Cerebral palsy - Year-over-year growth 2024-2029 (%)
- Data Table on Cerebral palsy - Year-over-year growth 2024-2029 (%)
- 10.4 Multiple sclerosis - Market size and forecast 2024-2029
- Chart on Multiple sclerosis - Market size and forecast 2024-2029 ($ million)
- Data Table on Multiple sclerosis - Market size and forecast 2024-2029 ($ million)
- Chart on Multiple sclerosis - Year-over-year growth 2024-2029 (%)
- Data Table on Multiple sclerosis - Year-over-year growth 2024-2029 (%)
- 10.5 Traumatic brain injury - Market size and forecast 2024-2029
- Chart on Traumatic brain injury - Market size and forecast 2024-2029 ($ million)
- Data Table on Traumatic brain injury - Market size and forecast 2024-2029 ($ million)
- Chart on Traumatic brain injury - Year-over-year growth 2024-2029 (%)
- Data Table on Traumatic brain injury - Year-over-year growth 2024-2029 (%)
- 10.6 Others - Market size and forecast 2024-2029
- Chart on Others - Market size and forecast 2024-2029 ($ million)
- Data Table on Others - Market size and forecast 2024-2029 ($ million)
- Chart on Others - Year-over-year growth 2024-2029 (%)
- Data Table on Others - Year-over-year growth 2024-2029 (%)
- 10.7 Market opportunity by Indication
- Market opportunity by Indication ($ million)
- Data Table on Market opportunity by Indication ($ million)
11 Market Segmentation by Route of Administration
- 11.1 Market segments
- Chart on Route of Administration - Market share 2024-2029 (%)
- Data Table on Route of Administration - Market share 2024-2029 (%)
- 11.2 Comparison by Route of Administration
- Chart on Comparison by Route of Administration
- Data Table on Comparison by Route of Administration
- 11.3 Oral - Market size and forecast 2024-2029
- Chart on Oral - Market size and forecast 2024-2029 ($ million)
- Data Table on Oral - Market size and forecast 2024-2029 ($ million)
- Chart on Oral - Year-over-year growth 2024-2029 (%)
- Data Table on Oral - Year-over-year growth 2024-2029 (%)
- 11.4 Parenteral - Market size and forecast 2024-2029
- Chart on Parenteral - Market size and forecast 2024-2029 ($ million)
- Data Table on Parenteral - Market size and forecast 2024-2029 ($ million)
- Chart on Parenteral - Year-over-year growth 2024-2029 (%)
- Data Table on Parenteral - Year-over-year growth 2024-2029 (%)
- 11.5 Market opportunity by Route of Administration
- Market opportunity by Route of Administration ($ million)
- Data Table on Market opportunity by Route of Administration ($ million)
12 Customer Landscape
- 12.1 Customer landscape overview
- Analysis of price sensitivity, lifecycle, customer purchase basket, adoption rates, and purchase criteria
13 Geographic Landscape
- 13.1 Geographic segmentation
- Chart on Market share By Geographical Landscape 2024-2029 (%)
- Data Table on Market share By Geographical Landscape 2024-2029 (%)
- 13.2 Geographic comparison
- Chart on Geographic comparison
- Data Table on Geographic comparison
- 13.3 North America - Market size and forecast 2024-2029
- Chart on North America - Market size and forecast 2024-2029 ($ million)
- Data Table on North America - Market size and forecast 2024-2029 ($ million)
- Chart on North America - Year-over-year growth 2024-2029 (%)
- Data Table on North America - Year-over-year growth 2024-2029 (%)
- 13.4 Europe - Market size and forecast 2024-2029
- Chart on Europe - Market size and forecast 2024-2029 ($ million)
- Data Table on Europe - Market size and forecast 2024-2029 ($ million)
- Chart on Europe - Year-over-year growth 2024-2029 (%)
- Data Table on Europe - Year-over-year growth 2024-2029 (%)
- 13.5 Asia - Market size and forecast 2024-2029
- Chart on Asia - Market size and forecast 2024-2029 ($ million)
- Data Table on Asia - Market size and forecast 2024-2029 ($ million)
- Chart on Asia - Year-over-year growth 2024-2029 (%)
- Data Table on Asia - Year-over-year growth 2024-2029 (%)
- 13.6 Rest of World (ROW) - Market size and forecast 2024-2029
- Chart on Rest of World (ROW) - Market size and forecast 2024-2029 ($ million)
- Data Table on Rest of World (ROW) - Market size and forecast 2024-2029 ($ million)
- Chart on Rest of World (ROW) - Year-over-year growth 2024-2029 (%)
- Data Table on Rest of World (ROW) - Year-over-year growth 2024-2029 (%)
- 13.7 US - Market size and forecast 2024-2029
- Chart on US - Market size and forecast 2024-2029 ($ million)
- Data Table on US - Market size and forecast 2024-2029 ($ million)
- Chart on US - Year-over-year growth 2024-2029 (%)
- Data Table on US - Year-over-year growth 2024-2029 (%)
- 13.8 Germany - Market size and forecast 2024-2029
- Chart on Germany - Market size and forecast 2024-2029 ($ million)
- Data Table on Germany - Market size and forecast 2024-2029 ($ million)
- Chart on Germany - Year-over-year growth 2024-2029 (%)
- Data Table on Germany - Year-over-year growth 2024-2029 (%)
- 13.9 Canada - Market size and forecast 2024-2029
- Chart on Canada - Market size and forecast 2024-2029 ($ million)
- Data Table on Canada - Market size and forecast 2024-2029 ($ million)
- Chart on Canada - Year-over-year growth 2024-2029 (%)
- Data Table on Canada - Year-over-year growth 2024-2029 (%)
- 13.10 China - Market size and forecast 2024-2029
- Chart on China - Market size and forecast 2024-2029 ($ million)
- Data Table on China - Market size and forecast 2024-2029 ($ million)
- Chart on China - Year-over-year growth 2024-2029 (%)
- Data Table on China - Year-over-year growth 2024-2029 (%)
- 13.11 UK - Market size and forecast 2024-2029
- Chart on UK - Market size and forecast 2024-2029 ($ million)
- Data Table on UK - Market size and forecast 2024-2029 ($ million)
- Chart on UK - Year-over-year growth 2024-2029 (%)
- Data Table on UK - Year-over-year growth 2024-2029 (%)
- 13.12 Japan - Market size and forecast 2024-2029
- Chart on Japan - Market size and forecast 2024-2029 ($ million)
- Data Table on Japan - Market size and forecast 2024-2029 ($ million)
- Chart on Japan - Year-over-year growth 2024-2029 (%)
- Data Table on Japan - Year-over-year growth 2024-2029 (%)
- 13.13 France - Market size and forecast 2024-2029
- Chart on France - Market size and forecast 2024-2029 ($ million)
- Data Table on France - Market size and forecast 2024-2029 ($ million)
- Chart on France - Year-over-year growth 2024-2029 (%)
- Data Table on France - Year-over-year growth 2024-2029 (%)
- 13.14 India - Market size and forecast 2024-2029
- Chart on India - Market size and forecast 2024-2029 ($ million)
- Data Table on India - Market size and forecast 2024-2029 ($ million)
- Chart on India - Year-over-year growth 2024-2029 (%)
- Data Table on India - Year-over-year growth 2024-2029 (%)
- 13.15 Italy - Market size and forecast 2024-2029
- Chart on Italy - Market size and forecast 2024-2029 ($ million)
- Data Table on Italy - Market size and forecast 2024-2029 ($ million)
- Chart on Italy - Year-over-year growth 2024-2029 (%)
- Data Table on Italy - Year-over-year growth 2024-2029 (%)
- 13.16 South Korea - Market size and forecast 2024-2029
- Chart on South Korea - Market size and forecast 2024-2029 ($ million)
- Data Table on South Korea - Market size and forecast 2024-2029 ($ million)
- Chart on South Korea - Year-over-year growth 2024-2029 (%)
- Data Table on South Korea - Year-over-year growth 2024-2029 (%)
- 13.17 Market opportunity By Geographical Landscape
- Market opportunity By Geographical Landscape ($ million)
- Data Tables on Market opportunity By Geographical Landscape ($ million)
14 Drivers, Challenges, and Opportunity/Restraints
- 14.1 Market drivers
- 14.2 Market challenges
- 14.3 Impact of drivers and challenges
- Impact of drivers and challenges in 2024 and 2029
- 14.4 Market opportunities/restraints
15 Competitive Landscape
- 15.1 Overview
- 15.2 Competitive Landscape
- Overview on criticality of inputs and factors of differentiation
- 15.3 Landscape disruption
- Overview on factors of disruption
- 15.4 Industry risks
- Impact of key risks on business
16 Competitive Analysis
- 16.1 Companies profiled
- Companies covered
- 16.2 Company ranking index
- Company ranking index
- 16.3 Market positioning of companies
- Matrix on companies position and classification
- 16.4 Abbott Laboratories
- Abbott Laboratories - Overview
- Abbott Laboratories - Business segments
- Abbott Laboratories - Key news
- Abbott Laboratories - Key offerings
- Abbott Laboratories - Segment focus
- SWOT
- 16.5 Axonics Inc.
- Axonics Inc. - Overview
- Axonics Inc. - Business segments
- Axonics Inc. - Key offerings
- Axonics Inc. - Segment focus
- SWOT
- 16.6 Boston Scientific Corp.
- Boston Scientific Corp. - Overview
- Boston Scientific Corp. - Business segments
- Boston Scientific Corp. - Key news
- Boston Scientific Corp. - Key offerings
- Boston Scientific Corp. - Segment focus
- SWOT
- 16.7 BrainsWay Ltd.
- BrainsWay Ltd. - Overview
- BrainsWay Ltd. - Product / Service
- BrainsWay Ltd. - Key offerings
- SWOT
- 16.8 electroCore Inc.
- electroCore Inc. - Overview
- electroCore Inc. - Product / Service
- electroCore Inc. - Key offerings
- SWOT
- 16.9 LivaNova PLC
- LivaNova PLC - Overview
- LivaNova PLC - Business segments
- LivaNova PLC - Key news
- LivaNova PLC - Key offerings
- LivaNova PLC - Segment focus
- SWOT
- 16.10 Medtronic Plc
- Medtronic Plc - Overview
- Medtronic Plc - Business segments
- Medtronic Plc - Key news
- Medtronic Plc - Key offerings
- Medtronic Plc - Segment focus
- SWOT
- 16.11 NEURONETICS Inc.
- NEURONETICS Inc. - Overview
- NEURONETICS Inc. - Product / Service
- NEURONETICS Inc. - Key offerings
- SWOT
- 16.12 Nevro Corp.
- Nevro Corp. - Overview
- Nevro Corp. - Product / Service
- Nevro Corp. - Key offerings
- SWOT
- 16.13 OMRON Corp.
- OMRON Corp. - Overview
- OMRON Corp. - Business segments
- OMRON Corp. - Key news
- OMRON Corp. - Key offerings
- OMRON Corp. - Segment focus
- SWOT
- 16.14 PathMaker Neurosystems Inc.
- PathMaker Neurosystems Inc. - Overview
- PathMaker Neurosystems Inc. - Product / Service
- PathMaker Neurosystems Inc. - Key offerings
- SWOT
- 16.15 Saebo
- Saebo - Overview
- Saebo - Product / Service
- Saebo - Key offerings
- SWOT
- 16.16 Saluda Medical Pty Ltd.
- Saluda Medical Pty Ltd. - Overview
- Saluda Medical Pty Ltd. - Product / Service
- Saluda Medical Pty Ltd. - Key offerings
- SWOT
- 16.17 ShiraTronics
- ShiraTronics - Overview
- ShiraTronics - Product / Service
- ShiraTronics - Key offerings
- SWOT
- 16.18 Theranica Bio Electronics Ltd.
- Theranica Bio Electronics Ltd. - Overview
- Theranica Bio Electronics Ltd. - Product / Service
- Theranica Bio Electronics Ltd. - Key offerings
- SWOT
17 Appendix
- 17.1 Scope of the report
- 17.2 Inclusions and exclusions checklist
- Inclusions checklist
- Exclusions checklist
- 17.3 Currency conversion rates for US$
- Currency conversion rates for US$
- 17.4 Research methodology
- Research methodology
- 17.5 Data procurement
- Information sources
- 17.6 Data validation
- Data validation
- 17.7 Validation techniques employed for market sizing
- Validation techniques employed for market sizing
- 17.8 Data synthesis
- Data synthesis
- 17.9 360 degree market analysis
- 360 degree market analysis
- 17.10 List of abbreviations
- List of abbreviations

