|
|
市場調査レポート
商品コード
1502466
電動ファン付き呼吸用保護具の世界市場 2024-2028Global powered air purifying respirator market 2024-2028 |
||||||
|
|||||||
カスタマイズ可能
|
|||||||


| 電動ファン付き呼吸用保護具の世界市場 2024-2028 |
|
出版日: 2024年05月17日
発行: TechNavio
ページ情報: 英文 173 Pages
納期: 即納可能
|

全表示
- 概要
- 図表
- 目次
Technavio社は、電動ファン付き呼吸用保護具市場をモニターしており、2023年から2028年にかけて16億9,650万米ドル、予測期間中のCAGRは10.51%で成長すると予測しています。
当レポートでは、電動ファン付き呼吸用保護具市場の全体的な分析、市場規模・予測、動向、成長促進要因、課題、約25のベンダーを網羅したベンダー分析などを掲載しています。
現在の市場シナリオ、最新動向と促進要因、市場環境全体に関する最新分析を提供しています。市場は、エンドユーザー産業の成長、ニオッシュ認証PAPRの入手可能性の上昇、業界標準に準拠したPAPRの製造への注目の高まりによって牽引されています。
| 市場範囲 | |
|---|---|
| 基準年 | 2024 |
| 終了年 | 2028 |
| 予測期間 | 2024-2028 |
| 成長モメンタム | 加速 |
| 前年比2024年 | 9.25% |
| CAGR | 10.51% |
| 増分額 | 16億9,650万米ドル |
本調査では、今後数年間の電動ファン付き呼吸用保護具市場成長を牽引する主要因の1つとして、緊急管理への注目の高まりを挙げています。また、PAPRの改良された機能の流入とモジュラーPAPRの採用増加が市場の大きな需要につながります。
目次
第1章 エグゼクティブサマリー
- 市場概要
第2章 市場情勢
- 市場エコシステム
- 市場の特徴
- バリューチェーン分析
第3章 市場規模の評価
- 市場の定義
- 市場セグメント分析
- 市場規模 2023
- 市場の見通し 2023-2028
第4章 市場規模実績
- 世界の電動ファン付き呼吸用保護具市場 2018-2022
- 製品別セグメント分析 2018-2022
- 用途別セグメント分析 2018-2022
- 地域別セグメント分析 2018-2022
- 国別セグメント分析 2018-2022
第5章 ファイブフォース分析
- ファイブフォースの要約
- 買い手の交渉力
- 供給企業の交渉力
- 新規参入業者の脅威
- 代替品の脅威
- 競争の脅威
- 市況
第6章 市場セグメンテーション:製品別
- 市場セグメンテーション
- 比較:製品別
- フルフェイスマスクPAPR:市場規模と予測 2023-2028
- 半面マスクPAPR:市場規模と予測 2023-2028
- ヘルメットのフードとバイザー:市場規模と予測 2023-2028
- 市場機会:製品別
第7章 市場セグメンテーション:用途別
- 市場セグメンテーション
- 比較:用途別
- 産業:市場規模と予測 2023-2028
- 医薬品およびヘルスケア:市場規模と予測 2023-2028
- 石油・ガス:市場規模と予測 2023-2028
- その他:市場規模と予測 2023-2028
- 市場機会:用途別
第8章 顧客情勢
- 顧客情勢の概要
第9章 地域別情勢
- 地域別セグメンテーション
- 地域別比較
- 北米:市場規模と予測 2023-2028
- 欧州:市場規模と予測 2023-2028
- アジア太平洋:市場規模と予測 2023-2028
- 南米:市場規模と予測 2023-2028
- 中東・アフリカ:市場規模と予測 2023-2028
- 米国:市場規模と予測 2023-2028
- 中国:市場規模と予測 2023-2028
- ドイツ:市場規模と予測 2023-2028
- 英国:市場規模と予測 2023-2028
- カナダ:市場規模と予測 2023-2028
- 市場機会:地域情勢別
第10章 促進要因・課題・機会・抑制要因
- 市場促進要因
- 市場の課題
- 促進要因と課題の影響
- 市場の機会・抑制要因
第11章 競合情勢
- 概要
- 競合情勢
- 混乱の状況
- 業界のリスク
第12章 競合分析
- 企業プロファイル
- 企業の市場ポジショニング
- Allegro Industries
- Avon Polymer Products Ltd.
- Bullard
- Dragerwerk AG and Co. KGaA
- Gentex Corp.
- Honeywell International Inc.
- ILC Dover LP
- Miller Electric Manufacturing Co.
- MSA Safety Inc.
- Optrel AG
- RSG Safety BV
- SHIGEMATSU WORKS CO. LTD.
- Sundstrom Safety AB
- VENUS Safety and Health Pvt. Ltd.
第13章 付録
Exhibits:
- Exhibits1: Executive Summary - Chart on Market Overview
- Exhibits2: Executive Summary - Data Table on Market Overview
- Exhibits3: Executive Summary - Chart on Global Market Characteristics
- Exhibits4: Executive Summary - Chart on Market By Geographical Landscape
- Exhibits5: Executive Summary - Chart on Market Segmentation by Product
- Exhibits6: Executive Summary - Chart on Market Segmentation by Application
- Exhibits7: Executive Summary - Chart on Incremental Growth
- Exhibits8: Executive Summary - Data Table on Incremental Growth
- Exhibits9: Executive Summary - Chart on Company Market Positioning
- Exhibits10: Parent Market
- Exhibits11: Data Table on - Parent Market
- Exhibits12: Market characteristics analysis
- Exhibits13: Value Chain Analysis
- Exhibits14: Offerings of companies included in the market definition
- Exhibits15: Market segments
- Exhibits16: Chart on Global - Market size and forecast 2023-2028 ($ million)
- Exhibits17: Data Table on Global - Market size and forecast 2023-2028 ($ million)
- Exhibits18: Chart on Global Market: Year-over-year growth 2023-2028 (%)
- Exhibits19: Data Table on Global Market: Year-over-year growth 2023-2028 (%)
- Exhibits20: Historic Market Size - Data Table on Global Powered Air Purifying Respirator Market 2018 - 2022 ($ million)
- Exhibits21: Historic Market Size - Product Segment 2018 - 2022 ($ million)
- Exhibits22: Historic Market Size - Application Segment 2018 - 2022 ($ million)
- Exhibits23: Historic Market Size - Geography Segment 2018 - 2022 ($ million)
- Exhibits24: Historic Market Size - Country Segment 2018 - 2022 ($ million)
- Exhibits25: Five forces analysis - Comparison between 2023 and 2028
- Exhibits26: Bargaining power of buyers - Impact of key factors 2023 and 2028
- Exhibits27: Bargaining power of suppliers - Impact of key factors in 2023 and 2028
- Exhibits28: Threat of new entrants - Impact of key factors in 2023 and 2028
- Exhibits29: Threat of substitutes - Impact of key factors in 2023 and 2028
- Exhibits30: Threat of rivalry - Impact of key factors in 2023 and 2028
- Exhibits31: Chart on Market condition - Five forces 2023 and 2028
- Exhibits32: Chart on Product - Market share 2023-2028 (%)
- Exhibits33: Data Table on Product - Market share 2023-2028 (%)
- Exhibits34: Chart on Comparison by Product
- Exhibits35: Data Table on Comparison by Product
- Exhibits36: Chart on Full-face mask PAPR - Market size and forecast 2023-2028 ($ million)
- Exhibits37: Data Table on Full-face mask PAPR - Market size and forecast 2023-2028 ($ million)
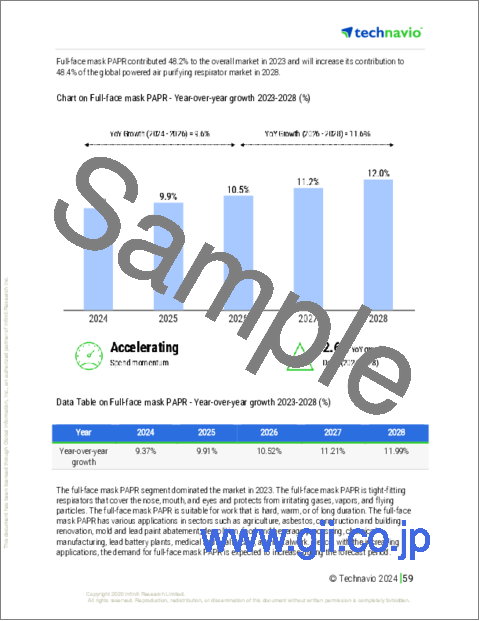
- Exhibits38: Chart on Full-face mask PAPR - Year-over-year growth 2023-2028 (%)
- Exhibits39: Data Table on Full-face mask PAPR - Year-over-year growth 2023-2028 (%)
- Exhibits40: Chart on Half-mask PAPR - Market size and forecast 2023-2028 ($ million)
- Exhibits41: Data Table on Half-mask PAPR - Market size and forecast 2023-2028 ($ million)
- Exhibits42: Chart on Half-mask PAPR - Year-over-year growth 2023-2028 (%)
- Exhibits43: Data Table on Half-mask PAPR - Year-over-year growth 2023-2028 (%)
- Exhibits44: Chart on Helmets hoods and visors - Market size and forecast 2023-2028 ($ million)
- Exhibits45: Data Table on Helmets hoods and visors - Market size and forecast 2023-2028 ($ million)
- Exhibits46: Chart on Helmets hoods and visors - Year-over-year growth 2023-2028 (%)
- Exhibits47: Data Table on Helmets hoods and visors - Year-over-year growth 2023-2028 (%)
- Exhibits48: Market opportunity by Product ($ million)
- Exhibits49: Data Table on Market opportunity by Product ($ million)
- Exhibits50: Chart on Application - Market share 2023-2028 (%)
- Exhibits51: Data Table on Application - Market share 2023-2028 (%)
- Exhibits52: Chart on Comparison by Application
- Exhibits53: Data Table on Comparison by Application
- Exhibits54: Chart on Industrial - Market size and forecast 2023-2028 ($ million)
- Exhibits55: Data Table on Industrial - Market size and forecast 2023-2028 ($ million)
- Exhibits56: Chart on Industrial - Year-over-year growth 2023-2028 (%)
- Exhibits57: Data Table on Industrial - Year-over-year growth 2023-2028 (%)
- Exhibits58: Chart on Pharmaceutical and healthcare - Market size and forecast 2023-2028 ($ million)
- Exhibits59: Data Table on Pharmaceutical and healthcare - Market size and forecast 2023-2028 ($ million)
- Exhibits60: Chart on Pharmaceutical and healthcare - Year-over-year growth 2023-2028 (%)
- Exhibits61: Data Table on Pharmaceutical and healthcare - Year-over-year growth 2023-2028 (%)
- Exhibits62: Chart on Oil and gas - Market size and forecast 2023-2028 ($ million)
- Exhibits63: Data Table on Oil and gas - Market size and forecast 2023-2028 ($ million)
- Exhibits64: Chart on Oil and gas - Year-over-year growth 2023-2028 (%)
- Exhibits65: Data Table on Oil and gas - Year-over-year growth 2023-2028 (%)
- Exhibits66: Chart on Others - Market size and forecast 2023-2028 ($ million)
- Exhibits67: Data Table on Others - Market size and forecast 2023-2028 ($ million)
- Exhibits68: Chart on Others - Year-over-year growth 2023-2028 (%)
- Exhibits69: Data Table on Others - Year-over-year growth 2023-2028 (%)
- Exhibits70: Market opportunity by Application ($ million)
- Exhibits71: Data Table on Market opportunity by Application ($ million)
- Exhibits72: Analysis of price sensitivity, lifecycle, customer purchase basket, adoption rates, and purchase criteria
- Exhibits73: Chart on Market share By Geographical Landscape 2023-2028 (%)
- Exhibits74: Data Table on Market share By Geographical Landscape 2023-2028 (%)
- Exhibits75: Chart on Geographic comparison
- Exhibits76: Data Table on Geographic comparison
- Exhibits77: Chart on North America - Market size and forecast 2023-2028 ($ million)
- Exhibits78: Data Table on North America - Market size and forecast 2023-2028 ($ million)
- Exhibits79: Chart on North America - Year-over-year growth 2023-2028 (%)
- Exhibits80: Data Table on North America - Year-over-year growth 2023-2028 (%)
- Exhibits81: Chart on Europe - Market size and forecast 2023-2028 ($ million)
- Exhibits82: Data Table on Europe - Market size and forecast 2023-2028 ($ million)
- Exhibits83: Chart on Europe - Year-over-year growth 2023-2028 (%)
- Exhibits84: Data Table on Europe - Year-over-year growth 2023-2028 (%)
- Exhibits85: Chart on APAC - Market size and forecast 2023-2028 ($ million)
- Exhibits86: Data Table on APAC - Market size and forecast 2023-2028 ($ million)
- Exhibits87: Chart on APAC - Year-over-year growth 2023-2028 (%)
- Exhibits88: Data Table on APAC - Year-over-year growth 2023-2028 (%)
- Exhibits89: Chart on South America - Market size and forecast 2023-2028 ($ million)
- Exhibits90: Data Table on South America - Market size and forecast 2023-2028 ($ million)
- Exhibits91: Chart on South America - Year-over-year growth 2023-2028 (%)
- Exhibits92: Data Table on South America - Year-over-year growth 2023-2028 (%)
- Exhibits93: Chart on Middle East and Africa - Market size and forecast 2023-2028 ($ million)
- Exhibits94: Data Table on Middle East and Africa - Market size and forecast 2023-2028 ($ million)
- Exhibits95: Chart on Middle East and Africa - Year-over-year growth 2023-2028 (%)
- Exhibits96: Data Table on Middle East and Africa - Year-over-year growth 2023-2028 (%)
- Exhibits97: Chart on US - Market size and forecast 2023-2028 ($ million)
- Exhibits98: Data Table on US - Market size and forecast 2023-2028 ($ million)
- Exhibits99: Chart on US - Year-over-year growth 2023-2028 (%)
- Exhibits100: Data Table on US - Year-over-year growth 2023-2028 (%)
- Exhibits101: Chart on China - Market size and forecast 2023-2028 ($ million)
- Exhibits102: Data Table on China - Market size and forecast 2023-2028 ($ million)
- Exhibits103: Chart on China - Year-over-year growth 2023-2028 (%)
- Exhibits104: Data Table on China - Year-over-year growth 2023-2028 (%)
- Exhibits105: Chart on Germany - Market size and forecast 2023-2028 ($ million)
- Exhibits106: Data Table on Germany - Market size and forecast 2023-2028 ($ million)
- Exhibits107: Chart on Germany - Year-over-year growth 2023-2028 (%)
- Exhibits108: Data Table on Germany - Year-over-year growth 2023-2028 (%)
- Exhibits109: Chart on UK - Market size and forecast 2023-2028 ($ million)
- Exhibits110: Data Table on UK - Market size and forecast 2023-2028 ($ million)
- Exhibits111: Chart on UK - Year-over-year growth 2023-2028 (%)
- Exhibits112: Data Table on UK - Year-over-year growth 2023-2028 (%)
- Exhibits113: Chart on Canada - Market size and forecast 2023-2028 ($ million)
- Exhibits114: Data Table on Canada - Market size and forecast 2023-2028 ($ million)
- Exhibits115: Chart on Canada - Year-over-year growth 2023-2028 (%)
- Exhibits116: Data Table on Canada - Year-over-year growth 2023-2028 (%)
- Exhibits117: Market opportunity By Geographical Landscape ($ million)
- Exhibits118: Data Tables on Market opportunity By Geographical Landscape ($ million)
- Exhibits119: Impact of drivers and challenges in 2023 and 2028
- Exhibits120: Overview on criticality of inputs and factors of differentiation
- Exhibits121: Overview on factors of disruption
- Exhibits122: Impact of key risks on business
- Exhibits123: Companies covered
- Exhibits124: Matrix on companies position and classification
- Exhibits125: 3M Co. - Overview
- Exhibits126: 3M Co. - Business segments
- Exhibits127: 3M Co. - Key news
- Exhibits128: 3M Co. - Key offerings
- Exhibits129: 3M Co. - Segment focus
- Exhibits130: Allegro Industries - Overview
- Exhibits131: Allegro Industries - Product / Service
- Exhibits132: Allegro Industries - Key offerings
- Exhibits133: Avon Polymer Products Ltd. - Overview
- Exhibits134: Avon Polymer Products Ltd. - Product / Service
- Exhibits135: Avon Polymer Products Ltd. - Key offerings
- Exhibits136: Bullard - Overview
- Exhibits137: Bullard - Product / Service
- Exhibits138: Bullard - Key offerings
- Exhibits139: Dragerwerk AG and Co. KGaA - Overview
- Exhibits140: Dragerwerk AG and Co. KGaA - Business segments
- Exhibits141: Dragerwerk AG and Co. KGaA - Key offerings
- Exhibits142: Dragerwerk AG and Co. KGaA - Segment focus
- Exhibits143: Gentex Corp. - Overview
- Exhibits144: Gentex Corp. - Product / Service
- Exhibits145: Gentex Corp. - Key offerings
- Exhibits146: Honeywell International Inc. - Overview
- Exhibits147: Honeywell International Inc. - Business segments
- Exhibits148: Honeywell International Inc. - Key news
- Exhibits149: Honeywell International Inc. - Key offerings
- Exhibits150: Honeywell International Inc. - Segment focus
- Exhibits151: ILC Dover LP - Overview
- Exhibits152: ILC Dover LP - Key offerings
- Exhibits153: Miller Electric Manufacturing Co. - Overview
- Exhibits154: Miller Electric Manufacturing Co. - Product / Service
- Exhibits155: Miller Electric Manufacturing Co. - Key offerings
- Exhibits156: MSA Safety Inc. - Overview
- Exhibits157: MSA Safety Inc. - Business segments
- Exhibits158: MSA Safety Inc. - Key news
- Exhibits159: MSA Safety Inc. - Key offerings
- Exhibits160: MSA Safety Inc. - Segment focus
- Exhibits161: Optrel AG - Overview
- Exhibits162: Optrel AG - Product / Service
- Exhibits163: Optrel AG - Key offerings
- Exhibits164: RSG Safety BV - Overview
- Exhibits165: RSG Safety BV - Product / Service
- Exhibits166: RSG Safety BV - Key offerings
- Exhibits167: SHIGEMATSU WORKS CO. LTD. - Overview
- Exhibits168: SHIGEMATSU WORKS CO. LTD. - Product / Service
- Exhibits169: SHIGEMATSU WORKS CO. LTD. - Key offerings
- Exhibits170: Sundstrom Safety AB - Overview
- Exhibits171: Sundstrom Safety AB - Product / Service
- Exhibits172: Sundstrom Safety AB - Key offerings
- Exhibits173: VENUS Safety and Health Pvt. Ltd. - Overview
- Exhibits174: VENUS Safety and Health Pvt. Ltd. - Product / Service
- Exhibits175: VENUS Safety and Health Pvt. Ltd. - Key offerings
- Exhibits176: Inclusions checklist
- Exhibits177: Exclusions checklist
- Exhibits178: Currency conversion rates for US$
- Exhibits179: Research methodology
- Exhibits180: Information sources
- Exhibits181: Data validation
- Exhibits182: Validation techniques employed for market sizing
- Exhibits183: Data synthesis
- Exhibits184: 360 degree market analysis
- Exhibits185: List of abbreviations
Technavio has been monitoring the powered air purifying respirator market and is forecast to grow by USD 1696.5 mn during 2023-2028, accelerating at a CAGR of 10.51% during the forecast period. Our report on the powered air purifying respirator market provides a holistic analysis, market size and forecast, trends, growth drivers, and challenges, as well as vendor analysis covering around 25 vendors.
The report offers an up-to-date analysis regarding the current market scenario, the latest trends and drivers, and the overall market environment. The market is driven by growth of end-user industries, rise in availability of niosh-approved PAPR, and increased focus on manufacturing PAPR in compliance with industry standards.
Technavio's powered air purifying respirator market is segmented as below:
| Market Scope | |
|---|---|
| Base Year | 2024 |
| End Year | 2028 |
| Series Year | 2024-2028 |
| Growth Momentum | Accelerate |
| YOY 2024 | 9.25% |
| CAGR | 10.51% |
| Incremental Value | $1696.5mn |
By Product
- Full-face mask PAPR
- Half-mask PAPR
- Helmets hoods and visors
By Application
- Industrial
- Pharmaceutical and healthcare
- Oil and gas
- Others
By Geographical Landscape
- North America
- Europe
- APAC
- South America
- Middle East and Africa
This study identifies the increasing focus on emergency management as one of the prime reasons driving the powered air purifying respirator market growth during the next few years. Also, influx of improved features in papr and rise in adoption of modular PAPR will lead to sizable demand in the market.
Technavio presents a detailed picture of the market by the way of study, synthesis, and summation of data from multiple sources by an analysis of key parameters. Our report on the powered air purifying respirator market covers the following areas:
- Powered air purifying respirator market sizing
- Powered air purifying respirator market forecast
- Powered air purifying respirator market industry analysis
Technavio's robust vendor analysis is designed to help clients improve their market position, and in line with this, this report provides a detailed analysis of several leading powered air purifying respirator market vendors that include 3M Co., Allegro Industries, Avon Polymer Products Ltd., Bullard, CleanSpace Technology Pty Ltd, Dragerwerk AG and Co. KGaA, Gentex Corp., Honeywell International Inc., ILC Dover LP, Irillic Pvt. Ltd., Jupiter Surface Technologies, Miller Electric Manufacturing Co., MSA Safety Inc., National Safety Solution, Optrel AG, RSG Safety BV, SHIGEMATSU WORKS CO. LTD., Sundstrom Safety AB, VENUS Safety and Health Pvt. Ltd., and Zeotech AB. Also, the powered air purifying respirator market analysis report includes information on upcoming trends and challenges that will influence market growth. This is to help companies strategize and leverage all forthcoming growth opportunities.
The study was conducted using an objective combination of primary and secondary information including inputs from key participants in the industry. The report contains a comprehensive market and vendor landscape in addition to an analysis of the key vendors.
Technavio presents a detailed picture of the market by the way of study, synthesis, and summation of data from multiple sources by an analysis of key parameters such as profit, pricing, competition, and promotions. It presents various market facets by identifying the key industry influencers. The data presented is comprehensive, reliable, and a result of extensive research - both primary and secondary. Technavio's market research reports provide a complete competitive landscape and an in-depth vendor selection methodology and analysis using qualitative and quantitative research to forecast accurate market growth.
Table of Contents
1 Executive Summary
- 1.1 Market overview
- Executive Summary - Chart on Market Overview
- Executive Summary - Data Table on Market Overview
- Executive Summary - Chart on Global Market Characteristics
- Executive Summary - Chart on Market By Geographical Landscape
- Executive Summary - Chart on Market Segmentation by Product
- Executive Summary - Chart on Market Segmentation by Application
- Executive Summary - Chart on Incremental Growth
- Executive Summary - Data Table on Incremental Growth
- Executive Summary - Chart on Company Market Positioning
2 Market Landscape
- 2.1 Market ecosystem
- Parent Market
- Data Table on - Parent Market
- 2.2 Market characteristics
- Market characteristics analysis
- 2.3 Value chain analysis
- Value Chain Analysis
3 Market Sizing
- 3.1 Market definition
- Offerings of companies included in the market definition
- 3.2 Market segment analysis
- Market segments
- 3.3 Market size 2023
- 3.4 Market outlook: Forecast for 2023-2028
- Chart on Global - Market size and forecast 2023-2028 ($ million)
- Data Table on Global - Market size and forecast 2023-2028 ($ million)
- Chart on Global Market: Year-over-year growth 2023-2028 (%)
- Data Table on Global Market: Year-over-year growth 2023-2028 (%)
4 Historic Market Size
- 4.1 Global Powered Air Purifying Respirator Market 2018 - 2022
- Historic Market Size - Data Table on Global Powered Air Purifying Respirator Market 2018 - 2022 ($ million)
- 4.2 Product segment analysis 2018 - 2022
- Historic Market Size - Product Segment 2018 - 2022 ($ million)
- 4.3 Application segment analysis 2018 - 2022
- Historic Market Size - Application Segment 2018 - 2022 ($ million)
- 4.4 Geography segment analysis 2018 - 2022
- Historic Market Size - Geography Segment 2018 - 2022 ($ million)
- 4.5 Country segment analysis 2018 - 2022
- Historic Market Size - Country Segment 2018 - 2022 ($ million)
5 Five Forces Analysis
- 5.1 Five forces summary
- Five forces analysis - Comparison between 2023 and 2028
- 5.2 Bargaining power of buyers
- Bargaining power of buyers - Impact of key factors 2023 and 2028
- 5.3 Bargaining power of suppliers
- Bargaining power of suppliers - Impact of key factors in 2023 and 2028
- 5.4 Threat of new entrants
- Threat of new entrants - Impact of key factors in 2023 and 2028
- 5.5 Threat of substitutes
- Threat of substitutes - Impact of key factors in 2023 and 2028
- 5.6 Threat of rivalry
- Threat of rivalry - Impact of key factors in 2023 and 2028
- 5.7 Market condition
- Chart on Market condition - Five forces 2023 and 2028
6 Market Segmentation by Product
- 6.1 Market segments
- Chart on Product - Market share 2023-2028 (%)
- Data Table on Product - Market share 2023-2028 (%)
- 6.2 Comparison by Product
- Chart on Comparison by Product
- Data Table on Comparison by Product
- 6.3 Full-face mask PAPR - Market size and forecast 2023-2028
- Chart on Full-face mask PAPR - Market size and forecast 2023-2028 ($ million)
- Data Table on Full-face mask PAPR - Market size and forecast 2023-2028 ($ million)
- Chart on Full-face mask PAPR - Year-over-year growth 2023-2028 (%)
- Data Table on Full-face mask PAPR - Year-over-year growth 2023-2028 (%)
- 6.4 Half-mask PAPR - Market size and forecast 2023-2028
- Chart on Half-mask PAPR - Market size and forecast 2023-2028 ($ million)
- Data Table on Half-mask PAPR - Market size and forecast 2023-2028 ($ million)
- Chart on Half-mask PAPR - Year-over-year growth 2023-2028 (%)
- Data Table on Half-mask PAPR - Year-over-year growth 2023-2028 (%)
- 6.5 Helmets hoods and visors - Market size and forecast 2023-2028
- Chart on Helmets hoods and visors - Market size and forecast 2023-2028 ($ million)
- Data Table on Helmets hoods and visors - Market size and forecast 2023-2028 ($ million)
- Chart on Helmets hoods and visors - Year-over-year growth 2023-2028 (%)
- Data Table on Helmets hoods and visors - Year-over-year growth 2023-2028 (%)
- 6.6 Market opportunity by Product
- Market opportunity by Product ($ million)
- Data Table on Market opportunity by Product ($ million)
7 Market Segmentation by Application
- 7.1 Market segments
- Chart on Application - Market share 2023-2028 (%)
- Data Table on Application - Market share 2023-2028 (%)
- 7.2 Comparison by Application
- Chart on Comparison by Application
- Data Table on Comparison by Application
- 7.3 Industrial - Market size and forecast 2023-2028
- Chart on Industrial - Market size and forecast 2023-2028 ($ million)
- Data Table on Industrial - Market size and forecast 2023-2028 ($ million)
- Chart on Industrial - Year-over-year growth 2023-2028 (%)
- Data Table on Industrial - Year-over-year growth 2023-2028 (%)
- 7.4 Pharmaceutical and healthcare - Market size and forecast 2023-2028
- Chart on Pharmaceutical and healthcare - Market size and forecast 2023-2028 ($ million)
- Data Table on Pharmaceutical and healthcare - Market size and forecast 2023-2028 ($ million)
- Chart on Pharmaceutical and healthcare - Year-over-year growth 2023-2028 (%)
- Data Table on Pharmaceutical and healthcare - Year-over-year growth 2023-2028 (%)
- 7.5 Oil and gas - Market size and forecast 2023-2028
- Chart on Oil and gas - Market size and forecast 2023-2028 ($ million)
- Data Table on Oil and gas - Market size and forecast 2023-2028 ($ million)
- Chart on Oil and gas - Year-over-year growth 2023-2028 (%)
- Data Table on Oil and gas - Year-over-year growth 2023-2028 (%)
- 7.6 Others - Market size and forecast 2023-2028
- Chart on Others - Market size and forecast 2023-2028 ($ million)
- Data Table on Others - Market size and forecast 2023-2028 ($ million)
- Chart on Others - Year-over-year growth 2023-2028 (%)
- Data Table on Others - Year-over-year growth 2023-2028 (%)
- 7.7 Market opportunity by Application
- Market opportunity by Application ($ million)
- Data Table on Market opportunity by Application ($ million)
8 Customer Landscape
- 8.1 Customer landscape overview
- Analysis of price sensitivity, lifecycle, customer purchase basket, adoption rates, and purchase criteria
9 Geographic Landscape
- 9.1 Geographic segmentation
- Chart on Market share By Geographical Landscape 2023-2028 (%)
- Data Table on Market share By Geographical Landscape 2023-2028 (%)
- 9.2 Geographic comparison
- Chart on Geographic comparison
- Data Table on Geographic comparison
- 9.3 North America - Market size and forecast 2023-2028
- Chart on North America - Market size and forecast 2023-2028 ($ million)
- Data Table on North America - Market size and forecast 2023-2028 ($ million)
- Chart on North America - Year-over-year growth 2023-2028 (%)
- Data Table on North America - Year-over-year growth 2023-2028 (%)
- 9.4 Europe - Market size and forecast 2023-2028
- Chart on Europe - Market size and forecast 2023-2028 ($ million)
- Data Table on Europe - Market size and forecast 2023-2028 ($ million)
- Chart on Europe - Year-over-year growth 2023-2028 (%)
- Data Table on Europe - Year-over-year growth 2023-2028 (%)
- 9.5 APAC - Market size and forecast 2023-2028
- Chart on APAC - Market size and forecast 2023-2028 ($ million)
- Data Table on APAC - Market size and forecast 2023-2028 ($ million)
- Chart on APAC - Year-over-year growth 2023-2028 (%)
- Data Table on APAC - Year-over-year growth 2023-2028 (%)
- 9.6 South America - Market size and forecast 2023-2028
- Chart on South America - Market size and forecast 2023-2028 ($ million)
- Data Table on South America - Market size and forecast 2023-2028 ($ million)
- Chart on South America - Year-over-year growth 2023-2028 (%)
- Data Table on South America - Year-over-year growth 2023-2028 (%)
- 9.7 Middle East and Africa - Market size and forecast 2023-2028
- Chart on Middle East and Africa - Market size and forecast 2023-2028 ($ million)
- Data Table on Middle East and Africa - Market size and forecast 2023-2028 ($ million)
- Chart on Middle East and Africa - Year-over-year growth 2023-2028 (%)
- Data Table on Middle East and Africa - Year-over-year growth 2023-2028 (%)
- 9.8 US - Market size and forecast 2023-2028
- Chart on US - Market size and forecast 2023-2028 ($ million)
- Data Table on US - Market size and forecast 2023-2028 ($ million)
- Chart on US - Year-over-year growth 2023-2028 (%)
- Data Table on US - Year-over-year growth 2023-2028 (%)
- 9.9 China - Market size and forecast 2023-2028
- Chart on China - Market size and forecast 2023-2028 ($ million)
- Data Table on China - Market size and forecast 2023-2028 ($ million)
- Chart on China - Year-over-year growth 2023-2028 (%)
- Data Table on China - Year-over-year growth 2023-2028 (%)
- 9.10 Germany - Market size and forecast 2023-2028
- Chart on Germany - Market size and forecast 2023-2028 ($ million)
- Data Table on Germany - Market size and forecast 2023-2028 ($ million)
- Chart on Germany - Year-over-year growth 2023-2028 (%)
- Data Table on Germany - Year-over-year growth 2023-2028 (%)
- 9.11 UK - Market size and forecast 2023-2028
- Chart on UK - Market size and forecast 2023-2028 ($ million)
- Data Table on UK - Market size and forecast 2023-2028 ($ million)
- Chart on UK - Year-over-year growth 2023-2028 (%)
- Data Table on UK - Year-over-year growth 2023-2028 (%)
- 9.12 Canada - Market size and forecast 2023-2028
- Chart on Canada - Market size and forecast 2023-2028 ($ million)
- Data Table on Canada - Market size and forecast 2023-2028 ($ million)
- Chart on Canada - Year-over-year growth 2023-2028 (%)
- Data Table on Canada - Year-over-year growth 2023-2028 (%)
- 9.13 Market opportunity By Geographical Landscape
- Market opportunity By Geographical Landscape ($ million)
- Data Tables on Market opportunity By Geographical Landscape ($ million)
10 Drivers, Challenges, and Opportunity/Restraints
- 10.1 Market drivers
- 10.2 Market challenges
- 10.3 Impact of drivers and challenges
- Impact of drivers and challenges in 2023 and 2028
- 10.4 Market opportunities/restraints
11 Competitive Landscape
- 11.1 Overview
- 11.2 Competitive Landscape
- Overview on criticality of inputs and factors of differentiation
- 11.3 Landscape disruption
- Overview on factors of disruption
- 11.4 Industry risks
- Impact of key risks on business
12 Competitive Analysis
- 12.1 Companies profiled
- Companies covered
- 12.2 Market positioning of companies
- Matrix on companies position and classification
- 3M Co.
- 3M Co. - Overview
- 3M Co. - Business segments
- 3M Co. - Key news
- 3M Co. - Key offerings
- 3M Co. - Segment focus
- 12.4 Allegro Industries
- Allegro Industries - Overview
- Allegro Industries - Product / Service
- Allegro Industries - Key offerings
- 12.5 Avon Polymer Products Ltd.
- Avon Polymer Products Ltd. - Overview
- Avon Polymer Products Ltd. - Product / Service
- Avon Polymer Products Ltd. - Key offerings
- 12.6 Bullard
- Bullard - Overview
- Bullard - Product / Service
- Bullard - Key offerings
- 12.7 Dragerwerk AG and Co. KGaA
- Dragerwerk AG and Co. KGaA - Overview
- Dragerwerk AG and Co. KGaA - Business segments
- Dragerwerk AG and Co. KGaA - Key offerings
- Dragerwerk AG and Co. KGaA - Segment focus
- 12.8 Gentex Corp.
- Gentex Corp. - Overview
- Gentex Corp. - Product / Service
- Gentex Corp. - Key offerings
- 12.9 Honeywell International Inc.
- Honeywell International Inc. - Overview
- Honeywell International Inc. - Business segments
- Honeywell International Inc. - Key news
- Honeywell International Inc. - Key offerings
- Honeywell International Inc. - Segment focus
- 12.10 ILC Dover LP
- ILC Dover LP - Overview
- ILC Dover LP - Key offerings
- 12.11 Miller Electric Manufacturing Co.
- Miller Electric Manufacturing Co. - Overview
- Miller Electric Manufacturing Co. - Product / Service
- Miller Electric Manufacturing Co. - Key offerings
- 12.12 MSA Safety Inc.
- MSA Safety Inc. - Overview
- MSA Safety Inc. - Business segments
- MSA Safety Inc. - Key news
- MSA Safety Inc. - Key offerings
- MSA Safety Inc. - Segment focus
- 12.13 Optrel AG
- Optrel AG - Overview
- Optrel AG - Product / Service
- Optrel AG - Key offerings
- 12.14 RSG Safety BV
- RSG Safety BV - Overview
- RSG Safety BV - Product / Service
- RSG Safety BV - Key offerings
- 12.15 SHIGEMATSU WORKS CO. LTD.
- SHIGEMATSU WORKS CO. LTD. - Overview
- SHIGEMATSU WORKS CO. LTD. - Product / Service
- SHIGEMATSU WORKS CO. LTD. - Key offerings
- 12.16 Sundstrom Safety AB
- Sundstrom Safety AB - Overview
- Sundstrom Safety AB - Product / Service
- Sundstrom Safety AB - Key offerings
- 12.17 VENUS Safety and Health Pvt. Ltd.
- VENUS Safety and Health Pvt. Ltd. - Overview
- VENUS Safety and Health Pvt. Ltd. - Product / Service
- VENUS Safety and Health Pvt. Ltd. - Key offerings
13 Appendix
- 13.1 Scope of the report
- 13.2 Inclusions and exclusions checklist
- Inclusions checklist
- Exclusions checklist
- 13.3 Currency conversion rates for US$
- Currency conversion rates for US$
- 13.4 Research methodology
- Research methodology
- 13.5 Data procurement
- Information sources
- 13.6 Data validation
- Data validation
- 13.7 Validation techniques employed for market sizing
- Validation techniques employed for market sizing
- 13.8 Data synthesis
- Data synthesis
- 13.9 360 degree market analysis
- 360 degree market analysis
- 13.10 List of abbreviations
- List of abbreviations

