|
|
市場調査レポート
商品コード
1525127
ダイヤモンド・コーティングの世界市場 2024-2028Global diamond coatings market 2024-2028 |
||||||

|
|||||||
カスタマイズ可能
|
|||||||


| ダイヤモンド・コーティングの世界市場 2024-2028 |
|
出版日: 2024年07月12日
発行: TechNavio
ページ情報: 英文 175 Pages
納期: 即納可能
|

全表示
- 概要
- 図表
- 目次
ダイヤモンド・コーティング市場は2023-2028年に11億6,400万米ドル、予測期間中のCAGRは8.09%で成長すると予測されます。
当レポートでは、ダイヤモンド・コーティング市場の全体的な分析、市場規模・予測、動向、成長促進要因、課題、約25のベンダーを網羅したベンダー分析などを掲載しています。
現在の市場シナリオ、最新動向と促進要因、市場環境全体に関する最新分析を提供しています。ダイヤモンド・コーティングのコスト優位性、ダイヤモンド・コーティングの汎用性、スマートデバイスの普及拡大などが市場を牽引しています。
| 市場範囲 | |
|---|---|
| 基準年 | 2024 |
| 終了年 | 2028 |
| 予測期間 | 2024-2028 |
| 成長モメンタム | 加速 |
| 前年比2024年 | 7.32% |
| CAGR | 8.09% |
| 増分額 | 11億6,400万米ドル |
本調査では、今後数年間のダイヤモンド・コーティング市場成長を牽引する主な要因の1つとして、ダイヤモンド・コーティングの利用を強化するための研究開発イニシアチブを挙げています。また、自動車産業や石油・ガスの新発見による新たな需要も、市場の大きな需要につながると思われます。
目次
第1章 エグゼクティブサマリー
- 市場概要
第2章 市場情勢
- 市場エコシステム
- 市場の特徴
- バリューチェーン分析
第3章 市場規模の評価
- 市場の定義
- 市場セグメント分析
- 市場規模 2023
- 市場の見通し 2023-2028
第4章 市場規模実績
- 世界ダイヤモンド・コーティング市場 2018-2022
- エンドユーザー別セグメント分析 2018-2022
- 技術別セグメント分析 2018-2022
- 地域別セグメント分析 2018-2022
- 国別セグメント分析 2018-2022
第5章 ファイブフォース分析
- ファイブフォースの要約
- 買い手の交渉力
- 供給企業の交渉力
- 新規参入業者の脅威
- 代替品の脅威
- 競争の脅威
- 市況
第6章 市場セグメンテーション:エンドユーザー別
- 市場セグメンテーション
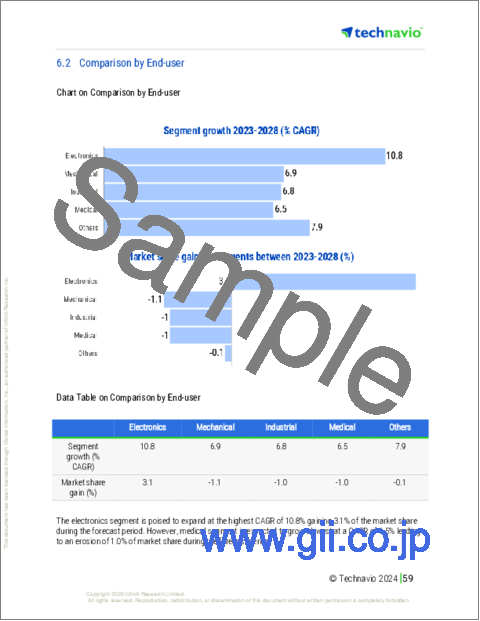
- 比較:エンドユーザー別
- 電子機器:市場規模と予測 2023-2028
- 機械:市場規模と予測 2023-2028
- 産業:市場規模と予測 2023-2028
- 医療:市場規模と予測 2023-2028
- その他:市場規模と予測 2023-2028
- 市場機会:エンドユーザー別
第7章 市場セグメンテーション:技術別
- 市場セグメンテーション
- 比較:技術別
- 化学蒸着:市場規模と予測 2023-2028
- 物理蒸着:市場規模と予測 2023-2028
- 市場機会:技術別
第8章 顧客情勢
- 顧客情勢の概要
第9章 地域別情勢
- 地域別セグメンテーション
- 地域別比較
- 欧州:市場規模と予測 2023-2028
- 北米:市場規模と予測 2023-2028
- アジア太平洋:市場規模と予測 2023-2028
- 中東・アフリカ:市場規模と予測 2023-2028
- 南米:市場規模と予測 2023-2028
- 米国:市場規模と予測 2023-2028
- 中国:市場規模と予測 2023-2028
- ドイツ:市場規模と予測 2023-2028
- 英国:市場規模と予測 2023-2028
- カナダ:市場規模と予測 2023-2028
- 市場機会:地域情勢別
第10章 促進要因・課題・機会・抑制要因
- 市場促進要因
- 市場の課題
- 促進要因と課題の影響
- 市場の機会・抑制要因
第11章 競合情勢
- 概要
- 競合情勢
- 混乱の状況
- 業界のリスク
第12章 競合分析
- 企業プロファイル
- 企業の市場ポジショニング
- Acree Technologies Inc.
- Anglo American plc
- Blue Wave Semiconductors Inc.
- Calico Coatings
- CemeCon AG
- Creating Nano Technologies Inc.
- Crystallume Corp.
- Diamond Materials GmbH and Co. KG
- Diamond Product Solutions
- Endura Coatings
- Entegris Inc.
- NeoCoat SA
- OC Oerlikon Corp. AG
- Sandvik AB
- SP3 Inc.
第13章 付録
Exhibits:
- Exhibits1: Executive Summary - Chart on Market Overview
- Exhibits2: Executive Summary - Data Table on Market Overview
- Exhibits3: Executive Summary - Chart on Global Market Characteristics
- Exhibits4: Executive Summary - Chart on Market By Geographical Landscape
- Exhibits5: Executive Summary - Chart on Market Segmentation by End-user
- Exhibits6: Executive Summary - Chart on Market Segmentation by Technology
- Exhibits7: Executive Summary - Chart on Incremental Growth
- Exhibits8: Executive Summary - Data Table on Incremental Growth
- Exhibits9: Executive Summary - Chart on Company Market Positioning
- Exhibits10: Parent Market
- Exhibits11: Data Table on - Parent Market
- Exhibits12: Market characteristics analysis
- Exhibits13: Value Chain Analysis
- Exhibits14: Offerings of companies included in the market definition
- Exhibits15: Market segments
- Exhibits16: Chart on Global - Market size and forecast 2023-2028 ($ million)
- Exhibits17: Data Table on Global - Market size and forecast 2023-2028 ($ million)
- Exhibits18: Chart on Global Market: Year-over-year growth 2023-2028 (%)
- Exhibits19: Data Table on Global Market: Year-over-year growth 2023-2028 (%)
- Exhibits20: Historic Market Size - Data Table on Global Diamond Coatings Market 2018 - 2022 ($ million)
- Exhibits21: Historic Market Size - End-user Segment 2018 - 2022 ($ million)
- Exhibits22: Historic Market Size - Technology Segment 2018 - 2022 ($ million)
- Exhibits23: Historic Market Size - Geography Segment 2018 - 2022 ($ million)
- Exhibits24: Historic Market Size - Country Segment 2018 - 2022 ($ million)
- Exhibits25: Five forces analysis - Comparison between 2023 and 2028
- Exhibits26: Bargaining power of buyers - Impact of key factors 2023 and 2028
- Exhibits27: Bargaining power of suppliers - Impact of key factors in 2023 and 2028
- Exhibits28: Threat of new entrants - Impact of key factors in 2023 and 2028
- Exhibits29: Threat of substitutes - Impact of key factors in 2023 and 2028
- Exhibits30: Threat of rivalry - Impact of key factors in 2023 and 2028
- Exhibits31: Chart on Market condition - Five forces 2023 and 2028
- Exhibits32: Chart on End-user - Market share 2023-2028 (%)
- Exhibits33: Data Table on End-user - Market share 2023-2028 (%)
- Exhibits34: Chart on Comparison by End-user
- Exhibits35: Data Table on Comparison by End-user
- Exhibits36: Chart on Electronics - Market size and forecast 2023-2028 ($ million)
- Exhibits37: Data Table on Electronics - Market size and forecast 2023-2028 ($ million)
- Exhibits38: Chart on Electronics - Year-over-year growth 2023-2028 (%)
- Exhibits39: Data Table on Electronics - Year-over-year growth 2023-2028 (%)
- Exhibits40: Chart on Mechanical - Market size and forecast 2023-2028 ($ million)
- Exhibits41: Data Table on Mechanical - Market size and forecast 2023-2028 ($ million)
- Exhibits42: Chart on Mechanical - Year-over-year growth 2023-2028 (%)
- Exhibits43: Data Table on Mechanical - Year-over-year growth 2023-2028 (%)
- Exhibits44: Chart on Industrial - Market size and forecast 2023-2028 ($ million)
- Exhibits45: Data Table on Industrial - Market size and forecast 2023-2028 ($ million)
- Exhibits46: Chart on Industrial - Year-over-year growth 2023-2028 (%)
- Exhibits47: Data Table on Industrial - Year-over-year growth 2023-2028 (%)
- Exhibits48: Chart on Medical - Market size and forecast 2023-2028 ($ million)
- Exhibits49: Data Table on Medical - Market size and forecast 2023-2028 ($ million)
- Exhibits50: Chart on Medical - Year-over-year growth 2023-2028 (%)
- Exhibits51: Data Table on Medical - Year-over-year growth 2023-2028 (%)
- Exhibits52: Chart on Others - Market size and forecast 2023-2028 ($ million)
- Exhibits53: Data Table on Others - Market size and forecast 2023-2028 ($ million)
- Exhibits54: Chart on Others - Year-over-year growth 2023-2028 (%)
- Exhibits55: Data Table on Others - Year-over-year growth 2023-2028 (%)
- Exhibits56: Market opportunity by End-user ($ million)
- Exhibits57: Data Table on Market opportunity by End-user ($ million)
- Exhibits58: Chart on Technology - Market share 2023-2028 (%)
- Exhibits59: Data Table on Technology - Market share 2023-2028 (%)
- Exhibits60: Chart on Comparison by Technology
- Exhibits61: Data Table on Comparison by Technology
- Exhibits62: Chart on Chemical vapor deposition - Market size and forecast 2023-2028 ($ million)
- Exhibits63: Data Table on Chemical vapor deposition - Market size and forecast 2023-2028 ($ million)
- Exhibits64: Chart on Chemical vapor deposition - Year-over-year growth 2023-2028 (%)
- Exhibits65: Data Table on Chemical vapor deposition - Year-over-year growth 2023-2028 (%)
- Exhibits66: Chart on Physical vapor deposition - Market size and forecast 2023-2028 ($ million)
- Exhibits67: Data Table on Physical vapor deposition - Market size and forecast 2023-2028 ($ million)
- Exhibits68: Chart on Physical vapor deposition - Year-over-year growth 2023-2028 (%)
- Exhibits69: Data Table on Physical vapor deposition - Year-over-year growth 2023-2028 (%)
- Exhibits70: Market opportunity by Technology ($ million)
- Exhibits71: Data Table on Market opportunity by Technology ($ million)
- Exhibits72: Analysis of price sensitivity, lifecycle, customer purchase basket, adoption rates, and purchase criteria
- Exhibits73: Chart on Market share By Geographical Landscape 2023-2028 (%)
- Exhibits74: Data Table on Market share By Geographical Landscape 2023-2028 (%)
- Exhibits75: Chart on Geographic comparison
- Exhibits76: Data Table on Geographic comparison
- Exhibits77: Chart on Europe - Market size and forecast 2023-2028 ($ million)
- Exhibits78: Data Table on Europe - Market size and forecast 2023-2028 ($ million)
- Exhibits79: Chart on Europe - Year-over-year growth 2023-2028 (%)
- Exhibits80: Data Table on Europe - Year-over-year growth 2023-2028 (%)
- Exhibits81: Chart on North America - Market size and forecast 2023-2028 ($ million)
- Exhibits82: Data Table on North America - Market size and forecast 2023-2028 ($ million)
- Exhibits83: Chart on North America - Year-over-year growth 2023-2028 (%)
- Exhibits84: Data Table on North America - Year-over-year growth 2023-2028 (%)
- Exhibits85: Chart on APAC - Market size and forecast 2023-2028 ($ million)
- Exhibits86: Data Table on APAC - Market size and forecast 2023-2028 ($ million)
- Exhibits87: Chart on APAC - Year-over-year growth 2023-2028 (%)
- Exhibits88: Data Table on APAC - Year-over-year growth 2023-2028 (%)
- Exhibits89: Chart on Middle East and Africa - Market size and forecast 2023-2028 ($ million)
- Exhibits90: Data Table on Middle East and Africa - Market size and forecast 2023-2028 ($ million)
- Exhibits91: Chart on Middle East and Africa - Year-over-year growth 2023-2028 (%)
- Exhibits92: Data Table on Middle East and Africa - Year-over-year growth 2023-2028 (%)
- Exhibits93: Chart on South America - Market size and forecast 2023-2028 ($ million)
- Exhibits94: Data Table on South America - Market size and forecast 2023-2028 ($ million)
- Exhibits95: Chart on South America - Year-over-year growth 2023-2028 (%)
- Exhibits96: Data Table on South America - Year-over-year growth 2023-2028 (%)
- Exhibits97: Chart on US - Market size and forecast 2023-2028 ($ million)
- Exhibits98: Data Table on US - Market size and forecast 2023-2028 ($ million)
- Exhibits99: Chart on US - Year-over-year growth 2023-2028 (%)
- Exhibits100: Data Table on US - Year-over-year growth 2023-2028 (%)
- Exhibits101: Chart on China - Market size and forecast 2023-2028 ($ million)
- Exhibits102: Data Table on China - Market size and forecast 2023-2028 ($ million)
- Exhibits103: Chart on China - Year-over-year growth 2023-2028 (%)
- Exhibits104: Data Table on China - Year-over-year growth 2023-2028 (%)
- Exhibits105: Chart on Germany - Market size and forecast 2023-2028 ($ million)
- Exhibits106: Data Table on Germany - Market size and forecast 2023-2028 ($ million)
- Exhibits107: Chart on Germany - Year-over-year growth 2023-2028 (%)
- Exhibits108: Data Table on Germany - Year-over-year growth 2023-2028 (%)
- Exhibits109: Chart on UK - Market size and forecast 2023-2028 ($ million)
- Exhibits110: Data Table on UK - Market size and forecast 2023-2028 ($ million)
- Exhibits111: Chart on UK - Year-over-year growth 2023-2028 (%)
- Exhibits112: Data Table on UK - Year-over-year growth 2023-2028 (%)
- Exhibits113: Chart on Canada - Market size and forecast 2023-2028 ($ million)
- Exhibits114: Data Table on Canada - Market size and forecast 2023-2028 ($ million)
- Exhibits115: Chart on Canada - Year-over-year growth 2023-2028 (%)
- Exhibits116: Data Table on Canada - Year-over-year growth 2023-2028 (%)
- Exhibits117: Market opportunity By Geographical Landscape ($ million)
- Exhibits118: Data Tables on Market opportunity By Geographical Landscape ($ million)
- Exhibits119: Impact of drivers and challenges in 2023 and 2028
- Exhibits120: Overview on criticality of inputs and factors of differentiation
- Exhibits121: Overview on factors of disruption
- Exhibits122: Impact of key risks on business
- Exhibits123: Companies covered
- Exhibits124: Matrix on companies position and classification
- Exhibits125: Acree Technologies Inc. - Overview
- Exhibits126: Acree Technologies Inc. - Product / Service
- Exhibits127: Acree Technologies Inc. - Key offerings
- Exhibits128: Anglo American plc - Overview
- Exhibits129: Anglo American plc - Business segments
- Exhibits130: Anglo American plc - Key news
- Exhibits131: Anglo American plc - Key offerings
- Exhibits132: Anglo American plc - Segment focus
- Exhibits133: Blue Wave Semiconductors Inc. - Overview
- Exhibits134: Blue Wave Semiconductors Inc. - Product / Service
- Exhibits135: Blue Wave Semiconductors Inc. - Key offerings
- Exhibits136: Calico Coatings - Overview
- Exhibits137: Calico Coatings - Product / Service
- Exhibits138: Calico Coatings - Key offerings
- Exhibits139: CemeCon AG - Overview
- Exhibits140: CemeCon AG - Product / Service
- Exhibits141: CemeCon AG - Key offerings
- Exhibits142: Creating Nano Technologies Inc. - Overview
- Exhibits143: Creating Nano Technologies Inc. - Product / Service
- Exhibits144: Creating Nano Technologies Inc. - Key offerings
- Exhibits145: Crystallume Corp. - Overview
- Exhibits146: Crystallume Corp. - Product / Service
- Exhibits147: Crystallume Corp. - Key offerings
- Exhibits148: Diamond Materials GmbH and Co. KG - Overview
- Exhibits149: Diamond Materials GmbH and Co. KG - Product / Service
- Exhibits150: Diamond Materials GmbH and Co. KG - Key offerings
- Exhibits151: Diamond Product Solutions - Overview
- Exhibits152: Diamond Product Solutions - Product / Service
- Exhibits153: Diamond Product Solutions - Key offerings
- Exhibits154: Endura Coatings - Overview
- Exhibits155: Endura Coatings - Product / Service
- Exhibits156: Endura Coatings - Key offerings
- Exhibits157: Entegris Inc. - Overview
- Exhibits158: Entegris Inc. - Business segments
- Exhibits159: Entegris Inc. - Key offerings
- Exhibits160: Entegris Inc. - Segment focus
- Exhibits161: NeoCoat SA - Overview
- Exhibits162: NeoCoat SA - Product / Service
- Exhibits163: NeoCoat SA - Key offerings
- Exhibits164: OC Oerlikon Corp. AG - Overview
- Exhibits165: OC Oerlikon Corp. AG - Business segments
- Exhibits166: OC Oerlikon Corp. AG - Key news
- Exhibits167: OC Oerlikon Corp. AG - Key offerings
- Exhibits168: OC Oerlikon Corp. AG - Segment focus
- Exhibits169: Sandvik AB - Overview
- Exhibits170: Sandvik AB - Business segments
- Exhibits171: Sandvik AB - Key news
- Exhibits172: Sandvik AB - Key offerings
- Exhibits173: Sandvik AB - Segment focus
- Exhibits174: SP3 Inc. - Overview
- Exhibits175: SP3 Inc. - Product / Service
- Exhibits176: SP3 Inc. - Key offerings
- Exhibits177: Inclusions checklist
- Exhibits178: Exclusions checklist
- Exhibits179: Currency conversion rates for US$
- Exhibits180: Research methodology
- Exhibits181: Information sources
- Exhibits182: Data validation
- Exhibits183: Validation techniques employed for market sizing
- Exhibits184: Data synthesis
- Exhibits185: 360 degree market analysis
- Exhibits186: List of abbreviations
The diamond coatings market is forecasted to grow by USD 1164 mn during 2023-2028, accelerating at a CAGR of 8.09% during the forecast period. The report on the diamond coatings market provides a holistic analysis, market size and forecast, trends, growth drivers, and challenges, as well as vendor analysis covering around 25 vendors.
The report offers an up-to-date analysis regarding the current market scenario, the latest trends and drivers, and the overall market environment. The market is driven by cost advantages of diamond coatings, versatile properties of diamond coatings, and increasing penetration of smart devices.
Technavio's diamond coatings market is segmented as below:
| Market Scope | |
|---|---|
| Base Year | 2024 |
| End Year | 2028 |
| Series Year | 2024-2028 |
| Growth Momentum | Accelerate |
| YOY 2024 | 7.32% |
| CAGR | 8.09% |
| Incremental Value | $1164mn |
By End-user
- Electronics
- Mechanical
- Industrial
- Medical
- Others
By Technology
- Chemical vapor deposition
- Physical vapor deposition
By Geographical Landscape
- Europe
- North America
- APAC
- Middle East and Africa
- South America
This study identifies the r and d initiatives to enhance the use of diamond coatings as one of the prime reasons driving the diamond coatings market growth during the next few years. Also, emerging demand from the automotive industry and new oil and gas discoveries will lead to sizable demand in the market.
The report on the diamond coatings market covers the following areas:
- Diamond coatings market sizing
- Diamond coatings market forecast
- Diamond coatings market industry analysis
The robust vendor analysis is designed to help clients improve their market position, and in line with this, this report provides a detailed analysis of several leading diamond coatings market vendors that include Acree Technologies Inc., Anglo American plc, Blue Wave Semiconductors Inc., Calico Coatings, CemeCon AG, Creating Nano Technologies Inc., Crystallume Corp., Diamond Materials GmbH and Co. KG, Diamond Product Solutions, Element Six UK Ltd., Endura Coatings, Entegris Inc., IBC Coatings Technologies Inc., JCS Group, NeoCoat SA, OC Oerlikon Corp. AG, Sandvik AB, SP3 Inc., Surface Technology Inc., and United Protective Technologies LLC. Also, the diamond coatings market analysis report includes information on upcoming trends and challenges that will influence market growth. This is to help companies strategize and leverage all forthcoming growth opportunities.
The study was conducted using an objective combination of primary and secondary information including inputs from key participants in the industry. The report contains a comprehensive market and vendor landscape in addition to an analysis of the key vendors.
The publisher presents a detailed picture of the market by the way of study, synthesis, and summation of data from multiple sources by an analysis of key parameters such as profit, pricing, competition, and promotions. It presents various market facets by identifying the key industry influencers. The data presented is comprehensive, reliable, and a result of extensive research - both primary and secondary. The market research reports provide a complete competitive landscape and an in-depth vendor selection methodology and analysis using qualitative and quantitative research to forecast the accurate market growth.
Table of Contents
1 Executive Summary
- 1.1 Market overview
- Executive Summary - Chart on Market Overview
- Executive Summary - Data Table on Market Overview
- Executive Summary - Chart on Global Market Characteristics
- Executive Summary - Chart on Market By Geographical Landscape
- Executive Summary - Chart on Market Segmentation by End-user
- Executive Summary - Chart on Market Segmentation by Technology
- Executive Summary - Chart on Incremental Growth
- Executive Summary - Data Table on Incremental Growth
- Executive Summary - Chart on Company Market Positioning
2 Market Landscape
- 2.1 Market ecosystem
- Parent Market
- Data Table on - Parent Market
- 2.2 Market characteristics
- Market characteristics analysis
- 2.3 Value chain analysis
- Value Chain Analysis
3 Market Sizing
- 3.1 Market definition
- Offerings of companies included in the market definition
- 3.2 Market segment analysis
- Market segments
- 3.3 Market size 2023
- 3.4 Market outlook: Forecast for 2023-2028
- Chart on Global - Market size and forecast 2023-2028 ($ million)
- Data Table on Global - Market size and forecast 2023-2028 ($ million)
- Chart on Global Market: Year-over-year growth 2023-2028 (%)
- Data Table on Global Market: Year-over-year growth 2023-2028 (%)
4 Historic Market Size
- 4.1 Global Diamond Coatings Market 2018 - 2022
- Historic Market Size - Data Table on Global Diamond Coatings Market 2018 - 2022 ($ million)
- 4.2 End-user segment analysis 2018 - 2022
- Historic Market Size - End-user Segment 2018 - 2022 ($ million)
- 4.3 Technology segment analysis 2018 - 2022
- Historic Market Size - Technology Segment 2018 - 2022 ($ million)
- 4.4 Geography segment analysis 2018 - 2022
- Historic Market Size - Geography Segment 2018 - 2022 ($ million)
- 4.5 Country segment analysis 2018 - 2022
- Historic Market Size - Country Segment 2018 - 2022 ($ million)
5 Five Forces Analysis
- 5.1 Five forces summary
- Five forces analysis - Comparison between 2023 and 2028
- 5.2 Bargaining power of buyers
- Bargaining power of buyers - Impact of key factors 2023 and 2028
- 5.3 Bargaining power of suppliers
- Bargaining power of suppliers - Impact of key factors in 2023 and 2028
- 5.4 Threat of new entrants
- Threat of new entrants - Impact of key factors in 2023 and 2028
- 5.5 Threat of substitutes
- Threat of substitutes - Impact of key factors in 2023 and 2028
- 5.6 Threat of rivalry
- Threat of rivalry - Impact of key factors in 2023 and 2028
- 5.7 Market condition
- Chart on Market condition - Five forces 2023 and 2028
6 Market Segmentation by End-user
- 6.1 Market segments
- Chart on End-user - Market share 2023-2028 (%)
- Data Table on End-user - Market share 2023-2028 (%)
- 6.2 Comparison by End-user
- Chart on Comparison by End-user
- Data Table on Comparison by End-user
- 6.3 Electronics - Market size and forecast 2023-2028
- Chart on Electronics - Market size and forecast 2023-2028 ($ million)
- Data Table on Electronics - Market size and forecast 2023-2028 ($ million)
- Chart on Electronics - Year-over-year growth 2023-2028 (%)
- Data Table on Electronics - Year-over-year growth 2023-2028 (%)
- 6.4 Mechanical - Market size and forecast 2023-2028
- Chart on Mechanical - Market size and forecast 2023-2028 ($ million)
- Data Table on Mechanical - Market size and forecast 2023-2028 ($ million)
- Chart on Mechanical - Year-over-year growth 2023-2028 (%)
- Data Table on Mechanical - Year-over-year growth 2023-2028 (%)
- 6.5 Industrial - Market size and forecast 2023-2028
- Chart on Industrial - Market size and forecast 2023-2028 ($ million)
- Data Table on Industrial - Market size and forecast 2023-2028 ($ million)
- Chart on Industrial - Year-over-year growth 2023-2028 (%)
- Data Table on Industrial - Year-over-year growth 2023-2028 (%)
- 6.6 Medical - Market size and forecast 2023-2028
- Chart on Medical - Market size and forecast 2023-2028 ($ million)
- Data Table on Medical - Market size and forecast 2023-2028 ($ million)
- Chart on Medical - Year-over-year growth 2023-2028 (%)
- Data Table on Medical - Year-over-year growth 2023-2028 (%)
- 6.7 Others - Market size and forecast 2023-2028
- Chart on Others - Market size and forecast 2023-2028 ($ million)
- Data Table on Others - Market size and forecast 2023-2028 ($ million)
- Chart on Others - Year-over-year growth 2023-2028 (%)
- Data Table on Others - Year-over-year growth 2023-2028 (%)
- 6.8 Market opportunity by End-user
- Market opportunity by End-user ($ million)
- Data Table on Market opportunity by End-user ($ million)
7 Market Segmentation by Technology
- 7.1 Market segments
- Chart on Technology - Market share 2023-2028 (%)
- Data Table on Technology - Market share 2023-2028 (%)
- 7.2 Comparison by Technology
- Chart on Comparison by Technology
- Data Table on Comparison by Technology
- 7.3 Chemical vapor deposition - Market size and forecast 2023-2028
- Chart on Chemical vapor deposition - Market size and forecast 2023-2028 ($ million)
- Data Table on Chemical vapor deposition - Market size and forecast 2023-2028 ($ million)
- Chart on Chemical vapor deposition - Year-over-year growth 2023-2028 (%)
- Data Table on Chemical vapor deposition - Year-over-year growth 2023-2028 (%)
- 7.4 Physical vapor deposition - Market size and forecast 2023-2028
- Chart on Physical vapor deposition - Market size and forecast 2023-2028 ($ million)
- Data Table on Physical vapor deposition - Market size and forecast 2023-2028 ($ million)
- Chart on Physical vapor deposition - Year-over-year growth 2023-2028 (%)
- Data Table on Physical vapor deposition - Year-over-year growth 2023-2028 (%)
- 7.5 Market opportunity by Technology
- Market opportunity by Technology ($ million)
- Data Table on Market opportunity by Technology ($ million)
8 Customer Landscape
- 8.1 Customer landscape overview
- Analysis of price sensitivity, lifecycle, customer purchase basket, adoption rates, and purchase criteria
9 Geographic Landscape
- 9.1 Geographic segmentation
- Chart on Market share By Geographical Landscape 2023-2028 (%)
- Data Table on Market share By Geographical Landscape 2023-2028 (%)
- 9.2 Geographic comparison
- Chart on Geographic comparison
- Data Table on Geographic comparison
- 9.3 Europe - Market size and forecast 2023-2028
- Chart on Europe - Market size and forecast 2023-2028 ($ million)
- Data Table on Europe - Market size and forecast 2023-2028 ($ million)
- Chart on Europe - Year-over-year growth 2023-2028 (%)
- Data Table on Europe - Year-over-year growth 2023-2028 (%)
- 9.4 North America - Market size and forecast 2023-2028
- Chart on North America - Market size and forecast 2023-2028 ($ million)
- Data Table on North America - Market size and forecast 2023-2028 ($ million)
- Chart on North America - Year-over-year growth 2023-2028 (%)
- Data Table on North America - Year-over-year growth 2023-2028 (%)
- 9.5 APAC - Market size and forecast 2023-2028
- Chart on APAC - Market size and forecast 2023-2028 ($ million)
- Data Table on APAC - Market size and forecast 2023-2028 ($ million)
- Chart on APAC - Year-over-year growth 2023-2028 (%)
- Data Table on APAC - Year-over-year growth 2023-2028 (%)
- 9.6 Middle East and Africa - Market size and forecast 2023-2028
- Chart on Middle East and Africa - Market size and forecast 2023-2028 ($ million)
- Data Table on Middle East and Africa - Market size and forecast 2023-2028 ($ million)
- Chart on Middle East and Africa - Year-over-year growth 2023-2028 (%)
- Data Table on Middle East and Africa - Year-over-year growth 2023-2028 (%)
- 9.7 South America - Market size and forecast 2023-2028
- Chart on South America - Market size and forecast 2023-2028 ($ million)
- Data Table on South America - Market size and forecast 2023-2028 ($ million)
- Chart on South America - Year-over-year growth 2023-2028 (%)
- Data Table on South America - Year-over-year growth 2023-2028 (%)
- 9.8 US - Market size and forecast 2023-2028
- Chart on US - Market size and forecast 2023-2028 ($ million)
- Data Table on US - Market size and forecast 2023-2028 ($ million)
- Chart on US - Year-over-year growth 2023-2028 (%)
- Data Table on US - Year-over-year growth 2023-2028 (%)
- 9.9 China - Market size and forecast 2023-2028
- Chart on China - Market size and forecast 2023-2028 ($ million)
- Data Table on China - Market size and forecast 2023-2028 ($ million)
- Chart on China - Year-over-year growth 2023-2028 (%)
- Data Table on China - Year-over-year growth 2023-2028 (%)
- 9.10 Germany - Market size and forecast 2023-2028
- Chart on Germany - Market size and forecast 2023-2028 ($ million)
- Data Table on Germany - Market size and forecast 2023-2028 ($ million)
- Chart on Germany - Year-over-year growth 2023-2028 (%)
- Data Table on Germany - Year-over-year growth 2023-2028 (%)
- 9.11 UK - Market size and forecast 2023-2028
- Chart on UK - Market size and forecast 2023-2028 ($ million)
- Data Table on UK - Market size and forecast 2023-2028 ($ million)
- Chart on UK - Year-over-year growth 2023-2028 (%)
- Data Table on UK - Year-over-year growth 2023-2028 (%)
- 9.12 Canada - Market size and forecast 2023-2028
- Chart on Canada - Market size and forecast 2023-2028 ($ million)
- Data Table on Canada - Market size and forecast 2023-2028 ($ million)
- Chart on Canada - Year-over-year growth 2023-2028 (%)
- Data Table on Canada - Year-over-year growth 2023-2028 (%)
- 9.13 Market opportunity By Geographical Landscape
- Market opportunity By Geographical Landscape ($ million)
- Data Tables on Market opportunity By Geographical Landscape ($ million)
10 Drivers, Challenges, and Opportunity/Restraints
- 10.1 Market drivers
- 10.2 Market challenges
- 10.3 Impact of drivers and challenges
- Impact of drivers and challenges in 2023 and 2028
- 10.4 Market opportunities/restraints
11 Competitive Landscape
- 11.1 Overview
- 11.2 Competitive Landscape
- Overview on criticality of inputs and factors of differentiation
- 11.3 Landscape disruption
- Overview on factors of disruption
- 11.4 Industry risks
- Impact of key risks on business
12 Competitive Analysis
- 12.1 Companies profiled
- Companies covered
- 12.2 Market positioning of companies
- Matrix on companies position and classification
- 12.3 Acree Technologies Inc.
- Acree Technologies Inc. - Overview
- Acree Technologies Inc. - Product / Service
- Acree Technologies Inc. - Key offerings
- 12.4 Anglo American plc
- Anglo American plc - Overview
- Anglo American plc - Business segments
- Anglo American plc - Key news
- Anglo American plc - Key offerings
- Anglo American plc - Segment focus
- 12.5 Blue Wave Semiconductors Inc.
- Blue Wave Semiconductors Inc. - Overview
- Blue Wave Semiconductors Inc. - Product / Service
- Blue Wave Semiconductors Inc. - Key offerings
- 12.6 Calico Coatings
- Calico Coatings - Overview
- Calico Coatings - Product / Service
- Calico Coatings - Key offerings
- 12.7 CemeCon AG
- CemeCon AG - Overview
- CemeCon AG - Product / Service
- CemeCon AG - Key offerings
- 12.8 Creating Nano Technologies Inc.
- Creating Nano Technologies Inc. - Overview
- Creating Nano Technologies Inc. - Product / Service
- Creating Nano Technologies Inc. - Key offerings
- 12.9 Crystallume Corp.
- Crystallume Corp. - Overview
- Crystallume Corp. - Product / Service
- Crystallume Corp. - Key offerings
- 12.10 Diamond Materials GmbH and Co. KG
- Diamond Materials GmbH and Co. KG - Overview
- Diamond Materials GmbH and Co. KG - Product / Service
- Diamond Materials GmbH and Co. KG - Key offerings
- 12.11 Diamond Product Solutions
- Diamond Product Solutions - Overview
- Diamond Product Solutions - Product / Service
- Diamond Product Solutions - Key offerings
- 12.12 Endura Coatings
- Endura Coatings - Overview
- Endura Coatings - Product / Service
- Endura Coatings - Key offerings
- 12.13 Entegris Inc.
- Entegris Inc. - Overview
- Entegris Inc. - Business segments
- Entegris Inc. - Key offerings
- Entegris Inc. - Segment focus
- 12.14 NeoCoat SA
- NeoCoat SA - Overview
- NeoCoat SA - Product / Service
- NeoCoat SA - Key offerings
- 12.15 OC Oerlikon Corp. AG
- OC Oerlikon Corp. AG - Overview
- OC Oerlikon Corp. AG - Business segments
- OC Oerlikon Corp. AG - Key news
- OC Oerlikon Corp. AG - Key offerings
- OC Oerlikon Corp. AG - Segment focus
- 12.16 Sandvik AB
- Sandvik AB - Overview
- Sandvik AB - Business segments
- Sandvik AB - Key news
- Sandvik AB - Key offerings
- Sandvik AB - Segment focus
- 12.17 SP3 Inc.
- SP3 Inc. - Overview
- SP3 Inc. - Product / Service
- SP3 Inc. - Key offerings
13 Appendix
- 13.1 Scope of the report
- 13.2 Inclusions and exclusions checklist
- Inclusions checklist
- Exclusions checklist
- 13.3 Currency conversion rates for US$
- Currency conversion rates for US$
- 13.4 Research methodology
- Research methodology
- 13.5 Data procurement
- Information sources
- 13.6 Data validation
- Data validation
- 13.7 Validation techniques employed for market sizing
- Validation techniques employed for market sizing
- 13.8 Data synthesis
- Data synthesis
- 13.9 360 degree market analysis
- 360 degree market analysis
- 13.10 List of abbreviations
- List of abbreviations
