|
|
市場調査レポート
商品コード
1626776
世界の車載Wi-Fi市場、2025~2029年Global In-car Wi-fi Market 2025-2029 |
||||||

|
|||||||
カスタマイズ可能
|
|||||||


| 世界の車載Wi-Fi市場、2025~2029年 |
|
出版日: 2024年12月28日
発行: TechNavio
ページ情報: 英文 205 Pages
納期: 即納可能
|

全表示
- 概要
- 図表
- 目次
車載Wi-Fi市場、2025~2029年
車載Wi-Fi市場は2024~2029年に1兆7,892億6,240万米ドル、予測期間中のCAGRは96.4%で成長すると予測されます。当レポートでは、車載Wi-Fi市場の全体的な分析、市場規模・予測、動向、成長促進要因、課題、約25のベンダーを網羅したベンダー分析などを掲載しています。
現在の市場シナリオ、最新動向と促進要因、市場環境全体に関する最新分析を提供しています。市場は、個人のニーズに合わせた幅広い車載Wi-Fi向けデータプラン、車載インフォテインメントへの需要の高まり、自動車向けインターネット帯域幅の改善などが牽引しています。
| 市場範囲 | |
|---|---|
| 基準年 | 2025年 |
| 終了年 | 2029年 |
| 予測期間 | 2025~2029年 |
| 成長モメンタム | 加速 |
| 前年比[2025年] | 75.3% |
| CAGR | 96.4% |
| 増分額 | 1兆7,892億6,240万米ドル |
本調査では、コネクテッドカーが提供するビッグデータプラットフォームが、今後数年間の車載Wi-Fi市場の成長を促進する主要な理由の1つであると特定しています。また、ソフトウェアコンポーネントやコネクテッドカー技術、IoTのotaアップデートは、市場の大きな需要につながると考えられます。
目次
第1章 エグゼクティブサマリー
- 市場概要
第2章 Technavio分析
- 価格・ライフサイクル・顧客購入バスケット・採用率・購入基準の分析
- インプットの重要性と差別化の要因
- 混乱の要因
- 促進要因と課題の影響
第3章 市場情勢
- 市場エコシステム
- 市場の特徴
- バリューチェーン分析
第4章 市場規模
- 市場の定義
- 市場セグメント分析
- 市場規模 2024年
- 市場展望 2024~2029年
第5章 市場規模実績
- 世界の車載Wi-Fi市場 2019~2023年
- 技術別セグメント分析 2019~2023年
- 用途別セグメント分析 2019~2023年
- 地域別セグメント分析 2019~2023年
- 国別セグメント分析 2019~2023年
第6章 定性分析
- AIの影響:世界の車載Wi-Fi市場
第7章 ファイブフォース分析
- ファイブフォースの要約
- 買い手の交渉力
- 供給企業の交渉力
- 新規参入業者の脅威
- 代替品の脅威
- 競争の脅威
- 市況
第8章 市場セグメンテーション:技術別
- 市場セグメント
- 比較:技術別
- 市場機会:技術別
第9章 市場セグメンテーション:用途別
- 市場セグメント
- 比較:用途別
- 住宅用:市場規模と予測 2024~2029年
- 商業用:市場規模と予測 2024~2029年
- 市場機会:用途別
第10章 顧客情勢
- 顧客情勢概要
第11章 地域別情勢
- 地域別セグメンテーション
- 比較:地域別
- 欧州:市場規模と予測 2024~2029年
- アジア太平洋:市場規模と予測 2024~2029年
- 北米:市場規模と予測 2024~2029年
- 中東・アフリカ:市場規模と予測 2024~2029年
- 南米:市場規模と予測 2024~2029年
- ドイツ:市場規模と予測 2024~2029年
- 米国:市場規模と予測 2024~2029年
- 英国:市場規模と予測 2024~2029年
- フランス:市場規模と予測 2024~2029年
- 中国:市場規模と予測 2024~2029年
- イタリア:市場規模と予測 2024~2029年
- カナダ:市場規模と予測 2024~2029年
- 日本:市場規模と予測 2024~2029年
- インド:市場規模と予測 2024~2029年
- 韓国:市場規模と予測 2024~2029年
- 地域情勢による市場機会
第12章 促進要因・課題・機会・抑制要因
- 市場促進要因
- 市場課題
- 促進要因と課題の影響
- 市場機会・抑制要因
第13章 競合情勢
- 概要
- 競合情勢
- 混乱の状況
- 産業のリスク
第14章 競合分析
- 企業プロファイル
- 企業ランキング指数
- 企業の市場ポジショニング
- AB Volvo
- Bayerische Motoren Werke AG
- Dr. Ing. h.c. F. Porsche AG
- Ford Motor Co.
- General Motors Co.
- Honda Motor Co. Ltd.
- Mahindra and Mahindra Ltd.
- Mercedes Benz Group AG
- Nissan Motor Co. Ltd.
- Rairdons Subaru of Auburn
- Renault SAS
- SsangYong Motor Co.
- Tesla Inc.
- Toyota Motor Corp.
- Volkswagen AG
第15章 付録
Exhibits:
- Exhibits1: Executive Summary - Chart on Market Overview
- Exhibits2: Executive Summary - Data Table on Market Overview
- Exhibits3: Executive Summary - Chart on Global Market Characteristics
- Exhibits4: Executive Summary - Chart on Market By Geographical Landscape
- Exhibits5: Executive Summary - Chart on Market Segmentation by Technology
- Exhibits6: Executive Summary - Chart on Market Segmentation by Application
- Exhibits7: Executive Summary - Chart on Incremental Growth
- Exhibits8: Executive Summary - Data Table on Incremental Growth
- Exhibits9: Executive Summary - Chart on Company Market Positioning
- Exhibits10: Analysis of price sensitivity, lifecycle, customer purchase basket, adoption rates, and purchase criteria
- Exhibits11: Overview on criticality of inputs and factors of differentiation
- Exhibits12: Overview on factors of disruption
- Exhibits13: Impact of drivers and challenges in 2024 and 2029
- Exhibits14: Parent Market
- Exhibits15: Data Table on - Parent Market
- Exhibits16: Market characteristics analysis
- Exhibits17: Value chain analysis
- Exhibits18: Offerings of companies included in the market definition
- Exhibits19: Market segments
- Exhibits20: Chart on Global - Market size and forecast 2024-2029 ($ million)
- Exhibits21: Data Table on Global - Market size and forecast 2024-2029 ($ million)
- Exhibits22: Chart on Global Market: Year-over-year growth 2024-2029 (%)
- Exhibits23: Data Table on Global Market: Year-over-year growth 2024-2029 (%)
- Exhibits24: Historic Market Size - Data Table on Global In-Car Wi-Fi Market 2019 - 2023 ($ million)
- Exhibits25: Historic Market Size - Technology Segment 2019 - 2023 ($ million)
- Exhibits26: Historic Market Size - Application Segment 2019 - 2023 ($ million)
- Exhibits27: Historic Market Size - Geography Segment 2019 - 2023 ($ million)
- Exhibits28: Historic Market Size - Country Segment 2019 - 2023 ($ million)
- Exhibits29: Five forces analysis - Comparison between 2024 and 2029
- Exhibits30: Bargaining power of buyers - Impact of key factors 2024 and 2029
- Exhibits31: Bargaining power of suppliers - Impact of key factors in 2024 and 2029
- Exhibits32: Threat of new entrants - Impact of key factors in 2024 and 2029
- Exhibits33: Threat of substitutes - Impact of key factors in 2024 and 2029
- Exhibits34: Threat of rivalry - Impact of key factors in 2024 and 2029
- Exhibits35: Chart on Market condition - Five forces 2024 and 2029
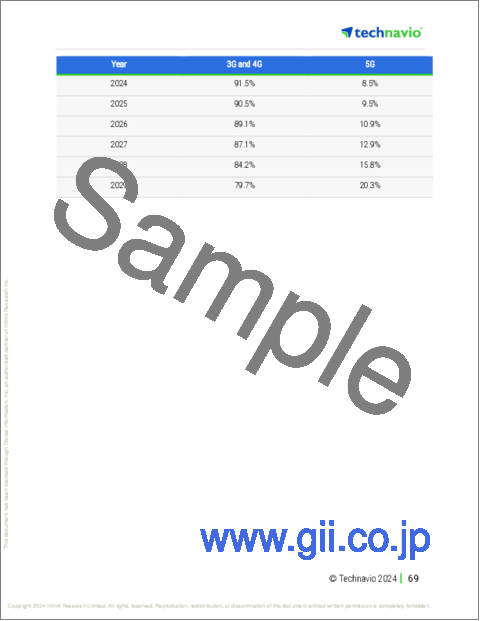
- Exhibits36: Chart on Technology - Market share 2024-2029 (%)
- Exhibits37: Data Table on Technology - Market share 2024-2029 (%)
- Exhibits38: Chart on Comparison by Technology
- Exhibits39: Data Table on Comparison by Technology
- Exhibits40: Chart on 3G and 4G - Market size and forecast 2024-2029 ($ million)
- Exhibits41: Data Table on 3G and 4G - Market size and forecast 2024-2029 ($ million)
- Exhibits42: Chart on 3G and 4G - Year-over-year growth 2024-2029 (%)
- Exhibits43: Data Table on 3G and 4G - Year-over-year growth 2024-2029 (%)
- Exhibits44: Chart on 5G - Market size and forecast 2024-2029 ($ million)
- Exhibits45: Data Table on 5G - Market size and forecast 2024-2029 ($ million)
- Exhibits46: Chart on 5G - Year-over-year growth 2024-2029 (%)
- Exhibits47: Data Table on 5G - Year-over-year growth 2024-2029 (%)
- Exhibits48: Market opportunity by Technology ($ million)
- Exhibits49: Data Table on Market opportunity by Technology ($ million)
- Exhibits50: Chart on Application - Market share 2024-2029 (%)
- Exhibits51: Data Table on Application - Market share 2024-2029 (%)
- Exhibits52: Chart on Comparison by Application
- Exhibits53: Data Table on Comparison by Application
- Exhibits54: Chart on Residential - Market size and forecast 2024-2029 ($ million)
- Exhibits55: Data Table on Residential - Market size and forecast 2024-2029 ($ million)
- Exhibits56: Chart on Residential - Year-over-year growth 2024-2029 (%)
- Exhibits57: Data Table on Residential - Year-over-year growth 2024-2029 (%)
- Exhibits58: Chart on Commercial - Market size and forecast 2024-2029 ($ million)
- Exhibits59: Data Table on Commercial - Market size and forecast 2024-2029 ($ million)
- Exhibits60: Chart on Commercial - Year-over-year growth 2024-2029 (%)
- Exhibits61: Data Table on Commercial - Year-over-year growth 2024-2029 (%)
- Exhibits62: Market opportunity by Application ($ million)
- Exhibits63: Data Table on Market opportunity by Application ($ million)
- Exhibits64: Analysis of price sensitivity, lifecycle, customer purchase basket, adoption rates, and purchase criteria
- Exhibits65: Chart on Market share By Geographical Landscape 2024-2029 (%)
- Exhibits66: Data Table on Market share By Geographical Landscape 2024-2029 (%)
- Exhibits67: Chart on Geographic comparison
- Exhibits68: Data Table on Geographic comparison
- Exhibits69: Chart on Europe - Market size and forecast 2024-2029 ($ million)
- Exhibits70: Data Table on Europe - Market size and forecast 2024-2029 ($ million)
- Exhibits71: Chart on Europe - Year-over-year growth 2024-2029 (%)
- Exhibits72: Data Table on Europe - Year-over-year growth 2024-2029 (%)
- Exhibits73: Chart on APAC - Market size and forecast 2024-2029 ($ million)
- Exhibits74: Data Table on APAC - Market size and forecast 2024-2029 ($ million)
- Exhibits75: Chart on APAC - Year-over-year growth 2024-2029 (%)
- Exhibits76: Data Table on APAC - Year-over-year growth 2024-2029 (%)
- Exhibits77: Chart on North America - Market size and forecast 2024-2029 ($ million)
- Exhibits78: Data Table on North America - Market size and forecast 2024-2029 ($ million)
- Exhibits79: Chart on North America - Year-over-year growth 2024-2029 (%)
- Exhibits80: Data Table on North America - Year-over-year growth 2024-2029 (%)
- Exhibits81: Chart on Middle East and Africa - Market size and forecast 2024-2029 ($ million)
- Exhibits82: Data Table on Middle East and Africa - Market size and forecast 2024-2029 ($ million)
- Exhibits83: Chart on Middle East and Africa - Year-over-year growth 2024-2029 (%)
- Exhibits84: Data Table on Middle East and Africa - Year-over-year growth 2024-2029 (%)
- Exhibits85: Chart on South America - Market size and forecast 2024-2029 ($ million)
- Exhibits86: Data Table on South America - Market size and forecast 2024-2029 ($ million)
- Exhibits87: Chart on South America - Year-over-year growth 2024-2029 (%)
- Exhibits88: Data Table on South America - Year-over-year growth 2024-2029 (%)
- Exhibits89: Chart on Germany - Market size and forecast 2024-2029 ($ million)
- Exhibits90: Data Table on Germany - Market size and forecast 2024-2029 ($ million)
- Exhibits91: Chart on Germany - Year-over-year growth 2024-2029 (%)
- Exhibits92: Data Table on Germany - Year-over-year growth 2024-2029 (%)
- Exhibits93: Chart on US - Market size and forecast 2024-2029 ($ million)
- Exhibits94: Data Table on US - Market size and forecast 2024-2029 ($ million)
- Exhibits95: Chart on US - Year-over-year growth 2024-2029 (%)
- Exhibits96: Data Table on US - Year-over-year growth 2024-2029 (%)
- Exhibits97: Chart on UK - Market size and forecast 2024-2029 ($ million)
- Exhibits98: Data Table on UK - Market size and forecast 2024-2029 ($ million)
- Exhibits99: Chart on UK - Year-over-year growth 2024-2029 (%)
- Exhibits100: Data Table on UK - Year-over-year growth 2024-2029 (%)
- Exhibits101: Chart on France - Market size and forecast 2024-2029 ($ million)
- Exhibits102: Data Table on France - Market size and forecast 2024-2029 ($ million)
- Exhibits103: Chart on France - Year-over-year growth 2024-2029 (%)
- Exhibits104: Data Table on France - Year-over-year growth 2024-2029 (%)
- Exhibits105: Chart on China - Market size and forecast 2024-2029 ($ million)
- Exhibits106: Data Table on China - Market size and forecast 2024-2029 ($ million)
- Exhibits107: Chart on China - Year-over-year growth 2024-2029 (%)
- Exhibits108: Data Table on China - Year-over-year growth 2024-2029 (%)
- Exhibits109: Chart on Italy - Market size and forecast 2024-2029 ($ million)
- Exhibits110: Data Table on Italy - Market size and forecast 2024-2029 ($ million)
- Exhibits111: Chart on Italy - Year-over-year growth 2024-2029 (%)
- Exhibits112: Data Table on Italy - Year-over-year growth 2024-2029 (%)
- Exhibits113: Chart on Canada - Market size and forecast 2024-2029 ($ million)
- Exhibits114: Data Table on Canada - Market size and forecast 2024-2029 ($ million)
- Exhibits115: Chart on Canada - Year-over-year growth 2024-2029 (%)
- Exhibits116: Data Table on Canada - Year-over-year growth 2024-2029 (%)
- Exhibits117: Chart on Japan - Market size and forecast 2024-2029 ($ million)
- Exhibits118: Data Table on Japan - Market size and forecast 2024-2029 ($ million)
- Exhibits119: Chart on Japan - Year-over-year growth 2024-2029 (%)
- Exhibits120: Data Table on Japan - Year-over-year growth 2024-2029 (%)
- Exhibits121: Chart on India - Market size and forecast 2024-2029 ($ million)
- Exhibits122: Data Table on India - Market size and forecast 2024-2029 ($ million)
- Exhibits123: Chart on India - Year-over-year growth 2024-2029 (%)
- Exhibits124: Data Table on India - Year-over-year growth 2024-2029 (%)
- Exhibits125: Chart on South Korea - Market size and forecast 2024-2029 ($ million)
- Exhibits126: Data Table on South Korea - Market size and forecast 2024-2029 ($ million)
- Exhibits127: Chart on South Korea - Year-over-year growth 2024-2029 (%)
- Exhibits128: Data Table on South Korea - Year-over-year growth 2024-2029 (%)
- Exhibits129: Market opportunity By Geographical Landscape ($ million)
- Exhibits130: Data Tables on Market opportunity By Geographical Landscape ($ million)
- Exhibits131: Impact of drivers and challenges in 2024 and 2029
- Exhibits132: Overview on criticality of inputs and factors of differentiation
- Exhibits133: Overview on factors of disruption
- Exhibits134: Impact of key risks on business
- Exhibits135: Companies covered
- Exhibits136: Company ranking index
- Exhibits137: Matrix on companies position and classification
- Exhibits138: AB Volvo - Overview
- Exhibits139: AB Volvo - Business segments
- Exhibits140: AB Volvo - Key news
- Exhibits141: AB Volvo - Key offerings
- Exhibits142: AB Volvo - Segment focus
- Exhibits143: SWOT
- Exhibits144: Bayerische Motoren Werke AG - Overview
- Exhibits145: Bayerische Motoren Werke AG - Business segments
- Exhibits146: Bayerische Motoren Werke AG - Key news
- Exhibits147: Bayerische Motoren Werke AG - Key offerings
- Exhibits148: Bayerische Motoren Werke AG - Segment focus
- Exhibits149: SWOT
- Exhibits150: Dr. Ing. h.c. F. Porsche AG - Overview
- Exhibits151: Dr. Ing. h.c. F. Porsche AG - Product / Service
- Exhibits152: Dr. Ing. h.c. F. Porsche AG - Key offerings
- Exhibits153: SWOT
- Exhibits154: Ford Motor Co. - Overview
- Exhibits155: Ford Motor Co. - Business segments
- Exhibits156: Ford Motor Co. - Key offerings
- Exhibits157: Ford Motor Co. - Segment focus
- Exhibits158: SWOT
- Exhibits159: General Motors Co. - Overview
- Exhibits160: General Motors Co. - Business segments
- Exhibits161: General Motors Co. - Key news
- Exhibits162: General Motors Co. - Key offerings
- Exhibits163: General Motors Co. - Segment focus
- Exhibits164: SWOT
- Exhibits165: Honda Motor Co. Ltd. - Overview
- Exhibits166: Honda Motor Co. Ltd. - Business segments
- Exhibits167: Honda Motor Co. Ltd. - Key offerings
- Exhibits168: Honda Motor Co. Ltd. - Segment focus
- Exhibits169: SWOT
- Exhibits170: Mahindra and Mahindra Ltd. - Overview
- Exhibits171: Mahindra and Mahindra Ltd. - Business segments
- Exhibits172: Mahindra and Mahindra Ltd. - Key news
- Exhibits173: Mahindra and Mahindra Ltd. - Key offerings
- Exhibits174: Mahindra and Mahindra Ltd. - Segment focus
- Exhibits175: SWOT
- Exhibits176: Mercedes Benz Group AG - Overview
- Exhibits177: Mercedes Benz Group AG - Product / Service
- Exhibits178: Mercedes Benz Group AG - Key offerings
- Exhibits179: SWOT
- Exhibits180: Nissan Motor Co. Ltd. - Overview
- Exhibits181: Nissan Motor Co. Ltd. - Business segments
- Exhibits182: Nissan Motor Co. Ltd. - Key news
- Exhibits183: Nissan Motor Co. Ltd. - Key offerings
- Exhibits184: Nissan Motor Co. Ltd. - Segment focus
- Exhibits185: SWOT
- Exhibits186: Rairdons Subaru of Auburn - Overview
- Exhibits187: Rairdons Subaru of Auburn - Product / Service
- Exhibits188: Rairdons Subaru of Auburn - Key offerings
- Exhibits189: SWOT
- Exhibits190: Renault SAS - Overview
- Exhibits191: Renault SAS - Product / Service
- Exhibits192: Renault SAS - Key news
- Exhibits193: Renault SAS - Key offerings
- Exhibits194: SWOT
- Exhibits195: SsangYong Motor Co. - Overview
- Exhibits196: SsangYong Motor Co. - Product / Service
- Exhibits197: SsangYong Motor Co. - Key offerings
- Exhibits198: SWOT
- Exhibits199: Tesla Inc. - Overview
- Exhibits200: Tesla Inc. - Business segments
- Exhibits201: Tesla Inc. - Key news
- Exhibits202: Tesla Inc. - Key offerings
- Exhibits203: Tesla Inc. - Segment focus
- Exhibits204: SWOT
- Exhibits205: Toyota Motor Corp. - Overview
- Exhibits206: Toyota Motor Corp. - Business segments
- Exhibits207: Toyota Motor Corp. - Key news
- Exhibits208: Toyota Motor Corp. - Key offerings
- Exhibits209: Toyota Motor Corp. - Segment focus
- Exhibits210: SWOT
- Exhibits211: Volkswagen AG - Overview
- Exhibits212: Volkswagen AG - Business segments
- Exhibits213: Volkswagen AG - Key news
- Exhibits214: Volkswagen AG - Key offerings
- Exhibits215: Volkswagen AG - Segment focus
- Exhibits216: SWOT
- Exhibits217: Inclusions checklist
- Exhibits218: Exclusions checklist
- Exhibits219: Currency conversion rates for US$
- Exhibits220: Research methodology
- Exhibits221: Information sources
- Exhibits222: Data validation
- Exhibits223: Validation techniques employed for market sizing
- Exhibits224: Data synthesis
- Exhibits225: 360 degree market analysis
- Exhibits226: List of abbreviations
In-Car Wi-Fi Market 2025-2029
The in-car wi-fi market is forecasted to grow by USD 1789262.4 mn during 2024-2029, accelerating at a CAGR of 96.4% during the forecast period. The report on the in-car wi-fi market provides a holistic analysis, market size and forecast, trends, growth drivers, and challenges, as well as vendor analysis covering around 25 vendors.
The report offers an up-to-date analysis regarding the current market scenario, the latest trends and drivers, and the overall market environment. The market is driven by wide range of data plans for in-car wi-fi to suit individual needs, growing demand for in-vehicle infotainment, and improved internet bandwidth for cars.
| Market Scope | |
|---|---|
| Base Year | 2025 |
| End Year | 2029 |
| Series Year | 2025-2029 |
| Growth Momentum | Accelerate |
| YOY 2025 | 75.3% |
| CAGR | 96.4% |
| Incremental Value | $1789262.4 mn |
Technavio's in-car wi-fi market is segmented as below:
By Technology
- 3G and 4G
- 5G
By Application
- Residential
- Commercial
By Geographical Landscape
- Europe
- APAC
- North America
- Middle East and Africa
- South America
This study identifies the big data platform provided by connected cars as one of the prime reasons driving the in-car wi-fi market growth during the next few years. Also, ota updates for software components and connected vehicle technology and iot will lead to sizable demand in the market.
The report on the in-car wi-fi market covers the following areas:
- In-Car Wi-Fi Market sizing
- In-Car Wi-Fi Market forecast
- In-Car Wi-Fi Market industry analysis
The robust vendor analysis is designed to help clients improve their market position, and in line with this, this report provides a detailed analysis of several leading in-car wi-fi market vendors that include AB Volvo, Bayerische Motoren Werke AG, BYD Co. Ltd., Chongqing Changan Automobile Co. Ltd., Dr. Ing. h.c. F. Porsche AG, Ford Motor Co., General Motors Co., Honda Motor Co. Ltd., KIA CORP., Mahindra and Mahindra Ltd., Mercedes Benz Group AG, Mitsubishi Motors Corp., NIO Ltd., Nissan Motor Co. Ltd., Rairdons Subaru of Auburn, Renault SAS, SsangYong Motor Co., Tesla Inc., Toyota Motor Corp., and Volkswagen AG. Also, the in-car wi-fi market analysis report includes information on upcoming trends and challenges that will influence market growth. This is to help companies strategize and leverage all forthcoming growth opportunities.
The study was conducted using an objective combination of primary and secondary information including inputs from key participants in the industry. The report contains a comprehensive market and vendor landscape in addition to an analysis of the key vendors.
The publisher presents a detailed picture of the market by the way of study, synthesis, and summation of data from multiple sources by an analysis of key parameters such as profit, pricing, competition, and promotions. It presents various market facets by identifying the key industry influencers. The data presented is comprehensive, reliable, and a result of extensive primary and secondary research. The market research reports provide a complete competitive landscape and an in-depth vendor selection methodology and analysis using qualitative and quantitative research to forecast accurate market growth.
Table of Contents
1 Executive Summary
- 1.1 Market overview
- Executive Summary - Chart on Market Overview
- Executive Summary - Data Table on Market Overview
- Executive Summary - Chart on Global Market Characteristics
- Executive Summary - Chart on Market By Geographical Landscape
- Executive Summary - Chart on Market Segmentation by Technology
- Executive Summary - Chart on Market Segmentation by Application
- Executive Summary - Chart on Incremental Growth
- Executive Summary - Data Table on Incremental Growth
- Executive Summary - Chart on Company Market Positioning
2 Technavio Analysis
- 2.1 Analysis of price sensitivity, lifecycle, customer purchase basket, adoption rates, and purchase criteria
- Analysis of price sensitivity, lifecycle, customer purchase basket, adoption rates, and purchase criteria
- 2.2 Criticality of inputs and Factors of differentiation
- Overview on criticality of inputs and factors of differentiation
- 2.3 Factors of disruption
- Overview on factors of disruption
- 2.4 Impact of drivers and challenges
- Impact of drivers and challenges in 2024 and 2029
3 Market Landscape
- 3.1 Market ecosystem
- Parent Market
- Data Table on - Parent Market
- 3.2 Market characteristics
- Market characteristics analysis
- 3.3 Value chain analysis
- Value chain analysis
4 Market Sizing
- 4.1 Market definition
- Offerings of companies included in the market definition
- 4.2 Market segment analysis
- Market segments
- 4.3 Market size 2024
- 4.4 Market outlook: Forecast for 2024-2029
- Chart on Global - Market size and forecast 2024-2029 ($ million)
- Data Table on Global - Market size and forecast 2024-2029 ($ million)
- Chart on Global Market: Year-over-year growth 2024-2029 (%)
- Data Table on Global Market: Year-over-year growth 2024-2029 (%)
5 Historic Market Size
- 5.1 Global In-Car Wi-Fi Market 2019 - 2023
- Historic Market Size - Data Table on Global In-Car Wi-Fi Market 2019 - 2023 ($ million)
- 5.2 Technology segment analysis 2019 - 2023
- Historic Market Size - Technology Segment 2019 - 2023 ($ million)
- 5.3 Application segment analysis 2019 - 2023
- Historic Market Size - Application Segment 2019 - 2023 ($ million)
- 5.4 Geography segment analysis 2019 - 2023
- Historic Market Size - Geography Segment 2019 - 2023 ($ million)
- 5.5 Country segment analysis 2019 - 2023
- Historic Market Size - Country Segment 2019 - 2023 ($ million)
6 Qualitative Analysis
- 6.1 Impact of AI on the Global In-Car Wi-Fi Market
7 Five Forces Analysis
- 7.1 Five forces summary
- Five forces analysis - Comparison between 2024 and 2029
- 7.2 Bargaining power of buyers
- Bargaining power of buyers - Impact of key factors 2024 and 2029
- 7.3 Bargaining power of suppliers
- Bargaining power of suppliers - Impact of key factors in 2024 and 2029
- 7.4 Threat of new entrants
- Threat of new entrants - Impact of key factors in 2024 and 2029
- 7.5 Threat of substitutes
- Threat of substitutes - Impact of key factors in 2024 and 2029
- 7.6 Threat of rivalry
- Threat of rivalry - Impact of key factors in 2024 and 2029
- 7.7 Market condition
- Chart on Market condition - Five forces 2024 and 2029
8 Market Segmentation by Technology
- 8.1 Market segments
- Chart on Technology - Market share 2024-2029 (%)
- Data Table on Technology - Market share 2024-2029 (%)
- 8.2 Comparison by Technology
- Chart on Comparison by Technology
- Data Table on Comparison by Technology
- 3G and 4G - Market size and forecast 2024-2029
- Chart on 3G and 4G - Market size and forecast 2024-2029 ($ million)
- Data Table on 3G and 4G - Market size and forecast 2024-2029 ($ million)
- Chart on 3G and 4G - Year-over-year growth 2024-2029 (%)
- Data Table on 3G and 4G - Year-over-year growth 2024-2029 (%)
- 5G - Market size and forecast 2024-2029
- Chart on 5G - Market size and forecast 2024-2029 ($ million)
- Data Table on 5G - Market size and forecast 2024-2029 ($ million)
- Chart on 5G - Year-over-year growth 2024-2029 (%)
- Data Table on 5G - Year-over-year growth 2024-2029 (%)
- 8.5 Market opportunity by Technology
- Market opportunity by Technology ($ million)
- Data Table on Market opportunity by Technology ($ million)
9 Market Segmentation by Application
- 9.1 Market segments
- Chart on Application - Market share 2024-2029 (%)
- Data Table on Application - Market share 2024-2029 (%)
- 9.2 Comparison by Application
- Chart on Comparison by Application
- Data Table on Comparison by Application
- 9.3 Residential - Market size and forecast 2024-2029
- Chart on Residential - Market size and forecast 2024-2029 ($ million)
- Data Table on Residential - Market size and forecast 2024-2029 ($ million)
- Chart on Residential - Year-over-year growth 2024-2029 (%)
- Data Table on Residential - Year-over-year growth 2024-2029 (%)
- 9.4 Commercial - Market size and forecast 2024-2029
- Chart on Commercial - Market size and forecast 2024-2029 ($ million)
- Data Table on Commercial - Market size and forecast 2024-2029 ($ million)
- Chart on Commercial - Year-over-year growth 2024-2029 (%)
- Data Table on Commercial - Year-over-year growth 2024-2029 (%)
- 9.5 Market opportunity by Application
- Market opportunity by Application ($ million)
- Data Table on Market opportunity by Application ($ million)
10 Customer Landscape
- 10.1 Customer landscape overview
- Analysis of price sensitivity, lifecycle, customer purchase basket, adoption rates, and purchase criteria
11 Geographic Landscape
- 11.1 Geographic segmentation
- Chart on Market share By Geographical Landscape 2024-2029 (%)
- Data Table on Market share By Geographical Landscape 2024-2029 (%)
- 11.2 Geographic comparison
- Chart on Geographic comparison
- Data Table on Geographic comparison
- 11.3 Europe - Market size and forecast 2024-2029
- Chart on Europe - Market size and forecast 2024-2029 ($ million)
- Data Table on Europe - Market size and forecast 2024-2029 ($ million)
- Chart on Europe - Year-over-year growth 2024-2029 (%)
- Data Table on Europe - Year-over-year growth 2024-2029 (%)
- 11.4 APAC - Market size and forecast 2024-2029
- Chart on APAC - Market size and forecast 2024-2029 ($ million)
- Data Table on APAC - Market size and forecast 2024-2029 ($ million)
- Chart on APAC - Year-over-year growth 2024-2029 (%)
- Data Table on APAC - Year-over-year growth 2024-2029 (%)
- 11.5 North America - Market size and forecast 2024-2029
- Chart on North America - Market size and forecast 2024-2029 ($ million)
- Data Table on North America - Market size and forecast 2024-2029 ($ million)
- Chart on North America - Year-over-year growth 2024-2029 (%)
- Data Table on North America - Year-over-year growth 2024-2029 (%)
- 11.6 Middle East and Africa - Market size and forecast 2024-2029
- Chart on Middle East and Africa - Market size and forecast 2024-2029 ($ million)
- Data Table on Middle East and Africa - Market size and forecast 2024-2029 ($ million)
- Chart on Middle East and Africa - Year-over-year growth 2024-2029 (%)
- Data Table on Middle East and Africa - Year-over-year growth 2024-2029 (%)
- 11.7 South America - Market size and forecast 2024-2029
- Chart on South America - Market size and forecast 2024-2029 ($ million)
- Data Table on South America - Market size and forecast 2024-2029 ($ million)
- Chart on South America - Year-over-year growth 2024-2029 (%)
- Data Table on South America - Year-over-year growth 2024-2029 (%)
- 11.8 Germany - Market size and forecast 2024-2029
- Chart on Germany - Market size and forecast 2024-2029 ($ million)
- Data Table on Germany - Market size and forecast 2024-2029 ($ million)
- Chart on Germany - Year-over-year growth 2024-2029 (%)
- Data Table on Germany - Year-over-year growth 2024-2029 (%)
- 11.9 US - Market size and forecast 2024-2029
- Chart on US - Market size and forecast 2024-2029 ($ million)
- Data Table on US - Market size and forecast 2024-2029 ($ million)
- Chart on US - Year-over-year growth 2024-2029 (%)
- Data Table on US - Year-over-year growth 2024-2029 (%)
- 11.10 UK - Market size and forecast 2024-2029
- Chart on UK - Market size and forecast 2024-2029 ($ million)
- Data Table on UK - Market size and forecast 2024-2029 ($ million)
- Chart on UK - Year-over-year growth 2024-2029 (%)
- Data Table on UK - Year-over-year growth 2024-2029 (%)
- 11.11 France - Market size and forecast 2024-2029
- Chart on France - Market size and forecast 2024-2029 ($ million)
- Data Table on France - Market size and forecast 2024-2029 ($ million)
- Chart on France - Year-over-year growth 2024-2029 (%)
- Data Table on France - Year-over-year growth 2024-2029 (%)
- 11.12 China - Market size and forecast 2024-2029
- Chart on China - Market size and forecast 2024-2029 ($ million)
- Data Table on China - Market size and forecast 2024-2029 ($ million)
- Chart on China - Year-over-year growth 2024-2029 (%)
- Data Table on China - Year-over-year growth 2024-2029 (%)
- 11.13 Italy - Market size and forecast 2024-2029
- Chart on Italy - Market size and forecast 2024-2029 ($ million)
- Data Table on Italy - Market size and forecast 2024-2029 ($ million)
- Chart on Italy - Year-over-year growth 2024-2029 (%)
- Data Table on Italy - Year-over-year growth 2024-2029 (%)
- 11.14 Canada - Market size and forecast 2024-2029
- Chart on Canada - Market size and forecast 2024-2029 ($ million)
- Data Table on Canada - Market size and forecast 2024-2029 ($ million)
- Chart on Canada - Year-over-year growth 2024-2029 (%)
- Data Table on Canada - Year-over-year growth 2024-2029 (%)
- 11.15 Japan - Market size and forecast 2024-2029
- Chart on Japan - Market size and forecast 2024-2029 ($ million)
- Data Table on Japan - Market size and forecast 2024-2029 ($ million)
- Chart on Japan - Year-over-year growth 2024-2029 (%)
- Data Table on Japan - Year-over-year growth 2024-2029 (%)
- 11.16 India - Market size and forecast 2024-2029
- Chart on India - Market size and forecast 2024-2029 ($ million)
- Data Table on India - Market size and forecast 2024-2029 ($ million)
- Chart on India - Year-over-year growth 2024-2029 (%)
- Data Table on India - Year-over-year growth 2024-2029 (%)
- 11.17 South Korea - Market size and forecast 2024-2029
- Chart on South Korea - Market size and forecast 2024-2029 ($ million)
- Data Table on South Korea - Market size and forecast 2024-2029 ($ million)
- Chart on South Korea - Year-over-year growth 2024-2029 (%)
- Data Table on South Korea - Year-over-year growth 2024-2029 (%)
- 11.18 Market opportunity By Geographical Landscape
- Market opportunity By Geographical Landscape ($ million)
- Data Tables on Market opportunity By Geographical Landscape ($ million)
12 Drivers, Challenges, and Opportunity/Restraints
- 12.1 Market drivers
- 12.2 Market challenges
- 12.3 Impact of drivers and challenges
- Impact of drivers and challenges in 2024 and 2029
- 12.4 Market opportunities/restraints
13 Competitive Landscape
- 13.1 Overview
- 13.2 Competitive Landscape
- Overview on criticality of inputs and factors of differentiation
- 13.3 Landscape disruption
- Overview on factors of disruption
- 13.4 Industry risks
- Impact of key risks on business
14 Competitive Analysis
- 14.1 Companies profiled
- Companies covered
- 14.2 Company ranking index
- Company ranking index
- 14.3 Market positioning of companies
- Matrix on companies position and classification
- 14.4 AB Volvo
- AB Volvo - Overview
- AB Volvo - Business segments
- AB Volvo - Key news
- AB Volvo - Key offerings
- AB Volvo - Segment focus
- SWOT
- 14.5 Bayerische Motoren Werke AG
- Bayerische Motoren Werke AG - Overview
- Bayerische Motoren Werke AG - Business segments
- Bayerische Motoren Werke AG - Key news
- Bayerische Motoren Werke AG - Key offerings
- Bayerische Motoren Werke AG - Segment focus
- SWOT
- 14.6 Dr. Ing. h.c. F. Porsche AG
- Dr. Ing. h.c. F. Porsche AG - Overview
- Dr. Ing. h.c. F. Porsche AG - Product / Service
- Dr. Ing. h.c. F. Porsche AG - Key offerings
- SWOT
- 14.7 Ford Motor Co.
- Ford Motor Co. - Overview
- Ford Motor Co. - Business segments
- Ford Motor Co. - Key offerings
- Ford Motor Co. - Segment focus
- SWOT
- 14.8 General Motors Co.
- General Motors Co. - Overview
- General Motors Co. - Business segments
- General Motors Co. - Key news
- General Motors Co. - Key offerings
- General Motors Co. - Segment focus
- SWOT
- 14.9 Honda Motor Co. Ltd.
- Honda Motor Co. Ltd. - Overview
- Honda Motor Co. Ltd. - Business segments
- Honda Motor Co. Ltd. - Key offerings
- Honda Motor Co. Ltd. - Segment focus
- SWOT
- 14.10 Mahindra and Mahindra Ltd.
- Mahindra and Mahindra Ltd. - Overview
- Mahindra and Mahindra Ltd. - Business segments
- Mahindra and Mahindra Ltd. - Key news
- Mahindra and Mahindra Ltd. - Key offerings
- Mahindra and Mahindra Ltd. - Segment focus
- SWOT
- 14.11 Mercedes Benz Group AG
- Mercedes Benz Group AG - Overview
- Mercedes Benz Group AG - Product / Service
- Mercedes Benz Group AG - Key offerings
- SWOT
- 14.12 Nissan Motor Co. Ltd.
- Nissan Motor Co. Ltd. - Overview
- Nissan Motor Co. Ltd. - Business segments
- Nissan Motor Co. Ltd. - Key news
- Nissan Motor Co. Ltd. - Key offerings
- Nissan Motor Co. Ltd. - Segment focus
- SWOT
- 14.13 Rairdons Subaru of Auburn
- Rairdons Subaru of Auburn - Overview
- Rairdons Subaru of Auburn - Product / Service
- Rairdons Subaru of Auburn - Key offerings
- SWOT
- 14.14 Renault SAS
- Renault SAS - Overview
- Renault SAS - Product / Service
- Renault SAS - Key news
- Renault SAS - Key offerings
- SWOT
- 14.15 SsangYong Motor Co.
- SsangYong Motor Co. - Overview
- SsangYong Motor Co. - Product / Service
- SsangYong Motor Co. - Key offerings
- SWOT
- 14.16 Tesla Inc.
- Tesla Inc. - Overview
- Tesla Inc. - Business segments
- Tesla Inc. - Key news
- Tesla Inc. - Key offerings
- Tesla Inc. - Segment focus
- SWOT
- 14.17 Toyota Motor Corp.
- Toyota Motor Corp. - Overview
- Toyota Motor Corp. - Business segments
- Toyota Motor Corp. - Key news
- Toyota Motor Corp. - Key offerings
- Toyota Motor Corp. - Segment focus
- SWOT
- 14.18 Volkswagen AG
- Volkswagen AG - Overview
- Volkswagen AG - Business segments
- Volkswagen AG - Key news
- Volkswagen AG - Key offerings
- Volkswagen AG - Segment focus
- SWOT
15 Appendix
- 15.1 Scope of the report
- 15.2 Inclusions and exclusions checklist
- Inclusions checklist
- Exclusions checklist
- 15.3 Currency conversion rates for US$
- Currency conversion rates for US$
- 15.4 Research methodology
- Research methodology
- 15.5 Data procurement
- Information sources
- 15.6 Data validation
- Data validation
- 15.7 Validation techniques employed for market sizing
- Validation techniques employed for market sizing
- 15.8 Data synthesis
- Data synthesis
- 15.9 360 degree market analysis
- 360 degree market analysis
- 15.10 List of abbreviations
- List of abbreviations

