|
|
市場調査レポート
商品コード
1626372
舶用燃料電池の世界市場 2025-2029年Global Fuel Cells for Marine Vessels Market 2025-2029 |
||||||

|
|||||||
カスタマイズ可能
|
|||||||

| 舶用燃料電池の世界市場 2025-2029年 |
|
出版日: 2024年12月17日
発行: TechNavio
ページ情報: 英文 207 Pages
納期: 即納可能
|

全表示
- 概要
- 図表
- 目次
舶用燃料電池市場 2025-2029年
舶用燃料電池市場は2024-2029年に2億3,460万米ドル、予測期間中のCAGRは7.8%で成長すると予測されます。当レポートでは、舶用燃料電池市場の全体的な分析、市場規模・予測、動向、成長促進要因、課題、約25のベンダーを網羅したベンダー分析などを掲載しています。
現在の市場シナリオ、最新動向と促進要因、市場環境全体に関する最新分析を提供しています。市場は、代替推進システムの需要、海洋推進産業の急速な市場開拓、排ガス規制に関する規制政策によって牽引されています。
| 市場範囲 | |
|---|---|
| 基準年 | 2025 |
| 終了年 | 2029 |
| 予測期間 | 2025-2029 |
| 成長モメンタム | 加速 |
| 前年比2025年 | 6.8% |
| CAGR | 7.8% |
| 増分額 | 2億3,460万米ドル |
本調査では、燃料電池技術の研究開発活動の活発化が、今後数年間の舶用燃料電池市場成長を牽引する主要因の1つであると分析しています。また、AIP技術の採用とハイブリッド推進システムの出現は、市場の大きな需要につながります。
目次
第1章 エグゼクティブサマリー
- 市場概要
第2章 Technavio別分析
- 価格・ライフサイクル・顧客購入バスケット・採用率・購入基準の分析
- インプットの重要性と差別化の要因
- 混乱の要因
- 促進要因と課題の影響
第3章 市場情勢
- 市場エコシステム
- 市場の特徴
- バリューチェーン分析
第4章 市場規模
- 市場の定義
- 市場セグメント分析
- 市場規模 2024
- 市場の見通し 2024-2029
第5章 市場規模実績
- 舶用燃料電池の世界市場 2019-2023
- 用途別セグメント分析 2019-2023
- 技術別セグメント分析 2019-2023
- 地域別セグメント分析 2019-2023
- 国別セグメント分析 2019-2023
第6章 定性分析
- AIの影響:舶用燃料電池の世界市場
第7章 ファイブフォース分析
- ファイブフォースの要約
- 買い手の交渉力
- 供給企業の交渉力
- 新規参入業者の脅威
- 代替品の脅威
- 競争の脅威
- 市況
第8章 市場セグメンテーション:用途別
- 市場セグメント
- 比較:用途別
- 商業用:市場規模と予測 2024-2029
- 軍隊:市場規模と予測 2024-2029
- その他:市場規模と予測 2024-2029
- 市場機会:用途別
第9章 市場セグメンテーション:技術別
- 市場セグメント
- 比較:技術別
- PEMFC:市場規模と予測 2024-2029
- SOFC:市場規模と予測 2024-2029
- その他の燃料電池:市場規模と予測 2024-2029
- 市場機会:技術別
第10章 顧客情勢
- 顧客情勢の概要
第11章 地域別情勢
- 地域別セグメンテーション
- 地域別比較
- 北米:市場規模と予測 2024-2029
- アジア太平洋:市場規模と予測 2024-2029
- 欧州:市場規模と予測 2024-2029
- 中東・アフリカ:市場規模と予測 2024-2029
- 南米:市場規模と予測 2024-2029
- 米国:市場規模と予測 2024-2029
- 中国:市場規模と予測 2024-2029
- カナダ:市場規模と予測 2024-2029
- ドイツ:市場規模と予測 2024-2029
- 日本:市場規模と予測 2024-2029
- 英国:市場規模と予測 2024-2029
- インド:市場規模と予測 2024-2029
- フランス:市場規模と予測 2024-2029
- 韓国:市場規模と予測 2024-2029
- サウジアラビア:市場規模と予測 2024-2029
- 市場機会:地域情勢別
第12章 促進要因・課題・機会・抑制要因
- 市場促進要因
- 市場の課題
- 促進要因と課題の影響
- 市場の機会・抑制要因
第13章 競合情勢
- 概要
- 競合情勢
- 混乱の状況
- 業界のリスク
第14章 競合分析
- 企業プロファイル
- 企業ランキング指数
- 企業の市場ポジショニング
- ABB Ltd.
- Advent Technologies Holdings Inc.
- Ballard Power Systems Inc.
- Bloom Energy Corp.
- General Electric Co.
- Hyster Yale Materials Handling Inc.
- MEYER WERFT GmbH and Co. KG
- Nedstack Fuel Cell Technology BV
- Plug Power Inc.
- Proton Motor Power Systems PLC
- SFC Energy AG
- Siemens AG
- TECO 2030 ASA
- Toshiba Corp.
- Watt Fuel Cell Corp.
第15章 付録
Exhibits:
- Exhibits1: Executive Summary - Chart on Market Overview
- Exhibits2: Executive Summary - Data Table on Market Overview
- Exhibits3: Executive Summary - Chart on Global Market Characteristics
- Exhibits4: Executive Summary - Chart on Market By Geographical Landscape
- Exhibits5: Executive Summary - Chart on Market Segmentation by Application
- Exhibits6: Executive Summary - Chart on Market Segmentation by Technology
- Exhibits7: Executive Summary - Chart on Incremental Growth
- Exhibits8: Executive Summary - Data Table on Incremental Growth
- Exhibits9: Executive Summary - Chart on Company Market Positioning
- Exhibits10: Analysis of price sensitivity, lifecycle, customer purchase basket, adoption rates, and purchase criteria
- Exhibits11: Overview on criticality of inputs and factors of differentiation
- Exhibits12: Overview on factors of disruption
- Exhibits13: Impact of drivers and challenges in 2024 and 2029
- Exhibits14: Parent Market
- Exhibits15: Data Table on - Parent Market
- Exhibits16: Market characteristics analysis
- Exhibits17: Value chain analysis
- Exhibits18: Offerings of companies included in the market definition
- Exhibits19: Market segments
- Exhibits20: Chart on Global - Market size and forecast 2024-2029 ($ million)
- Exhibits21: Data Table on Global - Market size and forecast 2024-2029 ($ million)
- Exhibits22: Chart on Global Market: Year-over-year growth 2024-2029 (%)
- Exhibits23: Data Table on Global Market: Year-over-year growth 2024-2029 (%)
- Exhibits24: Historic Market Size - Data Table on Global Fuel Cells For Marine Vessels Market 2019 - 2023 ($ million)
- Exhibits25: Historic Market Size - Application Segment 2019 - 2023 ($ million)
- Exhibits26: Historic Market Size - Technology Segment 2019 - 2023 ($ million)
- Exhibits27: Historic Market Size - Geography Segment 2019 - 2023 ($ million)
- Exhibits28: Historic Market Size - Country Segment 2019 - 2023 ($ million)
- Exhibits29: Five forces analysis - Comparison between 2024 and 2029
- Exhibits30: Bargaining power of buyers - Impact of key factors 2024 and 2029
- Exhibits31: Bargaining power of suppliers - Impact of key factors in 2024 and 2029
- Exhibits32: Threat of new entrants - Impact of key factors in 2024 and 2029
- Exhibits33: Threat of substitutes - Impact of key factors in 2024 and 2029
- Exhibits34: Threat of rivalry - Impact of key factors in 2024 and 2029
- Exhibits35: Chart on Market condition - Five forces 2024 and 2029
- Exhibits36: Chart on Application - Market share 2024-2029 (%)
- Exhibits37: Data Table on Application - Market share 2024-2029 (%)
- Exhibits38: Chart on Comparison by Application
- Exhibits39: Data Table on Comparison by Application
- Exhibits40: Chart on Commercial - Market size and forecast 2024-2029 ($ million)
- Exhibits41: Data Table on Commercial - Market size and forecast 2024-2029 ($ million)
- Exhibits42: Chart on Commercial - Year-over-year growth 2024-2029 (%)
- Exhibits43: Data Table on Commercial - Year-over-year growth 2024-2029 (%)
- Exhibits44: Chart on Military - Market size and forecast 2024-2029 ($ million)
- Exhibits45: Data Table on Military - Market size and forecast 2024-2029 ($ million)
- Exhibits46: Chart on Military - Year-over-year growth 2024-2029 (%)
- Exhibits47: Data Table on Military - Year-over-year growth 2024-2029 (%)
- Exhibits48: Chart on Others - Market size and forecast 2024-2029 ($ million)
- Exhibits49: Data Table on Others - Market size and forecast 2024-2029 ($ million)
- Exhibits50: Chart on Others - Year-over-year growth 2024-2029 (%)
- Exhibits51: Data Table on Others - Year-over-year growth 2024-2029 (%)
- Exhibits52: Market opportunity by Application ($ million)
- Exhibits53: Data Table on Market opportunity by Application ($ million)
- Exhibits54: Chart on Technology - Market share 2024-2029 (%)
- Exhibits55: Data Table on Technology - Market share 2024-2029 (%)
- Exhibits56: Chart on Comparison by Technology
- Exhibits57: Data Table on Comparison by Technology
- Exhibits58: Chart on PEMFC - Market size and forecast 2024-2029 ($ million)
- Exhibits59: Data Table on PEMFC - Market size and forecast 2024-2029 ($ million)
- Exhibits60: Chart on PEMFC - Year-over-year growth 2024-2029 (%)
- Exhibits61: Data Table on PEMFC - Year-over-year growth 2024-2029 (%)
- Exhibits62: Chart on SOFC - Market size and forecast 2024-2029 ($ million)
- Exhibits63: Data Table on SOFC - Market size and forecast 2024-2029 ($ million)
- Exhibits64: Chart on SOFC - Year-over-year growth 2024-2029 (%)
- Exhibits65: Data Table on SOFC - Year-over-year growth 2024-2029 (%)
- Exhibits66: Chart on Other fuel cells - Market size and forecast 2024-2029 ($ million)
- Exhibits67: Data Table on Other fuel cells - Market size and forecast 2024-2029 ($ million)
- Exhibits68: Chart on Other fuel cells - Year-over-year growth 2024-2029 (%)
- Exhibits69: Data Table on Other fuel cells - Year-over-year growth 2024-2029 (%)
- Exhibits70: Market opportunity by Technology ($ million)
- Exhibits71: Data Table on Market opportunity by Technology ($ million)
- Exhibits72: Analysis of price sensitivity, lifecycle, customer purchase basket, adoption rates, and purchase criteria
- Exhibits73: Chart on Market share By Geographical Landscape 2024-2029 (%)
- Exhibits74: Data Table on Market share By Geographical Landscape 2024-2029 (%)
- Exhibits75: Chart on Geographic comparison
- Exhibits76: Data Table on Geographic comparison
- Exhibits77: Chart on North America - Market size and forecast 2024-2029 ($ million)
- Exhibits78: Data Table on North America - Market size and forecast 2024-2029 ($ million)
- Exhibits79: Chart on North America - Year-over-year growth 2024-2029 (%)
- Exhibits80: Data Table on North America - Year-over-year growth 2024-2029 (%)
- Exhibits81: Chart on APAC - Market size and forecast 2024-2029 ($ million)
- Exhibits82: Data Table on APAC - Market size and forecast 2024-2029 ($ million)
- Exhibits83: Chart on APAC - Year-over-year growth 2024-2029 (%)
- Exhibits84: Data Table on APAC - Year-over-year growth 2024-2029 (%)
- Exhibits85: Chart on Europe - Market size and forecast 2024-2029 ($ million)
- Exhibits86: Data Table on Europe - Market size and forecast 2024-2029 ($ million)
- Exhibits87: Chart on Europe - Year-over-year growth 2024-2029 (%)
- Exhibits88: Data Table on Europe - Year-over-year growth 2024-2029 (%)
- Exhibits89: Chart on Middle East and Africa - Market size and forecast 2024-2029 ($ million)
- Exhibits90: Data Table on Middle East and Africa - Market size and forecast 2024-2029 ($ million)
- Exhibits91: Chart on Middle East and Africa - Year-over-year growth 2024-2029 (%)
- Exhibits92: Data Table on Middle East and Africa - Year-over-year growth 2024-2029 (%)
- Exhibits93: Chart on South America - Market size and forecast 2024-2029 ($ million)
- Exhibits94: Data Table on South America - Market size and forecast 2024-2029 ($ million)
- Exhibits95: Chart on South America - Year-over-year growth 2024-2029 (%)
- Exhibits96: Data Table on South America - Year-over-year growth 2024-2029 (%)
- Exhibits97: Chart on US - Market size and forecast 2024-2029 ($ million)
- Exhibits98: Data Table on US - Market size and forecast 2024-2029 ($ million)
- Exhibits99: Chart on US - Year-over-year growth 2024-2029 (%)
- Exhibits100: Data Table on US - Year-over-year growth 2024-2029 (%)
- Exhibits101: Chart on China - Market size and forecast 2024-2029 ($ million)
- Exhibits102: Data Table on China - Market size and forecast 2024-2029 ($ million)
- Exhibits103: Chart on China - Year-over-year growth 2024-2029 (%)
- Exhibits104: Data Table on China - Year-over-year growth 2024-2029 (%)
- Exhibits105: Chart on Canada - Market size and forecast 2024-2029 ($ million)
- Exhibits106: Data Table on Canada - Market size and forecast 2024-2029 ($ million)
- Exhibits107: Chart on Canada - Year-over-year growth 2024-2029 (%)
- Exhibits108: Data Table on Canada - Year-over-year growth 2024-2029 (%)
- Exhibits109: Chart on Germany - Market size and forecast 2024-2029 ($ million)
- Exhibits110: Data Table on Germany - Market size and forecast 2024-2029 ($ million)
- Exhibits111: Chart on Germany - Year-over-year growth 2024-2029 (%)
- Exhibits112: Data Table on Germany - Year-over-year growth 2024-2029 (%)
- Exhibits113: Chart on Japan - Market size and forecast 2024-2029 ($ million)
- Exhibits114: Data Table on Japan - Market size and forecast 2024-2029 ($ million)
- Exhibits115: Chart on Japan - Year-over-year growth 2024-2029 (%)
- Exhibits116: Data Table on Japan - Year-over-year growth 2024-2029 (%)
- Exhibits117: Chart on UK - Market size and forecast 2024-2029 ($ million)
- Exhibits118: Data Table on UK - Market size and forecast 2024-2029 ($ million)
- Exhibits119: Chart on UK - Year-over-year growth 2024-2029 (%)
- Exhibits120: Data Table on UK - Year-over-year growth 2024-2029 (%)
- Exhibits121: Chart on India - Market size and forecast 2024-2029 ($ million)
- Exhibits122: Data Table on India - Market size and forecast 2024-2029 ($ million)
- Exhibits123: Chart on India - Year-over-year growth 2024-2029 (%)
- Exhibits124: Data Table on India - Year-over-year growth 2024-2029 (%)
- Exhibits125: Chart on France - Market size and forecast 2024-2029 ($ million)
- Exhibits126: Data Table on France - Market size and forecast 2024-2029 ($ million)
- Exhibits127: Chart on France - Year-over-year growth 2024-2029 (%)
- Exhibits128: Data Table on France - Year-over-year growth 2024-2029 (%)
- Exhibits129: Chart on South Korea - Market size and forecast 2024-2029 ($ million)
- Exhibits130: Data Table on South Korea - Market size and forecast 2024-2029 ($ million)
- Exhibits131: Chart on South Korea - Year-over-year growth 2024-2029 (%)
- Exhibits132: Data Table on South Korea - Year-over-year growth 2024-2029 (%)
- Exhibits133: Chart on Saudi Arabia - Market size and forecast 2024-2029 ($ million)
- Exhibits134: Data Table on Saudi Arabia - Market size and forecast 2024-2029 ($ million)
- Exhibits135: Chart on Saudi Arabia - Year-over-year growth 2024-2029 (%)
- Exhibits136: Data Table on Saudi Arabia - Year-over-year growth 2024-2029 (%)
- Exhibits137: Market opportunity By Geographical Landscape ($ million)
- Exhibits138: Data Tables on Market opportunity By Geographical Landscape ($ million)
- Exhibits139: Impact of drivers and challenges in 2024 and 2029
- Exhibits140: Overview on criticality of inputs and factors of differentiation
- Exhibits141: Overview on factors of disruption
- Exhibits142: Impact of key risks on business
- Exhibits143: Companies covered
- Exhibits144: Company ranking index
- Exhibits145: Matrix on companies position and classification
- Exhibits146: ABB Ltd. - Overview
- Exhibits147: ABB Ltd. - Business segments
- Exhibits148: ABB Ltd. - Key news
- Exhibits149: ABB Ltd. - Key offerings
- Exhibits150: ABB Ltd. - Segment focus
- Exhibits151: SWOT
- Exhibits152: Advent Technologies Holdings Inc. - Overview
- Exhibits153: Advent Technologies Holdings Inc. - Product / Service
- Exhibits154: Advent Technologies Holdings Inc. - Key offerings
- Exhibits155: SWOT
- Exhibits156: Ballard Power Systems Inc. - Overview
- Exhibits157: Ballard Power Systems Inc. - Product / Service
- Exhibits158: Ballard Power Systems Inc. - Key offerings
- Exhibits159: SWOT
- Exhibits160: Bloom Energy Corp. - Overview
- Exhibits161: Bloom Energy Corp. - Product / Service
- Exhibits162: Bloom Energy Corp. - Key offerings
- Exhibits163: SWOT
- Exhibits164: General Electric Co. - Overview
- Exhibits165: General Electric Co. - Business segments
- Exhibits166: General Electric Co. - Key news
- Exhibits167: General Electric Co. - Key offerings
- Exhibits168: General Electric Co. - Segment focus
- Exhibits169: SWOT
- Exhibits170: Hyster Yale Materials Handling Inc. - Overview
- Exhibits171: Hyster Yale Materials Handling Inc. - Business segments
- Exhibits172: Hyster Yale Materials Handling Inc. - Key news
- Exhibits173: Hyster Yale Materials Handling Inc. - Key offerings
- Exhibits174: Hyster Yale Materials Handling Inc. - Segment focus
- Exhibits175: SWOT
- Exhibits176: MEYER WERFT GmbH and Co. KG - Overview
- Exhibits177: MEYER WERFT GmbH and Co. KG - Product / Service
- Exhibits178: MEYER WERFT GmbH and Co. KG - Key offerings
- Exhibits179: SWOT
- Exhibits180: Nedstack Fuel Cell Technology BV - Overview
- Exhibits181: Nedstack Fuel Cell Technology BV - Product / Service
- Exhibits182: Nedstack Fuel Cell Technology BV - Key offerings
- Exhibits183: SWOT
- Exhibits184: Plug Power Inc. - Overview
- Exhibits185: Plug Power Inc. - Product / Service
- Exhibits186: Plug Power Inc. - Key offerings
- Exhibits187: SWOT
- Exhibits188: Proton Motor Power Systems PLC - Overview
- Exhibits189: Proton Motor Power Systems PLC - Product / Service
- Exhibits190: Proton Motor Power Systems PLC - Key offerings
- Exhibits191: SWOT
- Exhibits192: SFC Energy AG - Overview
- Exhibits193: SFC Energy AG - Business segments
- Exhibits194: SFC Energy AG - Key news
- Exhibits195: SFC Energy AG - Key offerings
- Exhibits196: SFC Energy AG - Segment focus
- Exhibits197: SWOT
- Exhibits198: Siemens AG - Overview
- Exhibits199: Siemens AG - Business segments
- Exhibits200: Siemens AG - Key news
- Exhibits201: Siemens AG - Key offerings
- Exhibits202: Siemens AG - Segment focus
- Exhibits203: SWOT
- Exhibits204: TECO 2030 ASA - Overview
- Exhibits205: TECO 2030 ASA - Product / Service
- Exhibits206: TECO 2030 ASA - Key offerings
- Exhibits207: SWOT
- Exhibits208: Toshiba Corp. - Overview
- Exhibits209: Toshiba Corp. - Business segments
- Exhibits210: Toshiba Corp. - Key news
- Exhibits211: Toshiba Corp. - Key offerings
- Exhibits212: Toshiba Corp. - Segment focus
- Exhibits213: SWOT
- Exhibits214: Watt Fuel Cell Corp. - Overview
- Exhibits215: Watt Fuel Cell Corp. - Product / Service
- Exhibits216: Watt Fuel Cell Corp. - Key offerings
- Exhibits217: SWOT
- Exhibits218: Inclusions checklist
- Exhibits219: Exclusions checklist
- Exhibits220: Currency conversion rates for US$
- Exhibits221: Research methodology
- Exhibits222: Information sources
- Exhibits223: Data validation
- Exhibits224: Validation techniques employed for market sizing
- Exhibits225: Data synthesis
- Exhibits226: 360 degree market analysis
- Exhibits227: List of abbreviations
Fuel Cells For Marine Vessels Market 2025-2029
The fuel cells for marine vessels market is forecasted to grow by USD 234.6 mn during 2024-2029, accelerating at a CAGR of 7.8% during the forecast period. The report on the fuel cells for marine vessels market provides a holistic analysis, market size and forecast, trends, growth drivers, and challenges, as well as vendor analysis covering around 25 vendors.
The report offers an up-to-date analysis regarding the current market scenario, the latest trends and drivers, and the overall market environment. The market is driven by demand for alternate propulsion systems, rapid developments in marine propulsion industry, and regulatory policies on emission control.
| Market Scope | |
|---|---|
| Base Year | 2025 |
| End Year | 2029 |
| Series Year | 2025-2029 |
| Growth Momentum | Accelerate |
| YOY 2025 | 6.8% |
| CAGR | 7.8% |
| Incremental Value | $234.6 mn |
Technavio's fuel cells for marine vessels market is segmented as below:
By Application
- Commercial
- Military
- Others
By Technology
- PEMFC
- SOFC
- Other fuel cells
By Geographical Landscape
- North America
- APAC
- Europe
- Middle East and Africa
- South America
This study identifies the increasing research and development activities in fuel cell technology as one of the prime reasons driving the fuel cells for marine vessels market growth during the next few years. Also, adoption of aip technology and emergence of hybrid propulsion systems will lead to sizable demand in the market.
The report on the fuel cells for marine vessels market covers the following areas:
- Fuel Cells For Marine Vessels Market sizing
- Fuel Cells For Marine Vessels Market forecast
- Fuel Cells For Marine Vessels Market industry analysis
The robust vendor analysis is designed to help clients improve their market position, and in line with this, this report provides a detailed analysis of several leading fuel cells for marine vessels market vendors that include ABB Ltd., Advent Technologies Holdings Inc., Ballard Power Systems Inc., Bloom Energy Corp., Cummins Inc., Echandia Marine AB, General Electric Co., Hyster Yale Materials Handling Inc., Intelligent Energy Ltd., MEYER WERFT GmbH and Co. KG, Nedstack Fuel Cell Technology BV, Nuvera Fuel Cells LLC, Plug Power Inc., Proton Motor Power Systems PLC, SFC Energy AG, Siemens AG, Sunfire GmbH, TECO 2030 ASA, Toshiba Corp., and Watt Fuel Cell Corp.. Also, the fuel cells for marine vessels market analysis report includes information on upcoming trends and challenges that will influence market growth. This is to help companies strategize and leverage all forthcoming growth opportunities.
The study was conducted using an objective combination of primary and secondary information including inputs from key participants in the industry. The report contains a comprehensive market and vendor landscape in addition to an analysis of the key vendors.
The publisher presents a detailed picture of the market by the way of study, synthesis, and summation of data from multiple sources by an analysis of key parameters such as profit, pricing, competition, and promotions. It presents various market facets by identifying the key industry influencers. The data presented is comprehensive, reliable, and a result of extensive primary and secondary research. The market research reports provide a complete competitive landscape and an in-depth vendor selection methodology and analysis using qualitative and quantitative research to forecast accurate market growth.
Table of Contents
1 Executive Summary
- 1.1 Market overview
- Executive Summary - Chart on Market Overview
- Executive Summary - Data Table on Market Overview
- Executive Summary - Chart on Global Market Characteristics
- Executive Summary - Chart on Market By Geographical Landscape
- Executive Summary - Chart on Market Segmentation by Application
- Executive Summary - Chart on Market Segmentation by Technology
- Executive Summary - Chart on Incremental Growth
- Executive Summary - Data Table on Incremental Growth
- Executive Summary - Chart on Company Market Positioning
2 Technavio Analysis
- 2.1 Analysis of price sensitivity, lifecycle, customer purchase basket, adoption rates, and purchase criteria
- Analysis of price sensitivity, lifecycle, customer purchase basket, adoption rates, and purchase criteria
- 2.2 Criticality of inputs and Factors of differentiation
- Overview on criticality of inputs and factors of differentiation
- 2.3 Factors of disruption
- Overview on factors of disruption
- 2.4 Impact of drivers and challenges
- Impact of drivers and challenges in 2024 and 2029
3 Market Landscape
- 3.1 Market ecosystem
- Parent Market
- Data Table on - Parent Market
- 3.2 Market characteristics
- Market characteristics analysis
- 3.3 Value chain analysis
- Value chain analysis
4 Market Sizing
- 4.1 Market definition
- Offerings of companies included in the market definition
- 4.2 Market segment analysis
- Market segments
- 4.3 Market size 2024
- 4.4 Market outlook: Forecast for 2024-2029
- Chart on Global - Market size and forecast 2024-2029 ($ million)
- Data Table on Global - Market size and forecast 2024-2029 ($ million)
- Chart on Global Market: Year-over-year growth 2024-2029 (%)
- Data Table on Global Market: Year-over-year growth 2024-2029 (%)
5 Historic Market Size
- 5.1 Global Fuel Cells For Marine Vessels Market 2019 - 2023
- Historic Market Size - Data Table on Global Fuel Cells For Marine Vessels Market 2019 - 2023 ($ million)
- 5.2 Application segment analysis 2019 - 2023
- Historic Market Size - Application Segment 2019 - 2023 ($ million)
- 5.3 Technology segment analysis 2019 - 2023
- Historic Market Size - Technology Segment 2019 - 2023 ($ million)
- 5.4 Geography segment analysis 2019 - 2023
- Historic Market Size - Geography Segment 2019 - 2023 ($ million)
- 5.5 Country segment analysis 2019 - 2023
- Historic Market Size - Country Segment 2019 - 2023 ($ million)
6 Qualitative Analysis
- 6.1 The AI Impact Global Fuel Cells for Marine Vessels Market
7 Five Forces Analysis
- 7.1 Five forces summary
- Five forces analysis - Comparison between 2024 and 2029
- 7.2 Bargaining power of buyers
- Bargaining power of buyers - Impact of key factors 2024 and 2029
- 7.3 Bargaining power of suppliers
- Bargaining power of suppliers - Impact of key factors in 2024 and 2029
- 7.4 Threat of new entrants
- Threat of new entrants - Impact of key factors in 2024 and 2029
- 7.5 Threat of substitutes
- Threat of substitutes - Impact of key factors in 2024 and 2029
- 7.6 Threat of rivalry
- Threat of rivalry - Impact of key factors in 2024 and 2029
- 7.7 Market condition
- Chart on Market condition - Five forces 2024 and 2029
8 Market Segmentation by Application
- 8.1 Market segments
- Chart on Application - Market share 2024-2029 (%)
- Data Table on Application - Market share 2024-2029 (%)
- 8.2 Comparison by Application
- Chart on Comparison by Application
- Data Table on Comparison by Application
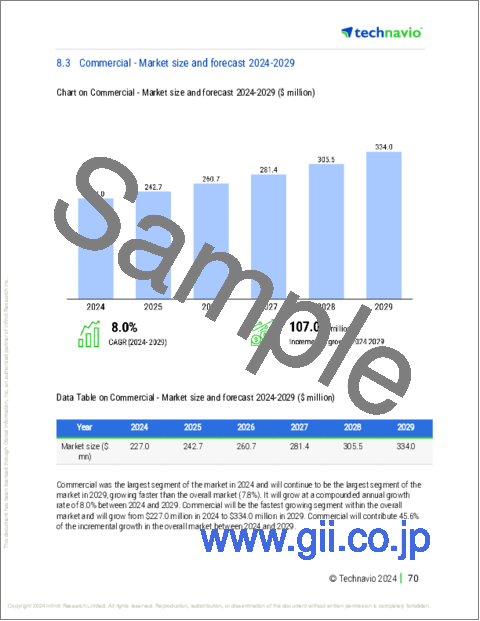
- 8.3 Commercial - Market size and forecast 2024-2029
- Chart on Commercial - Market size and forecast 2024-2029 ($ million)
- Data Table on Commercial - Market size and forecast 2024-2029 ($ million)
- Chart on Commercial - Year-over-year growth 2024-2029 (%)
- Data Table on Commercial - Year-over-year growth 2024-2029 (%)
- 8.4 Military - Market size and forecast 2024-2029
- Chart on Military - Market size and forecast 2024-2029 ($ million)
- Data Table on Military - Market size and forecast 2024-2029 ($ million)
- Chart on Military - Year-over-year growth 2024-2029 (%)
- Data Table on Military - Year-over-year growth 2024-2029 (%)
- 8.5 Others - Market size and forecast 2024-2029
- Chart on Others - Market size and forecast 2024-2029 ($ million)
- Data Table on Others - Market size and forecast 2024-2029 ($ million)
- Chart on Others - Year-over-year growth 2024-2029 (%)
- Data Table on Others - Year-over-year growth 2024-2029 (%)
- 8.6 Market opportunity by Application
- Market opportunity by Application ($ million)
- Data Table on Market opportunity by Application ($ million)
9 Market Segmentation by Technology
- 9.1 Market segments
- Chart on Technology - Market share 2024-2029 (%)
- Data Table on Technology - Market share 2024-2029 (%)
- 9.2 Comparison by Technology
- Chart on Comparison by Technology
- Data Table on Comparison by Technology
- 9.3 PEMFC - Market size and forecast 2024-2029
- Chart on PEMFC - Market size and forecast 2024-2029 ($ million)
- Data Table on PEMFC - Market size and forecast 2024-2029 ($ million)
- Chart on PEMFC - Year-over-year growth 2024-2029 (%)
- Data Table on PEMFC - Year-over-year growth 2024-2029 (%)
- 9.4 SOFC - Market size and forecast 2024-2029
- Chart on SOFC - Market size and forecast 2024-2029 ($ million)
- Data Table on SOFC - Market size and forecast 2024-2029 ($ million)
- Chart on SOFC - Year-over-year growth 2024-2029 (%)
- Data Table on SOFC - Year-over-year growth 2024-2029 (%)
- 9.5 Other fuel cells - Market size and forecast 2024-2029
- Chart on Other fuel cells - Market size and forecast 2024-2029 ($ million)
- Data Table on Other fuel cells - Market size and forecast 2024-2029 ($ million)
- Chart on Other fuel cells - Year-over-year growth 2024-2029 (%)
- Data Table on Other fuel cells - Year-over-year growth 2024-2029 (%)
- 9.6 Market opportunity by Technology
- Market opportunity by Technology ($ million)
- Data Table on Market opportunity by Technology ($ million)
10 Customer Landscape
- 10.1 Customer landscape overview
- Analysis of price sensitivity, lifecycle, customer purchase basket, adoption rates, and purchase criteria
11 Geographic Landscape
- 11.1 Geographic segmentation
- Chart on Market share By Geographical Landscape 2024-2029 (%)
- Data Table on Market share By Geographical Landscape 2024-2029 (%)
- 11.2 Geographic comparison
- Chart on Geographic comparison
- Data Table on Geographic comparison
- 11.3 North America - Market size and forecast 2024-2029
- Chart on North America - Market size and forecast 2024-2029 ($ million)
- Data Table on North America - Market size and forecast 2024-2029 ($ million)
- Chart on North America - Year-over-year growth 2024-2029 (%)
- Data Table on North America - Year-over-year growth 2024-2029 (%)
- 11.4 APAC - Market size and forecast 2024-2029
- Chart on APAC - Market size and forecast 2024-2029 ($ million)
- Data Table on APAC - Market size and forecast 2024-2029 ($ million)
- Chart on APAC - Year-over-year growth 2024-2029 (%)
- Data Table on APAC - Year-over-year growth 2024-2029 (%)
- 11.5 Europe - Market size and forecast 2024-2029
- Chart on Europe - Market size and forecast 2024-2029 ($ million)
- Data Table on Europe - Market size and forecast 2024-2029 ($ million)
- Chart on Europe - Year-over-year growth 2024-2029 (%)
- Data Table on Europe - Year-over-year growth 2024-2029 (%)
- 11.6 Middle East and Africa - Market size and forecast 2024-2029
- Chart on Middle East and Africa - Market size and forecast 2024-2029 ($ million)
- Data Table on Middle East and Africa - Market size and forecast 2024-2029 ($ million)
- Chart on Middle East and Africa - Year-over-year growth 2024-2029 (%)
- Data Table on Middle East and Africa - Year-over-year growth 2024-2029 (%)
- 11.7 South America - Market size and forecast 2024-2029
- Chart on South America - Market size and forecast 2024-2029 ($ million)
- Data Table on South America - Market size and forecast 2024-2029 ($ million)
- Chart on South America - Year-over-year growth 2024-2029 (%)
- Data Table on South America - Year-over-year growth 2024-2029 (%)
- 11.8 US - Market size and forecast 2024-2029
- Chart on US - Market size and forecast 2024-2029 ($ million)
- Data Table on US - Market size and forecast 2024-2029 ($ million)
- Chart on US - Year-over-year growth 2024-2029 (%)
- Data Table on US - Year-over-year growth 2024-2029 (%)
- 11.9 China - Market size and forecast 2024-2029
- Chart on China - Market size and forecast 2024-2029 ($ million)
- Data Table on China - Market size and forecast 2024-2029 ($ million)
- Chart on China - Year-over-year growth 2024-2029 (%)
- Data Table on China - Year-over-year growth 2024-2029 (%)
- 11.10 Canada - Market size and forecast 2024-2029
- Chart on Canada - Market size and forecast 2024-2029 ($ million)
- Data Table on Canada - Market size and forecast 2024-2029 ($ million)
- Chart on Canada - Year-over-year growth 2024-2029 (%)
- Data Table on Canada - Year-over-year growth 2024-2029 (%)
- 11.11 Germany - Market size and forecast 2024-2029
- Chart on Germany - Market size and forecast 2024-2029 ($ million)
- Data Table on Germany - Market size and forecast 2024-2029 ($ million)
- Chart on Germany - Year-over-year growth 2024-2029 (%)
- Data Table on Germany - Year-over-year growth 2024-2029 (%)
- 11.12 Japan - Market size and forecast 2024-2029
- Chart on Japan - Market size and forecast 2024-2029 ($ million)
- Data Table on Japan - Market size and forecast 2024-2029 ($ million)
- Chart on Japan - Year-over-year growth 2024-2029 (%)
- Data Table on Japan - Year-over-year growth 2024-2029 (%)
- 11.13 UK - Market size and forecast 2024-2029
- Chart on UK - Market size and forecast 2024-2029 ($ million)
- Data Table on UK - Market size and forecast 2024-2029 ($ million)
- Chart on UK - Year-over-year growth 2024-2029 (%)
- Data Table on UK - Year-over-year growth 2024-2029 (%)
- 11.14 India - Market size and forecast 2024-2029
- Chart on India - Market size and forecast 2024-2029 ($ million)
- Data Table on India - Market size and forecast 2024-2029 ($ million)
- Chart on India - Year-over-year growth 2024-2029 (%)
- Data Table on India - Year-over-year growth 2024-2029 (%)
- 11.15 France - Market size and forecast 2024-2029
- Chart on France - Market size and forecast 2024-2029 ($ million)
- Data Table on France - Market size and forecast 2024-2029 ($ million)
- Chart on France - Year-over-year growth 2024-2029 (%)
- Data Table on France - Year-over-year growth 2024-2029 (%)
- 11.16 South Korea - Market size and forecast 2024-2029
- Chart on South Korea - Market size and forecast 2024-2029 ($ million)
- Data Table on South Korea - Market size and forecast 2024-2029 ($ million)
- Chart on South Korea - Year-over-year growth 2024-2029 (%)
- Data Table on South Korea - Year-over-year growth 2024-2029 (%)
- 11.17 Saudi Arabia - Market size and forecast 2024-2029
- Chart on Saudi Arabia - Market size and forecast 2024-2029 ($ million)
- Data Table on Saudi Arabia - Market size and forecast 2024-2029 ($ million)
- Chart on Saudi Arabia - Year-over-year growth 2024-2029 (%)
- Data Table on Saudi Arabia - Year-over-year growth 2024-2029 (%)
- 11.18 Market opportunity By Geographical Landscape
- Market opportunity By Geographical Landscape ($ million)
- Data Tables on Market opportunity By Geographical Landscape ($ million)
12 Drivers, Challenges, and Opportunity/Restraints
- 12.1 Market drivers
- 12.2 Market challenges
- 12.3 Impact of drivers and challenges
- Impact of drivers and challenges in 2024 and 2029
- 12.4 Market opportunities/restraints
13 Competitive Landscape
- 13.1 Overview
- 13.2 Competitive Landscape
- Overview on criticality of inputs and factors of differentiation
- 13.3 Landscape disruption
- Overview on factors of disruption
- 13.4 Industry risks
- Impact of key risks on business
14 Competitive Analysis
- 14.1 Companies profiled
- Companies covered
- 14.2 Company ranking index
- Company ranking index
- 14.3 Market positioning of companies
- Matrix on companies position and classification
- 14.4 ABB Ltd.
- ABB Ltd. - Overview
- ABB Ltd. - Business segments
- ABB Ltd. - Key news
- ABB Ltd. - Key offerings
- ABB Ltd. - Segment focus
- SWOT
- 14.5 Advent Technologies Holdings Inc.
- Advent Technologies Holdings Inc. - Overview
- Advent Technologies Holdings Inc. - Product / Service
- Advent Technologies Holdings Inc. - Key offerings
- SWOT
- 14.6 Ballard Power Systems Inc.
- Ballard Power Systems Inc. - Overview
- Ballard Power Systems Inc. - Product / Service
- Ballard Power Systems Inc. - Key offerings
- SWOT
- 14.7 Bloom Energy Corp.
- Bloom Energy Corp. - Overview
- Bloom Energy Corp. - Product / Service
- Bloom Energy Corp. - Key offerings
- SWOT
- 14.8 General Electric Co.
- General Electric Co. - Overview
- General Electric Co. - Business segments
- General Electric Co. - Key news
- General Electric Co. - Key offerings
- General Electric Co. - Segment focus
- SWOT
- 14.9 Hyster Yale Materials Handling Inc.
- Hyster Yale Materials Handling Inc. - Overview
- Hyster Yale Materials Handling Inc. - Business segments
- Hyster Yale Materials Handling Inc. - Key news
- Hyster Yale Materials Handling Inc. - Key offerings
- Hyster Yale Materials Handling Inc. - Segment focus
- SWOT
- 14.10 MEYER WERFT GmbH and Co. KG
- MEYER WERFT GmbH and Co. KG - Overview
- MEYER WERFT GmbH and Co. KG - Product / Service
- MEYER WERFT GmbH and Co. KG - Key offerings
- SWOT
- 14.11 Nedstack Fuel Cell Technology BV
- Nedstack Fuel Cell Technology BV - Overview
- Nedstack Fuel Cell Technology BV - Product / Service
- Nedstack Fuel Cell Technology BV - Key offerings
- SWOT
- 14.12 Plug Power Inc.
- Plug Power Inc. - Overview
- Plug Power Inc. - Product / Service
- Plug Power Inc. - Key offerings
- SWOT
- 14.13 Proton Motor Power Systems PLC
- Proton Motor Power Systems PLC - Overview
- Proton Motor Power Systems PLC - Product / Service
- Proton Motor Power Systems PLC - Key offerings
- SWOT
- 14.14 SFC Energy AG
- SFC Energy AG - Overview
- SFC Energy AG - Business segments
- SFC Energy AG - Key news
- SFC Energy AG - Key offerings
- SFC Energy AG - Segment focus
- SWOT
- 14.15 Siemens AG
- Siemens AG - Overview
- Siemens AG - Business segments
- Siemens AG - Key news
- Siemens AG - Key offerings
- Siemens AG - Segment focus
- SWOT
- 14.16 TECO 2030 ASA
- TECO 2030 ASA - Overview
- TECO 2030 ASA - Product / Service
- TECO 2030 ASA - Key offerings
- SWOT
- 14.17 Toshiba Corp.
- Toshiba Corp. - Overview
- Toshiba Corp. - Business segments
- Toshiba Corp. - Key news
- Toshiba Corp. - Key offerings
- Toshiba Corp. - Segment focus
- SWOT
- 14.18 Watt Fuel Cell Corp.
- Watt Fuel Cell Corp. - Overview
- Watt Fuel Cell Corp. - Product / Service
- Watt Fuel Cell Corp. - Key offerings
- SWOT
15 Appendix
- 15.1 Scope of the report
- 15.2 Inclusions and exclusions checklist
- Inclusions checklist
- Exclusions checklist
- 15.3 Currency conversion rates for US$
- Currency conversion rates for US$
- 15.4 Research methodology
- Research methodology
- 15.5 Data procurement
- Information sources
- 15.6 Data validation
- Data validation
- 15.7 Validation techniques employed for market sizing
- Validation techniques employed for market sizing
- 15.8 Data synthesis
- Data synthesis
- 15.9 360 degree market analysis
- 360 degree market analysis
- 15.10 List of abbreviations
- List of abbreviations

