|
|
市場調査レポート
商品コード
1515736
無水フタル酸の世界市場 2024-2028Global phthalic anhydride market 2024-2028 |
||||||
|
|||||||
カスタマイズ可能
|
|||||||

| 無水フタル酸の世界市場 2024-2028 |
|
出版日: 2024年06月11日
発行: TechNavio
ページ情報: 英文 181 Pages
納期: 即納可能
|

全表示
- 概要
- 図表
- 目次
無水フタル酸市場は2023-2028年に9億850万米ドル、予測期間中のCAGRは3.59%で成長すると予測されます。
当レポートでは、無水フタル酸市場の全体的な分析、市場規模・予測、動向、成長促進要因、課題、約25のベンダーを網羅したベンダー分析などを掲載しています。
現在の市場シナリオ、最新動向と促進要因、市場環境全体に関する最新分析を提供しています。市場は、建設産業の成長、UPR(不飽和ポリエステル樹脂)の多機能特性、自動車分野でのフタル酸エステル需要の高まりによって牽引されています。
| 市場範囲 | |
|---|---|
| 基準年 | 2024 |
| 終了年 | 2028 |
| 予測期間 | 2024-2028 |
| 成長モメンタム | 加速 |
| 前年比2024年 | 3.42% |
| CAGR | 3.59% |
| 増分額 | 9億850万米ドル |
本調査では、今後数年間の無水フタル酸市場成長を牽引する主な要因の一つとして、グリーンで持続可能な樹脂への需要の高まりを挙げています。また、エンドユーザー産業の拡大、無水フタル酸開発のための技術進歩やプロセス革新は、市場の大きな需要につながります。
目次
第1章 エグゼクティブサマリー
- 市場概要
第2章 市場情勢
- 市場エコシステム
- 市場の特徴
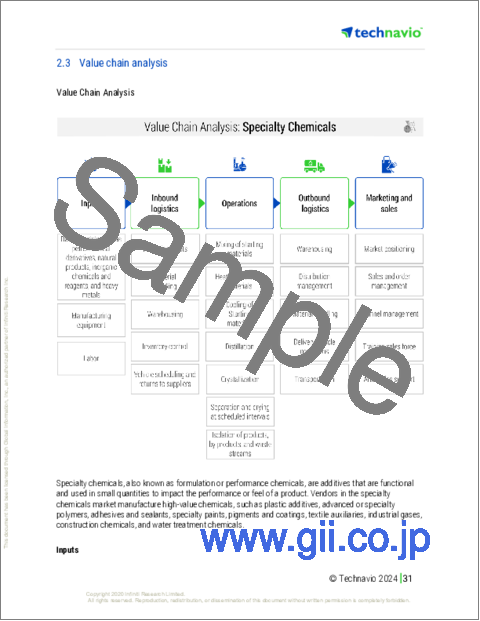
- バリューチェーン分析
第3章 市場規模の評価
- 市場の定義
- 市場セグメント分析
- 市場規模 2023
- 市場の見通し 2023-2028
第4章 市場規模実績
- 世界無水フタル酸市場 2018-2022
- 用途別セグメント分析 2018-2022
- タイプ別セグメント分析 2018-2022
- 地域別セグメント分析 2018-2022
- 国別セグメント分析 2018-2022
第5章 ファイブフォース分析
- ファイブフォースの要約
- 買い手の交渉力
- 供給企業の交渉力
- 新規参入業者の脅威
- 代替品の脅威
- 競争の脅威
- 市況
第6章 市場セグメンテーション:用途別
- 市場セグメンテーション
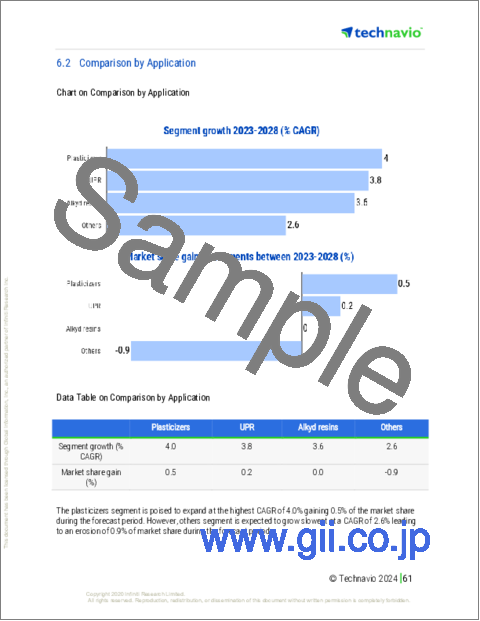
- 比較:用途別
- 可塑剤:市場規模と予測 2023-2028
- 不飽和ポリエステル樹脂:市場規模と予測 2023-2028
- アルキド樹脂:市場規模と予測 2023-2028
- その他:市場規模と予測 2023-2028
- 市場機会:用途別
第7章 市場セグメンテーション:タイプ別
- 市場セグメンテーション
- 比較:タイプ別
- o-キシレン触媒酸化:市場規模と予測 2023-2028
- ナフタレン触媒酸化:市場規模と予測 2023-2028
- 市場機会:タイプ別
第8章 顧客情勢
- 顧客情勢の概要
第9章 地域別情勢
- 地域別セグメンテーション
- 地域別比較
- アジア太平洋:市場規模と予測 2023-2028
- 北米:市場規模と予測 2023-2028
- 欧州:市場規模と予測 2023-2028
- 南米:市場規模と予測 2023-2028
- 中東・アフリカ:市場規模と予測 2023-2028
- 中国:市場規模と予測 2023-2028
- 米国:市場規模と予測 2023-2028
- ドイツ:市場規模と予測 2023-2028
- カナダ:市場規模と予測 2023-2028
- インド:市場規模と予測 2023-2028
- 市場機会:地域情勢別
第10章 促進要因・課題・機会・抑制要因
- 市場促進要因
- 市場の課題
- 促進要因と課題の影響
- 市場の機会・抑制要因
第11章 競合情勢
- 概要
- 競合情勢
- 混乱の状況
- 業界のリスク
第12章 競合分析
- 企業プロファイル
- 企業の市場ポジショニング
- AGROFERT AS
- Asian Paints Ltd.
- BASF SE
- Compania Espanola de Petroleos SA
- Exxon Mobil Corp.
- IG Petrochemicals Ltd.
- Koppers Holdings Inc.
- Lanxess AG
- Mitsubishi Corp.
- Polynt Spa
- Specialty Polymers Inc.
- Stepan Co.
- Thirumalai Chemicals Ltd.
- Tokyo Chemical Industry Co. Ltd.
- UPC Technology Corp.
第13章 付録
Exhibits:
- Exhibits1: Executive Summary - Chart on Market Overview
- Exhibits2: Executive Summary - Data Table on Market Overview
- Exhibits3: Executive Summary - Chart on Global Market Characteristics
- Exhibits4: Executive Summary - Chart on Market By Geographical Landscape
- Exhibits5: Executive Summary - Chart on Market Segmentation by Application
- Exhibits6: Executive Summary - Chart on Market Segmentation by Type
- Exhibits7: Executive Summary - Chart on Incremental Growth
- Exhibits8: Executive Summary - Data Table on Incremental Growth
- Exhibits9: Executive Summary - Chart on Company Market Positioning
- Exhibits10: Parent Market
- Exhibits11: Data Table on - Parent Market
- Exhibits12: Market characteristics analysis
- Exhibits13: Value Chain Analysis
- Exhibits14: Offerings of companies included in the market definition
- Exhibits15: Market segments
- Exhibits16: Chart on Global - Market size and forecast 2023-2028 ($ million)
- Exhibits17: Data Table on Global - Market size and forecast 2023-2028 ($ million)
- Exhibits18: Chart on Global Market: Year-over-year growth 2023-2028 (%)
- Exhibits19: Data Table on Global Market: Year-over-year growth 2023-2028 (%)
- Exhibits20: Historic Market Size - Data Table on Global Phthalic Anhydride Market 2018 - 2022 ($ million)
- Exhibits21: Historic Market Size - Application Segment 2018 - 2022 ($ million)
- Exhibits22: Historic Market Size - Type Segment 2018 - 2022 ($ million)
- Exhibits23: Historic Market Size - Geography Segment 2018 - 2022 ($ million)
- Exhibits24: Historic Market Size - Country Segment 2018 - 2022 ($ million)
- Exhibits25: Five forces analysis - Comparison between 2023 and 2028
- Exhibits26: Bargaining power of buyers - Impact of key factors 2023 and 2028
- Exhibits27: Bargaining power of suppliers - Impact of key factors in 2023 and 2028
- Exhibits28: Threat of new entrants - Impact of key factors in 2023 and 2028
- Exhibits29: Threat of substitutes - Impact of key factors in 2023 and 2028
- Exhibits30: Threat of rivalry - Impact of key factors in 2023 and 2028
- Exhibits31: Chart on Market condition - Five forces 2023 and 2028
- Exhibits32: Chart on Application - Market share 2023-2028 (%)
- Exhibits33: Data Table on Application - Market share 2023-2028 (%)
- Exhibits34: Chart on Comparison by Application
- Exhibits35: Data Table on Comparison by Application
- Exhibits36: Chart on Plasticizers - Market size and forecast 2023-2028 ($ million)
- Exhibits37: Data Table on Plasticizers - Market size and forecast 2023-2028 ($ million)
- Exhibits38: Chart on Plasticizers - Year-over-year growth 2023-2028 (%)
- Exhibits39: Data Table on Plasticizers - Year-over-year growth 2023-2028 (%)
- Exhibits40: Chart on UPR - Market size and forecast 2023-2028 ($ million)
- Exhibits41: Data Table on UPR - Market size and forecast 2023-2028 ($ million)
- Exhibits42: Chart on UPR - Year-over-year growth 2023-2028 (%)
- Exhibits43: Data Table on UPR - Year-over-year growth 2023-2028 (%)
- Exhibits44: Chart on Alkyd resins - Market size and forecast 2023-2028 ($ million)
- Exhibits45: Data Table on Alkyd resins - Market size and forecast 2023-2028 ($ million)
- Exhibits46: Chart on Alkyd resins - Year-over-year growth 2023-2028 (%)
- Exhibits47: Data Table on Alkyd resins - Year-over-year growth 2023-2028 (%)
- Exhibits48: Chart on Others - Market size and forecast 2023-2028 ($ million)
- Exhibits49: Data Table on Others - Market size and forecast 2023-2028 ($ million)
- Exhibits50: Chart on Others - Year-over-year growth 2023-2028 (%)
- Exhibits51: Data Table on Others - Year-over-year growth 2023-2028 (%)
- Exhibits52: Market opportunity by Application ($ million)
- Exhibits53: Data Table on Market opportunity by Application ($ million)
- Exhibits54: Chart on Type - Market share 2023-2028 (%)
- Exhibits55: Data Table on Type - Market share 2023-2028 (%)
- Exhibits56: Chart on Comparison by Type
- Exhibits57: Data Table on Comparison by Type
- Exhibits58: Chart on O-xylene catalytic oxidation - Market size and forecast 2023-2028 ($ million)
- Exhibits59: Data Table on O-xylene catalytic oxidation - Market size and forecast 2023-2028 ($ million)
- Exhibits60: Chart on O-xylene catalytic oxidation - Year-over-year growth 2023-2028 (%)
- Exhibits61: Data Table on O-xylene catalytic oxidation - Year-over-year growth 2023-2028 (%)
- Exhibits62: Chart on Naphthalene catalytic oxidation - Market size and forecast 2023-2028 ($ million)
- Exhibits63: Data Table on Naphthalene catalytic oxidation - Market size and forecast 2023-2028 ($ million)
- Exhibits64: Chart on Naphthalene catalytic oxidation - Year-over-year growth 2023-2028 (%)
- Exhibits65: Data Table on Naphthalene catalytic oxidation - Year-over-year growth 2023-2028 (%)
- Exhibits66: Market opportunity by Type ($ million)
- Exhibits67: Data Table on Market opportunity by Type ($ million)
- Exhibits68: Analysis of price sensitivity, lifecycle, customer purchase basket, adoption rates, and purchase criteria
- Exhibits69: Chart on Market share By Geographical Landscape 2023-2028 (%)
- Exhibits70: Data Table on Market share By Geographical Landscape 2023-2028 (%)
- Exhibits71: Chart on Geographic comparison
- Exhibits72: Data Table on Geographic comparison
- Exhibits73: Chart on APAC - Market size and forecast 2023-2028 ($ million)
- Exhibits74: Data Table on APAC - Market size and forecast 2023-2028 ($ million)
- Exhibits75: Chart on APAC - Year-over-year growth 2023-2028 (%)
- Exhibits76: Data Table on APAC - Year-over-year growth 2023-2028 (%)
- Exhibits77: Chart on North America - Market size and forecast 2023-2028 ($ million)
- Exhibits78: Data Table on North America - Market size and forecast 2023-2028 ($ million)
- Exhibits79: Chart on North America - Year-over-year growth 2023-2028 (%)
- Exhibits80: Data Table on North America - Year-over-year growth 2023-2028 (%)
- Exhibits81: Chart on Europe - Market size and forecast 2023-2028 ($ million)
- Exhibits82: Data Table on Europe - Market size and forecast 2023-2028 ($ million)
- Exhibits83: Chart on Europe - Year-over-year growth 2023-2028 (%)
- Exhibits84: Data Table on Europe - Year-over-year growth 2023-2028 (%)
- Exhibits85: Chart on South America - Market size and forecast 2023-2028 ($ million)
- Exhibits86: Data Table on South America - Market size and forecast 2023-2028 ($ million)
- Exhibits87: Chart on South America - Year-over-year growth 2023-2028 (%)
- Exhibits88: Data Table on South America - Year-over-year growth 2023-2028 (%)
- Exhibits89: Chart on Middle East and Africa - Market size and forecast 2023-2028 ($ million)
- Exhibits90: Data Table on Middle East and Africa - Market size and forecast 2023-2028 ($ million)
- Exhibits91: Chart on Middle East and Africa - Year-over-year growth 2023-2028 (%)
- Exhibits92: Data Table on Middle East and Africa - Year-over-year growth 2023-2028 (%)
- Exhibits93: Chart on China - Market size and forecast 2023-2028 ($ million)
- Exhibits94: Data Table on China - Market size and forecast 2023-2028 ($ million)
- Exhibits95: Chart on China - Year-over-year growth 2023-2028 (%)
- Exhibits96: Data Table on China - Year-over-year growth 2023-2028 (%)
- Exhibits97: Chart on US - Market size and forecast 2023-2028 ($ million)
- Exhibits98: Data Table on US - Market size and forecast 2023-2028 ($ million)
- Exhibits99: Chart on US - Year-over-year growth 2023-2028 (%)
- Exhibits100: Data Table on US - Year-over-year growth 2023-2028 (%)
- Exhibits101: Chart on Germany - Market size and forecast 2023-2028 ($ million)
- Exhibits102: Data Table on Germany - Market size and forecast 2023-2028 ($ million)
- Exhibits103: Chart on Germany - Year-over-year growth 2023-2028 (%)
- Exhibits104: Data Table on Germany - Year-over-year growth 2023-2028 (%)
- Exhibits105: Chart on Canada - Market size and forecast 2023-2028 ($ million)
- Exhibits106: Data Table on Canada - Market size and forecast 2023-2028 ($ million)
- Exhibits107: Chart on Canada - Year-over-year growth 2023-2028 (%)
- Exhibits108: Data Table on Canada - Year-over-year growth 2023-2028 (%)
- Exhibits109: Chart on India - Market size and forecast 2023-2028 ($ million)
- Exhibits110: Data Table on India - Market size and forecast 2023-2028 ($ million)
- Exhibits111: Chart on India - Year-over-year growth 2023-2028 (%)
- Exhibits112: Data Table on India - Year-over-year growth 2023-2028 (%)
- Exhibits113: Market opportunity By Geographical Landscape ($ million)
- Exhibits114: Data Tables on Market opportunity By Geographical Landscape ($ million)
- Exhibits115: Impact of drivers and challenges in 2023 and 2028
- Exhibits116: Overview on criticality of inputs and factors of differentiation
- Exhibits117: Overview on factors of disruption
- Exhibits118: Impact of key risks on business
- Exhibits119: Companies covered
- Exhibits120: Matrix on companies position and classification
- Exhibits121: AGROFERT AS - Overview
- Exhibits122: AGROFERT AS - Product / Service
- Exhibits123: AGROFERT AS - Key offerings
- Exhibits124: Asian Paints Ltd. - Overview
- Exhibits125: Asian Paints Ltd. - Business segments
- Exhibits126: Asian Paints Ltd. - Key offerings
- Exhibits127: Asian Paints Ltd. - Segment focus
- Exhibits128: BASF SE - Overview
- Exhibits129: BASF SE - Business segments
- Exhibits130: BASF SE - Key news
- Exhibits131: BASF SE - Key offerings
- Exhibits132: BASF SE - Segment focus
- Exhibits133: Compania Espanola de Petroleos SA - Overview
- Exhibits134: Compania Espanola de Petroleos SA - Business segments
- Exhibits135: Compania Espanola de Petroleos SA - Key offerings
- Exhibits136: Compania Espanola de Petroleos SA - Segment focus
- Exhibits137: Exxon Mobil Corp. - Overview
- Exhibits138: Exxon Mobil Corp. - Business segments
- Exhibits139: Exxon Mobil Corp. - Key news
- Exhibits140: Exxon Mobil Corp. - Key offerings
- Exhibits141: Exxon Mobil Corp. - Segment focus
- Exhibits142: IG Petrochemicals Ltd. - Overview
- Exhibits143: IG Petrochemicals Ltd. - Product / Service
- Exhibits144: IG Petrochemicals Ltd. - Key offerings
- Exhibits145: Koppers Holdings Inc. - Overview
- Exhibits146: Koppers Holdings Inc. - Business segments
- Exhibits147: Koppers Holdings Inc. - Key offerings
- Exhibits148: Koppers Holdings Inc. - Segment focus
- Exhibits149: Lanxess AG - Overview
- Exhibits150: Lanxess AG - Business segments
- Exhibits151: Lanxess AG - Key news
- Exhibits152: Lanxess AG - Key offerings
- Exhibits153: Lanxess AG - Segment focus
- Exhibits154: Mitsubishi Corp. - Overview
- Exhibits155: Mitsubishi Corp. - Business segments
- Exhibits156: Mitsubishi Corp. - Key news
- Exhibits157: Mitsubishi Corp. - Key offerings
- Exhibits158: Mitsubishi Corp. - Segment focus
- Exhibits159: Polynt Spa - Overview
- Exhibits160: Polynt Spa - Product / Service
- Exhibits161: Polynt Spa - Key offerings
- Exhibits162: Specialty Polymers Inc. - Overview
- Exhibits163: Specialty Polymers Inc. - Product / Service
- Exhibits164: Specialty Polymers Inc. - Key offerings
- Exhibits165: Stepan Co. - Overview
- Exhibits166: Stepan Co. - Business segments
- Exhibits167: Stepan Co. - Key news
- Exhibits168: Stepan Co. - Key offerings
- Exhibits169: Stepan Co. - Segment focus
- Exhibits170: Thirumalai Chemicals Ltd. - Overview
- Exhibits171: Thirumalai Chemicals Ltd. - Product / Service
- Exhibits172: Thirumalai Chemicals Ltd. - Key offerings
- Exhibits173: Tokyo Chemical Industry Co. Ltd. - Overview
- Exhibits174: Tokyo Chemical Industry Co. Ltd. - Product / Service
- Exhibits175: Tokyo Chemical Industry Co. Ltd. - Key offerings
- Exhibits176: UPC Technology Corp. - Overview
- Exhibits177: UPC Technology Corp. - Business segments
- Exhibits178: UPC Technology Corp. - Key offerings
- Exhibits179: UPC Technology Corp. - Segment focus
- Exhibits180: Inclusions checklist
- Exhibits181: Exclusions checklist
- Exhibits182: Currency conversion rates for US$
- Exhibits183: Research methodology
- Exhibits184: Information sources
- Exhibits185: Data validation
- Exhibits186: Validation techniques employed for market sizing
- Exhibits187: Data synthesis
- Exhibits188: 360 degree market analysis
- Exhibits189: List of abbreviations
The phthalic anhydride market is forecasted to grow by USD 908.5 mn during 2023-2028, accelerating at a CAGR of 3.59% during the forecast period. The report on the phthalic anhydride market provides a holistic analysis, market size and forecast, trends, growth drivers, and challenges, as well as vendor analysis covering around 25 vendors.
The report offers an up-to-date analysis regarding the current market scenario, the latest trends and drivers, and the overall market environment. The market is driven by growth of construction industry, multifunctional characteristics of UPRs, and rising demand of phthalic anhtdride in automotive sector.
Technavio's phthalic anhydride market is segmented as below:
| Market Scope | |
|---|---|
| Base Year | 2024 |
| End Year | 2028 |
| Series Year | 2024-2028 |
| Growth Momentum | Accelerate |
| YOY 2024 | 3.42% |
| CAGR | 3.59% |
| Incremental Value | $908.5mn |
ByApplication
- Plasticizers
- UPR
- Alkyd resins
- Others
ByType
- O-xylene catalytic oxidation
- Naphthalene catalytic oxidation
ByGeography
- APAC
- North America
- Europe
- South America
- Middle East and Africa
This study identifies the growing demand for green and sustainable resins as one of the prime reasons driving the phthalic anhydride market growth during the next few years. Also, expansion of end-user industries and technological advancements and process innovations for development of phthalic anhydride will lead to sizable demand in the market.
The report on the phthalic anhydride market covers the following areas:
- Phthalic anhydride market sizing
- Phthalic anhydride market forecast
- Phthalic anhydride market industry analysis
The robust vendor analysis is designed to help clients improve their market position, and in line with this, this report provides a detailed analysis of several leading phthalic anhydride market vendors that include AGROFERT AS, Anhui Tongua International Trade Group Co. Ltd., Asian Paints Ltd., BASF SE, Compania Espanola de Petroleos SA, Exxon Mobil Corp., IG Petrochemicals Ltd., Koppers Holdings Inc., Lanxess AG, Mitsubishi Corp., Nan Ya Plastic Corp., PETRONAS Chemicals Group Berhad, Polynt Spa, Proviron Industries NV, Shandong Hongxin Chemical Co. Ltd., Specialty Polymers Inc., Stepan Co., Thirumalai Chemicals Ltd., Tokyo Chemical Industry Co. Ltd., and UPC Technology Corp.. Also, the phthalic anhydride market analysis report includes information on upcoming trends and challenges that will influence market growth. This is to help companies strategize and leverage all forthcoming growth opportunities.
The study was conducted using an objective combination of primary and secondary information including inputs from key participants in the industry. The report contains a comprehensive market and vendor landscape in addition to an analysis of the key vendors.
The publisher presents a detailed picture of the market by the way of study, synthesis, and summation of data from multiple sources by an analysis of key parameters such as profit, pricing, competition, and promotions. It presents various market facets by identifying the key industry influencers. The data presented is comprehensive, reliable, and a result of extensive research - both primary and secondary. The market research reports provide a complete competitive landscape and an in-depth vendor selection methodology and analysis using qualitative and quantitative research to forecast the accurate market growth.
Table of Contents
1 Executive Summary
- 1.1 Market overview
- Executive Summary - Chart on Market Overview
- Executive Summary - Data Table on Market Overview
- Executive Summary - Chart on Global Market Characteristics
- Executive Summary - Chart on Market By Geographical Landscape
- Executive Summary - Chart on Market Segmentation by Application
- Executive Summary - Chart on Market Segmentation by Type
- Executive Summary - Chart on Incremental Growth
- Executive Summary - Data Table on Incremental Growth
- Executive Summary - Chart on Company Market Positioning
2 Market Landscape
- 2.1 Market ecosystem
- Parent Market
- Data Table on - Parent Market
- 2.2 Market characteristics
- Market characteristics analysis
- 2.3 Value chain analysis
- Value Chain Analysis
3 Market Sizing
- 3.1 Market definition
- Offerings of companies included in the market definition
- 3.2 Market segment analysis
- Market segments
- 3.3 Market size 2023
- 3.4 Market outlook: Forecast for 2023-2028
- Chart on Global - Market size and forecast 2023-2028 ($ million)
- Data Table on Global - Market size and forecast 2023-2028 ($ million)
- Chart on Global Market: Year-over-year growth 2023-2028 (%)
- Data Table on Global Market: Year-over-year growth 2023-2028 (%)
4 Historic Market Size
- 4.1 Global Phthalic Anhydride Market 2018 - 2022
- Historic Market Size - Data Table on Global Phthalic Anhydride Market 2018 - 2022 ($ million)
- 4.2 Application segment analysis 2018 - 2022
- Historic Market Size - Application Segment 2018 - 2022 ($ million)
- 4.3 Type segment analysis 2018 - 2022
- Historic Market Size - Type Segment 2018 - 2022 ($ million)
- 4.4 Geography segment analysis 2018 - 2022
- Historic Market Size - Geography Segment 2018 - 2022 ($ million)
- 4.5 Country segment analysis 2018 - 2022
- Historic Market Size - Country Segment 2018 - 2022 ($ million)
5 Five Forces Analysis
- 5.1 Five forces summary
- Five forces analysis - Comparison between 2023 and 2028
- 5.2 Bargaining power of buyers
- Bargaining power of buyers - Impact of key factors 2023 and 2028
- 5.3 Bargaining power of suppliers
- Bargaining power of suppliers - Impact of key factors in 2023 and 2028
- 5.4 Threat of new entrants
- Threat of new entrants - Impact of key factors in 2023 and 2028
- 5.5 Threat of substitutes
- Threat of substitutes - Impact of key factors in 2023 and 2028
- 5.6 Threat of rivalry
- Threat of rivalry - Impact of key factors in 2023 and 2028
- 5.7 Market condition
- Chart on Market condition - Five forces 2023 and 2028
6 Market Segmentation by Application
- 6.1 Market segments
- Chart on Application - Market share 2023-2028 (%)
- Data Table on Application - Market share 2023-2028 (%)
- 6.2 Comparison by Application
- Chart on Comparison by Application
- Data Table on Comparison by Application
- 6.3 Plasticizers - Market size and forecast 2023-2028
- Chart on Plasticizers - Market size and forecast 2023-2028 ($ million)
- Data Table on Plasticizers - Market size and forecast 2023-2028 ($ million)
- Chart on Plasticizers - Year-over-year growth 2023-2028 (%)
- Data Table on Plasticizers - Year-over-year growth 2023-2028 (%)
- 6.4 UPR - Market size and forecast 2023-2028
- Chart on UPR - Market size and forecast 2023-2028 ($ million)
- Data Table on UPR - Market size and forecast 2023-2028 ($ million)
- Chart on UPR - Year-over-year growth 2023-2028 (%)
- Data Table on UPR - Year-over-year growth 2023-2028 (%)
- 6.5 Alkyd resins - Market size and forecast 2023-2028
- Chart on Alkyd resins - Market size and forecast 2023-2028 ($ million)
- Data Table on Alkyd resins - Market size and forecast 2023-2028 ($ million)
- Chart on Alkyd resins - Year-over-year growth 2023-2028 (%)
- Data Table on Alkyd resins - Year-over-year growth 2023-2028 (%)
- 6.6 Others - Market size and forecast 2023-2028
- Chart on Others - Market size and forecast 2023-2028 ($ million)
- Data Table on Others - Market size and forecast 2023-2028 ($ million)
- Chart on Others - Year-over-year growth 2023-2028 (%)
- Data Table on Others - Year-over-year growth 2023-2028 (%)
- 6.7 Market opportunity by Application
- Market opportunity by Application ($ million)
- Data Table on Market opportunity by Application ($ million)
7 Market Segmentation by Type
- 7.1 Market segments
- Chart on Type - Market share 2023-2028 (%)
- Data Table on Type - Market share 2023-2028 (%)
- 7.2 Comparison by Type
- Chart on Comparison by Type
- Data Table on Comparison by Type
- 7.3 O-xylene catalytic oxidation - Market size and forecast 2023-2028
- Chart on O-xylene catalytic oxidation - Market size and forecast 2023-2028 ($ million)
- Data Table on O-xylene catalytic oxidation - Market size and forecast 2023-2028 ($ million)
- Chart on O-xylene catalytic oxidation - Year-over-year growth 2023-2028 (%)
- Data Table on O-xylene catalytic oxidation - Year-over-year growth 2023-2028 (%)
- 7.4 Naphthalene catalytic oxidation - Market size and forecast 2023-2028
- Chart on Naphthalene catalytic oxidation - Market size and forecast 2023-2028 ($ million)
- Data Table on Naphthalene catalytic oxidation - Market size and forecast 2023-2028 ($ million)
- Chart on Naphthalene catalytic oxidation - Year-over-year growth 2023-2028 (%)
- Data Table on Naphthalene catalytic oxidation - Year-over-year growth 2023-2028 (%)
- 7.5 Market opportunity by Type
- Market opportunity by Type ($ million)
- Data Table on Market opportunity by Type ($ million)
8 Customer Landscape
- 8.1 Customer landscape overview
- Analysis of price sensitivity, lifecycle, customer purchase basket, adoption rates, and purchase criteria
9 Geographic Landscape
- 9.1 Geographic segmentation
- Chart on Market share By Geographical Landscape 2023-2028 (%)
- Data Table on Market share By Geographical Landscape 2023-2028 (%)
- 9.2 Geographic comparison
- Chart on Geographic comparison
- Data Table on Geographic comparison
- 9.3 APAC - Market size and forecast 2023-2028
- Chart on APAC - Market size and forecast 2023-2028 ($ million)
- Data Table on APAC - Market size and forecast 2023-2028 ($ million)
- Chart on APAC - Year-over-year growth 2023-2028 (%)
- Data Table on APAC - Year-over-year growth 2023-2028 (%)
- 9.4 North America - Market size and forecast 2023-2028
- Chart on North America - Market size and forecast 2023-2028 ($ million)
- Data Table on North America - Market size and forecast 2023-2028 ($ million)
- Chart on North America - Year-over-year growth 2023-2028 (%)
- Data Table on North America - Year-over-year growth 2023-2028 (%)
- 9.5 Europe - Market size and forecast 2023-2028
- Chart on Europe - Market size and forecast 2023-2028 ($ million)
- Data Table on Europe - Market size and forecast 2023-2028 ($ million)
- Chart on Europe - Year-over-year growth 2023-2028 (%)
- Data Table on Europe - Year-over-year growth 2023-2028 (%)
- 9.6 South America - Market size and forecast 2023-2028
- Chart on South America - Market size and forecast 2023-2028 ($ million)
- Data Table on South America - Market size and forecast 2023-2028 ($ million)
- Chart on South America - Year-over-year growth 2023-2028 (%)
- Data Table on South America - Year-over-year growth 2023-2028 (%)
- 9.7 Middle East and Africa - Market size and forecast 2023-2028
- Chart on Middle East and Africa - Market size and forecast 2023-2028 ($ million)
- Data Table on Middle East and Africa - Market size and forecast 2023-2028 ($ million)
- Chart on Middle East and Africa - Year-over-year growth 2023-2028 (%)
- Data Table on Middle East and Africa - Year-over-year growth 2023-2028 (%)
- 9.8 China - Market size and forecast 2023-2028
- Chart on China - Market size and forecast 2023-2028 ($ million)
- Data Table on China - Market size and forecast 2023-2028 ($ million)
- Chart on China - Year-over-year growth 2023-2028 (%)
- Data Table on China - Year-over-year growth 2023-2028 (%)
- 9.9 US - Market size and forecast 2023-2028
- Chart on US - Market size and forecast 2023-2028 ($ million)
- Data Table on US - Market size and forecast 2023-2028 ($ million)
- Chart on US - Year-over-year growth 2023-2028 (%)
- Data Table on US - Year-over-year growth 2023-2028 (%)
- 9.10 Germany - Market size and forecast 2023-2028
- Chart on Germany - Market size and forecast 2023-2028 ($ million)
- Data Table on Germany - Market size and forecast 2023-2028 ($ million)
- Chart on Germany - Year-over-year growth 2023-2028 (%)
- Data Table on Germany - Year-over-year growth 2023-2028 (%)
- 9.11 Canada - Market size and forecast 2023-2028
- Chart on Canada - Market size and forecast 2023-2028 ($ million)
- Data Table on Canada - Market size and forecast 2023-2028 ($ million)
- Chart on Canada - Year-over-year growth 2023-2028 (%)
- Data Table on Canada - Year-over-year growth 2023-2028 (%)
- 9.12 India - Market size and forecast 2023-2028
- Chart on India - Market size and forecast 2023-2028 ($ million)
- Data Table on India - Market size and forecast 2023-2028 ($ million)
- Chart on India - Year-over-year growth 2023-2028 (%)
- Data Table on India - Year-over-year growth 2023-2028 (%)
- 9.13 Market opportunity By Geographical Landscape
- Market opportunity By Geographical Landscape ($ million)
- Data Tables on Market opportunity By Geographical Landscape ($ million)
10 Drivers, Challenges, and Opportunity/Restraints
- 10.1 Market drivers
- 10.2 Market challenges
- 10.3 Impact of drivers and challenges
- Impact of drivers and challenges in 2023 and 2028
- 10.4 Market opportunities/restraints
11 Competitive Landscape
- 11.1 Overview
- 11.2 Competitive Landscape
- Overview on criticality of inputs and factors of differentiation
- 11.3 Landscape disruption
- Overview on factors of disruption
- 11.4 Industry risks
- Impact of key risks on business
12 Competitive Analysis
- 12.1 Companies profiled
- Companies covered
- 12.2 Market positioning of companies
- Matrix on companies position and classification
- 12.3 AGROFERT AS
- AGROFERT AS - Overview
- AGROFERT AS - Product / Service
- AGROFERT AS - Key offerings
- 12.4 Asian Paints Ltd.
- Asian Paints Ltd. - Overview
- Asian Paints Ltd. - Business segments
- Asian Paints Ltd. - Key offerings
- Asian Paints Ltd. - Segment focus
- 12.5 BASF SE
- BASF SE - Overview
- BASF SE - Business segments
- BASF SE - Key news
- BASF SE - Key offerings
- BASF SE - Segment focus
- 12.6 Compania Espanola de Petroleos SA
- Compania Espanola de Petroleos SA - Overview
- Compania Espanola de Petroleos SA - Business segments
- Compania Espanola de Petroleos SA - Key offerings
- Compania Espanola de Petroleos SA - Segment focus
- 12.7 Exxon Mobil Corp.
- Exxon Mobil Corp. - Overview
- Exxon Mobil Corp. - Business segments
- Exxon Mobil Corp. - Key news
- Exxon Mobil Corp. - Key offerings
- Exxon Mobil Corp. - Segment focus
- 12.8 IG Petrochemicals Ltd.
- IG Petrochemicals Ltd. - Overview
- IG Petrochemicals Ltd. - Product / Service
- IG Petrochemicals Ltd. - Key offerings
- 12.9 Koppers Holdings Inc.
- Koppers Holdings Inc. - Overview
- Koppers Holdings Inc. - Business segments
- Koppers Holdings Inc. - Key offerings
- Koppers Holdings Inc. - Segment focus
- 12.10 Lanxess AG
- Lanxess AG - Overview
- Lanxess AG - Business segments
- Lanxess AG - Key news
- Lanxess AG - Key offerings
- Lanxess AG - Segment focus
- 12.11 Mitsubishi Corp.
- Mitsubishi Corp. - Overview
- Mitsubishi Corp. - Business segments
- Mitsubishi Corp. - Key news
- Mitsubishi Corp. - Key offerings
- Mitsubishi Corp. - Segment focus
- 12.12 Polynt Spa
- Polynt Spa - Overview
- Polynt Spa - Product / Service
- Polynt Spa - Key offerings
- 12.13 Specialty Polymers Inc.
- Specialty Polymers Inc. - Overview
- Specialty Polymers Inc. - Product / Service
- Specialty Polymers Inc. - Key offerings
- 12.14 Stepan Co.
- Stepan Co. - Overview
- Stepan Co. - Business segments
- Stepan Co. - Key news
- Stepan Co. - Key offerings
- Stepan Co. - Segment focus
- 12.15 Thirumalai Chemicals Ltd.
- Thirumalai Chemicals Ltd. - Overview
- Thirumalai Chemicals Ltd. - Product / Service
- Thirumalai Chemicals Ltd. - Key offerings
- 12.16 Tokyo Chemical Industry Co. Ltd.
- Tokyo Chemical Industry Co. Ltd. - Overview
- Tokyo Chemical Industry Co. Ltd. - Product / Service
- Tokyo Chemical Industry Co. Ltd. - Key offerings
- 12.17 UPC Technology Corp.
- UPC Technology Corp. - Overview
- UPC Technology Corp. - Business segments
- UPC Technology Corp. - Key offerings
- UPC Technology Corp. - Segment focus
13 Appendix
- 13.1 Scope of the report
- 13.2 Inclusions and exclusions checklist
- Inclusions checklist
- Exclusions checklist
- 13.3 Currency conversion rates for US$
- Currency conversion rates for US$
- 13.4 Research methodology
- Research methodology
- 13.5 Data procurement
- Information sources
- 13.6 Data validation
- Data validation
- 13.7 Validation techniques employed for market sizing
- Validation techniques employed for market sizing
- 13.8 Data synthesis
- Data synthesis
- 13.9 360 degree market analysis
- 360 degree market analysis
- 13.10 List of abbreviations
- List of abbreviations
