|
|
市場調査レポート
商品コード
1583032
自動車用四輪駆動車の世界市場、2024~2028年Global Automotive Four-wheel drive Vehicle Market 2024-2028 |
||||||

|
|||||||
カスタマイズ可能
|
|||||||

| 自動車用四輪駆動車の世界市場、2024~2028年 |
|
出版日: 2024年08月15日
発行: TechNavio
ページ情報: 英文 177 Pages
納期: 即納可能
|

全表示
- 概要
- 図表
- 目次
自動車用四輪駆動車市場、2024~2028年
自動車用四輪駆動車市場は2023~2028年に823億米ドル、予測期間中のCAGRは3.61%で成長すると予測されます。当レポートでは、自動車用四輪駆動車市場の全体的な分析、市場規模・予測、動向、成長促進要因、課題、約25のベンダーを網羅したベンダー分析などを掲載しています。
現在の市場シナリオ、最新動向と促進要因、市場環境全体に関する最新分析を提供しています。四輪駆動部品の電動化に伴うメリット、四輪駆動システムに伴うメリット、SUVやピックアップトラックの需要拡大などが市場を牽引しています。
| 市場範囲 | |
|---|---|
| 基準年 | 2024年 |
| 終了年 | 2028年 |
| 予測期間 | 2024~2028年 |
| 成長モメンタム | 加速 |
| 前年比[2024年] | 3.35% |
| CAGR | 3.61% |
| 増分額 | 823億米ドル |
本調査では、今後数年間の自動車用四輪駆動車市場の成長を促進する主要要因の1つとして、ドライブシャフトと機械式ディファレンシャルを電動ドライブアクスルに置き換えることを挙げています。また、四輪駆動システムによる複数の地形プロファイルの利用可能性や、AWDのインテリジェント・トルク・ベクタリングの市場開拓は、市場の大きな需要につながります。
目次
第1章 エグゼクティブサマリー
- 市場概要
第2章 市場情勢
- 市場エコシステム
- 市場の特徴
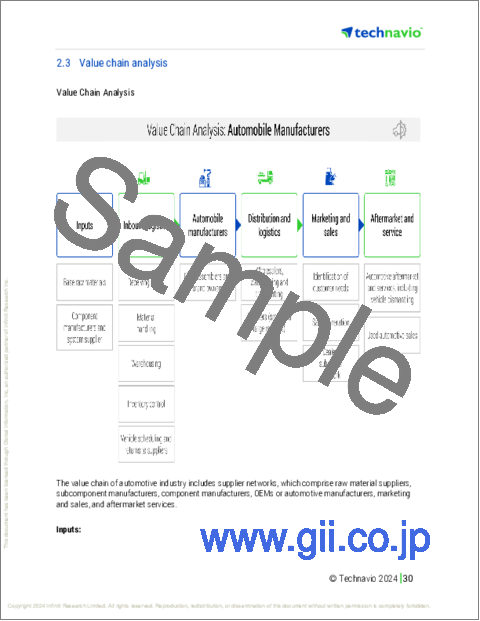
- バリューチェーン分析
第3章 市場規模の評価
- 市場の定義
- 市場セグメント分析
- 市場規模 2023年
- 市場の展望 2023~2028年
第4章 市場規模実績
- 自動車用四輪駆動車の世界市場 2018~2022年
- タイプ別セグメント分析 2018~2022年
- 車種セグメント分析 2018~2022年
- 地域別セグメント分析 2018~2022年
- 国別セグメント分析 2018~2022年
第5章 ファイブフォース分析
- ファイブフォースの要約
- 買い手の交渉力
- 供給企業の交渉力
- 新規参入業者の脅威
- 代替品の脅威
- 競争の脅威
- 市況
第6章 タイプ別市場セグメンテーション
- 市場セグメンテーション
- 比較:タイプ別
- SUVとクロスオーバー:市場規模と予測 2023~2028年
- ピックアップトラック:市場規模と予測 2023~2028年
- 高級セダン:市場規模と予測 2023~2028年
- タイプ別の市場機会
第7章 車種別市場セグメンテーション
- 市場セグメンテーション
- 比較:車種別
- 乗用車:市場規模と予測 2023~2028年
- 商用車:市場規模と予測 2023~2028年
- 車種別の市場機会
第8章 顧客情勢
- 顧客情勢概要
第9章 地域別情勢
- 地域別セグメンテーション
- 比較:地域別
- 北米:市場規模と予測 2023~2028年
- アジア太平洋:市場規模と予測 2023~2028年
- 欧州:市場規模と予測 2023~2028年
- 中東・アフリカ:市場規模と予測 2023~2028年
- 南米:市場規模と予測 2023~2028年
- 米国:市場規模と予測 2023~2028年
- 中国:市場規模と予測 2023~2028年
- カナダ:市場規模と予測 2023~2028年
- 日本:市場規模と予測 2023~2028年
- 英国:市場規模と予測 2023~2028年
- 地域情勢別の市場機会
第10章 促進要因・課題・機会・抑制要因
- 市場促進要因
- 市場課題
- 促進要因と課題の影響
- 市場機会・抑制要因
第11章 競合情勢
- 概要
- 競合情勢
- 混乱の状況
- 業界のリスク
第12章 競合分析
- 企業プロファイル
- 企業の市場ポジショニング
- Bayerische Motoren Werke AG
- BYD Co. Ltd.
- Ford Motor Co.
- General Motors Co.
- Honda Motor Co. Ltd.
- Hyundai Motor Co.
- Isuzu Motors Ltd.
- Mahindra and Mahindra Ltd.
- Mercedes Benz Group AG
- MG Motor India Pvt. Ltd.
- Nissan Motor Co. Ltd.
- Renault SAS
- Stellantis NV
- Toyota Motor Corp.
- Volkswagen AG
第13章 付録
Exhibits:
- Exhibits1: Executive Summary - Chart on Market Overview
- Exhibits2: Executive Summary - Data Table on Market Overview
- Exhibits3: Executive Summary - Chart on Global Market Characteristics
- Exhibits4: Executive Summary - Chart on Market By Geographical Landscape
- Exhibits5: Executive Summary - Chart on Market Segmentation by Type
- Exhibits6: Executive Summary - Chart on Market Segmentation by Vehicle Type
- Exhibits7: Executive Summary - Chart on Incremental Growth
- Exhibits8: Executive Summary - Data Table on Incremental Growth
- Exhibits9: Executive Summary - Chart on Company Market Positioning
- Exhibits10: Parent Market
- Exhibits11: Data Table on - Parent Market
- Exhibits12: Market characteristics analysis
- Exhibits13: Value Chain Analysis
- Exhibits14: Offerings of companies included in the market definition
- Exhibits15: Market segments
- Exhibits16: Chart on Global - Market size and forecast 2023-2028 ($ billion)
- Exhibits17: Data Table on Global - Market size and forecast 2023-2028 ($ billion)
- Exhibits18: Chart on Global Market: Year-over-year growth 2023-2028 (%)
- Exhibits19: Data Table on Global Market: Year-over-year growth 2023-2028 (%)
- Exhibits20: Historic Market Size - Data Table on Global Automotive Four-Wheel Drive Vehicle Market 2018 - 2022 ($ billion)
- Exhibits21: Historic Market Size - Type Segment 2018 - 2022 ($ billion)
- Exhibits22: Historic Market Size - Vehicle Type Segment 2018 - 2022 ($ billion)
- Exhibits23: Historic Market Size - Geography Segment 2018 - 2022 ($ billion)
- Exhibits24: Historic Market Size - Country Segment 2018 - 2022 ($ billion)
- Exhibits25: Five forces analysis - Comparison between 2023 and 2028
- Exhibits26: Bargaining power of buyers - Impact of key factors 2023 and 2028
- Exhibits27: Bargaining power of suppliers - Impact of key factors in 2023 and 2028
- Exhibits28: Threat of new entrants - Impact of key factors in 2023 and 2028
- Exhibits29: Threat of substitutes - Impact of key factors in 2023 and 2028
- Exhibits30: Threat of rivalry - Impact of key factors in 2023 and 2028
- Exhibits31: Chart on Market condition - Five forces 2023 and 2028
- Exhibits32: Chart on Type - Market share 2023-2028 (%)
- Exhibits33: Data Table on Type - Market share 2023-2028 (%)
- Exhibits34: Chart on Comparison by Type
- Exhibits35: Data Table on Comparison by Type
- Exhibits36: Chart on SUVs and crossovers - Market size and forecast 2023-2028 ($ billion)
- Exhibits37: Data Table on SUVs and crossovers - Market size and forecast 2023-2028 ($ billion)
- Exhibits38: Chart on SUVs and crossovers - Year-over-year growth 2023-2028 (%)
- Exhibits39: Data Table on SUVs and crossovers - Year-over-year growth 2023-2028 (%)
- Exhibits40: Chart on Pickup trucks - Market size and forecast 2023-2028 ($ billion)
- Exhibits41: Data Table on Pickup trucks - Market size and forecast 2023-2028 ($ billion)
- Exhibits42: Chart on Pickup trucks - Year-over-year growth 2023-2028 (%)
- Exhibits43: Data Table on Pickup trucks - Year-over-year growth 2023-2028 (%)
- Exhibits44: Chart on Premium and luxury sedans? - Market size and forecast 2023-2028 ($ billion)
- Exhibits45: Data Table on Premium and luxury sedans? - Market size and forecast 2023-2028 ($ billion)
- Exhibits46: Chart on Premium and luxury sedans? - Year-over-year growth 2023-2028 (%)
- Exhibits47: Data Table on Premium and luxury sedans? - Year-over-year growth 2023-2028 (%)
- Exhibits48: Market opportunity by Type ($ billion)
- Exhibits49: Data Table on Market opportunity by Type ($ billion)
- Exhibits50: Chart on Vehicle Type - Market share 2023-2028 (%)
- Exhibits51: Data Table on Vehicle Type - Market share 2023-2028 (%)
- Exhibits52: Chart on Comparison by Vehicle Type
- Exhibits53: Data Table on Comparison by Vehicle Type
- Exhibits54: Chart on Passenger cars - Market size and forecast 2023-2028 ($ billion)
- Exhibits55: Data Table on Passenger cars - Market size and forecast 2023-2028 ($ billion)
- Exhibits56: Chart on Passenger cars - Year-over-year growth 2023-2028 (%)
- Exhibits57: Data Table on Passenger cars - Year-over-year growth 2023-2028 (%)
- Exhibits58: Chart on Commercial vehicles - Market size and forecast 2023-2028 ($ billion)
- Exhibits59: Data Table on Commercial vehicles - Market size and forecast 2023-2028 ($ billion)
- Exhibits60: Chart on Commercial vehicles - Year-over-year growth 2023-2028 (%)
- Exhibits61: Data Table on Commercial vehicles - Year-over-year growth 2023-2028 (%)
- Exhibits62: Market opportunity by Vehicle Type ($ billion)
- Exhibits63: Data Table on Market opportunity by Vehicle Type ($ billion)
- Exhibits64: Analysis of price sensitivity, lifecycle, customer purchase basket, adoption rates, and purchase criteria
- Exhibits65: Chart on Market share By Geographical Landscape 2023-2028 (%)
- Exhibits66: Data Table on Market share By Geographical Landscape 2023-2028 (%)
- Exhibits67: Chart on Geographic comparison
- Exhibits68: Data Table on Geographic comparison
- Exhibits69: Chart on North America - Market size and forecast 2023-2028 ($ billion)
- Exhibits70: Data Table on North America - Market size and forecast 2023-2028 ($ billion)
- Exhibits71: Chart on North America - Year-over-year growth 2023-2028 (%)
- Exhibits72: Data Table on North America - Year-over-year growth 2023-2028 (%)
- Exhibits73: Chart on APAC - Market size and forecast 2023-2028 ($ billion)
- Exhibits74: Data Table on APAC - Market size and forecast 2023-2028 ($ billion)
- Exhibits75: Chart on APAC - Year-over-year growth 2023-2028 (%)
- Exhibits76: Data Table on APAC - Year-over-year growth 2023-2028 (%)
- Exhibits77: Chart on Europe - Market size and forecast 2023-2028 ($ billion)
- Exhibits78: Data Table on Europe - Market size and forecast 2023-2028 ($ billion)
- Exhibits79: Chart on Europe - Year-over-year growth 2023-2028 (%)
- Exhibits80: Data Table on Europe - Year-over-year growth 2023-2028 (%)
- Exhibits81: Chart on Middle East and Africa - Market size and forecast 2023-2028 ($ billion)
- Exhibits82: Data Table on Middle East and Africa - Market size and forecast 2023-2028 ($ billion)
- Exhibits83: Chart on Middle East and Africa - Year-over-year growth 2023-2028 (%)
- Exhibits84: Data Table on Middle East and Africa - Year-over-year growth 2023-2028 (%)
- Exhibits85: Chart on South America - Market size and forecast 2023-2028 ($ billion)
- Exhibits86: Data Table on South America - Market size and forecast 2023-2028 ($ billion)
- Exhibits87: Chart on South America - Year-over-year growth 2023-2028 (%)
- Exhibits88: Data Table on South America - Year-over-year growth 2023-2028 (%)
- Exhibits89: Chart on US - Market size and forecast 2023-2028 ($ billion)
- Exhibits90: Data Table on US - Market size and forecast 2023-2028 ($ billion)
- Exhibits91: Chart on US - Year-over-year growth 2023-2028 (%)
- Exhibits92: Data Table on US - Year-over-year growth 2023-2028 (%)
- Exhibits93: Chart on China - Market size and forecast 2023-2028 ($ billion)
- Exhibits94: Data Table on China - Market size and forecast 2023-2028 ($ billion)
- Exhibits95: Chart on China - Year-over-year growth 2023-2028 (%)
- Exhibits96: Data Table on China - Year-over-year growth 2023-2028 (%)
- Exhibits97: Chart on Canada - Market size and forecast 2023-2028 ($ billion)
- Exhibits98: Data Table on Canada - Market size and forecast 2023-2028 ($ billion)
- Exhibits99: Chart on Canada - Year-over-year growth 2023-2028 (%)
- Exhibits100: Data Table on Canada - Year-over-year growth 2023-2028 (%)
- Exhibits101: Chart on Japan - Market size and forecast 2023-2028 ($ billion)
- Exhibits102: Data Table on Japan - Market size and forecast 2023-2028 ($ billion)
- Exhibits103: Chart on Japan - Year-over-year growth 2023-2028 (%)
- Exhibits104: Data Table on Japan - Year-over-year growth 2023-2028 (%)
- Exhibits105: Chart on UK - Market size and forecast 2023-2028 ($ billion)
- Exhibits106: Data Table on UK - Market size and forecast 2023-2028 ($ billion)
- Exhibits107: Chart on UK - Year-over-year growth 2023-2028 (%)
- Exhibits108: Data Table on UK - Year-over-year growth 2023-2028 (%)
- Exhibits109: Market opportunity By Geographical Landscape ($ billion)
- Exhibits110: Data Tables on Market opportunity By Geographical Landscape ($ billion)
- Exhibits111: Impact of drivers and challenges in 2023 and 2028
- Exhibits112: Overview on criticality of inputs and factors of differentiation
- Exhibits113: Overview on factors of disruption
- Exhibits114: Impact of key risks on business
- Exhibits115: Companies covered
- Exhibits116: Matrix on companies position and classification
- Exhibits117: Bayerische Motoren Werke AG - Overview
- Exhibits118: Bayerische Motoren Werke AG - Business segments
- Exhibits119: Bayerische Motoren Werke AG - Key news
- Exhibits120: Bayerische Motoren Werke AG - Key offerings
- Exhibits121: Bayerische Motoren Werke AG - Segment focus
- Exhibits122: BYD Co. Ltd. - Overview
- Exhibits123: BYD Co. Ltd. - Business segments
- Exhibits124: BYD Co. Ltd. - Key news
- Exhibits125: BYD Co. Ltd. - Key offerings
- Exhibits126: BYD Co. Ltd. - Segment focus
- Exhibits127: Ford Motor Co. - Overview
- Exhibits128: Ford Motor Co. - Business segments
- Exhibits129: Ford Motor Co. - Key news
- Exhibits130: Ford Motor Co. - Key offerings
- Exhibits131: Ford Motor Co. - Segment focus
- Exhibits132: General Motors Co. - Overview
- Exhibits133: General Motors Co. - Business segments
- Exhibits134: General Motors Co. - Key news
- Exhibits135: General Motors Co. - Key offerings
- Exhibits136: General Motors Co. - Segment focus
- Exhibits137: Honda Motor Co. Ltd. - Overview
- Exhibits138: Honda Motor Co. Ltd. - Business segments
- Exhibits139: Honda Motor Co. Ltd. - Key offerings
- Exhibits140: Honda Motor Co. Ltd. - Segment focus
- Exhibits141: Hyundai Motor Co. - Overview
- Exhibits142: Hyundai Motor Co. - Business segments
- Exhibits143: Hyundai Motor Co. - Key news
- Exhibits144: Hyundai Motor Co. - Key offerings
- Exhibits145: Hyundai Motor Co. - Segment focus
- Exhibits146: Isuzu Motors Ltd. - Overview
- Exhibits147: Isuzu Motors Ltd. - Product / Service
- Exhibits148: Isuzu Motors Ltd. - Key news
- Exhibits149: Isuzu Motors Ltd. - Key offerings
- Exhibits150: Mahindra and Mahindra Ltd. - Overview
- Exhibits151: Mahindra and Mahindra Ltd. - Business segments
- Exhibits152: Mahindra and Mahindra Ltd. - Key news
- Exhibits153: Mahindra and Mahindra Ltd. - Key offerings
- Exhibits154: Mahindra and Mahindra Ltd. - Segment focus
- Exhibits155: Mercedes Benz Group AG - Overview
- Exhibits156: Mercedes Benz Group AG - Business segments
- Exhibits157: Mercedes Benz Group AG - Key news
- Exhibits158: Mercedes Benz Group AG - Key offerings
- Exhibits159: Mercedes Benz Group AG - Segment focus
- Exhibits160: MG Motor India Pvt. Ltd. - Overview
- Exhibits161: MG Motor India Pvt. Ltd. - Product / Service
- Exhibits162: MG Motor India Pvt. Ltd. - Key offerings
- Exhibits163: Nissan Motor Co. Ltd. - Overview
- Exhibits164: Nissan Motor Co. Ltd. - Business segments
- Exhibits165: Nissan Motor Co. Ltd. - Key news
- Exhibits166: Nissan Motor Co. Ltd. - Key offerings
- Exhibits167: Nissan Motor Co. Ltd. - Segment focus
- Exhibits168: Renault SAS - Overview
- Exhibits169: Renault SAS - Product / Service
- Exhibits170: Renault SAS - Key news
- Exhibits171: Renault SAS - Key offerings
- Exhibits172: Stellantis NV - Overview
- Exhibits173: Stellantis NV - Business segments
- Exhibits174: Stellantis NV - Key news
- Exhibits175: Stellantis NV - Key offerings
- Exhibits176: Stellantis NV - Segment focus
- Exhibits177: Toyota Motor Corp. - Overview
- Exhibits178: Toyota Motor Corp. - Business segments
- Exhibits179: Toyota Motor Corp. - Key news
- Exhibits180: Toyota Motor Corp. - Key offerings
- Exhibits181: Toyota Motor Corp. - Segment focus
- Exhibits182: Volkswagen AG - Overview
- Exhibits183: Volkswagen AG - Business segments
- Exhibits184: Volkswagen AG - Key news
- Exhibits185: Volkswagen AG - Key offerings
- Exhibits186: Volkswagen AG - Segment focus
- Exhibits187: Inclusions checklist
- Exhibits188: Exclusions checklist
- Exhibits189: Currency conversion rates for US$
- Exhibits190: Research methodology
- Exhibits191: Information sources
- Exhibits192: Data validation
- Exhibits193: Validation techniques employed for market sizing
- Exhibits194: Data synthesis
- Exhibits195: 360 degree market analysis
- Exhibits196: List of abbreviations
Automotive Four-Wheel Drive Vehicle Market 2024-2028
The automotive four-wheel drive vehicle market is forecasted to grow by USD 82.3 bn during 2023-2028, accelerating at a CAGR of 3.61% during the forecast period. The report on the automotive four-wheel drive vehicle market provides a holistic analysis, market size and forecast, trends, growth drivers, and challenges, as well as vendor analysis covering around 25 vendors.
The report offers an up-to-date analysis regarding the current market scenario, the latest trends and drivers, and the overall market environment. The market is driven by benefits associated with electrification of four-wheel drive components, advantages associated with four-wheel drive system, and growing demand for suvs and pickup trucks.
| Market Scope | |
|---|---|
| Base Year | 2024 |
| End Year | 2028 |
| Series Year | 2024-2028 |
| Growth Momentum | Accelerate |
| YOY 2024 | 3.35% |
| CAGR | 3.61% |
| Incremental Value | $82.3 bn |
Technavio's automotive four-wheel drive vehicle market is segmented as below:
By Type
- SUVs and crossovers
- Pickup trucks
- Premium and luxury sedans
By Vehicle Type
- Passenger cars
- Commercial vehicles
By Geographical Landscape
- North America
- APAC
- Europe
- Middle East and Africa
- South America
This study identifies the replacement of drive shaft and mechanical differentials with electric drive axles as one of the prime reasons driving the automotive four-wheel drive vehicle market growth during the next few years. Also, availability of multiple terrain profiles with four-wheel drive systems and development of intelligent torque vectoring for AWD will lead to sizable demand in the market.
The report on the automotive four-wheel drive vehicle market covers the following areas:
- Automotive four-wheel drive vehicle market sizing
- Automotive four-wheel drive vehicle market forecast
- Automotive four-wheel drive vehicle market industry analysis
The vendor analysis is designed to help clients improve their market position, and in line with this, this report provides a detailed analysis of several leading automotive four-wheel drive vehicle market vendors that include Bayerische Motoren Werke AG, BYD Co. Ltd., Ford Motor Co., General Motors Co., Honda Motor Co. Ltd., Hyundai Motor Co., Isuzu Motors Ltd., Mahindra and Mahindra Ltd., Mazda Motor Corp., Mercedes Benz Group AG, MG Motor India Pvt. Ltd., Mitsubishi Motors Corp., Nissan Motor Co. Ltd., Renault SAS, Stellantis NV, Suzuki Motor Corp., Tata Motors Ltd., Toyota Motor Corp., and Volkswagen AG. Also, the automotive four-wheel drive vehicle market analysis report includes information on upcoming trends and challenges that will influence market growth. This is to help companies strategize and leverage all forthcoming growth opportunities.
The study was conducted using an objective combination of primary and secondary information including inputs from key participants in the industry. The report contains a comprehensive market and vendor landscape in addition to an analysis of the key vendors.
It presents various market facets by identifying the key industry influencers. The data presented is comprehensive, reliable, and a result of extensive primary and secondary research. The market research reports provide a complete competitive landscape and an in-depth vendor selection methodology and analysis using qualitative and quantitative research to forecast accurate market growth.
Table of Contents
1 Executive Summary
- 1.1 Market overview
- Executive Summary - Chart on Market Overview
- Executive Summary - Data Table on Market Overview
- Executive Summary - Chart on Global Market Characteristics
- Executive Summary - Chart on Market By Geographical Landscape
- Executive Summary - Chart on Market Segmentation by Type
- Executive Summary - Chart on Market Segmentation by Vehicle Type
- Executive Summary - Chart on Incremental Growth
- Executive Summary - Data Table on Incremental Growth
- Executive Summary - Chart on Company Market Positioning
2 Market Landscape
- 2.1 Market ecosystem
- Parent Market
- Data Table on - Parent Market
- 2.2 Market characteristics
- Market characteristics analysis
- 2.3 Value chain analysis
- Value Chain Analysis
3 Market Sizing
- 3.1 Market definition
- Offerings of companies included in the market definition
- 3.2 Market segment analysis
- Market segments
- 3.3 Market size 2023
- 3.4 Market outlook: Forecast for 2023-2028
- Chart on Global - Market size and forecast 2023-2028 ($ billion)
- Data Table on Global - Market size and forecast 2023-2028 ($ billion)
- Chart on Global Market: Year-over-year growth 2023-2028 (%)
- Data Table on Global Market: Year-over-year growth 2023-2028 (%)
4 Historic Market Size
- 4.1 Global Automotive Four-Wheel Drive Vehicle Market 2018 - 2022
- Historic Market Size - Data Table on Global Automotive Four-Wheel Drive Vehicle Market 2018 - 2022 ($ billion)
- 4.2 Type segment analysis 2018 - 2022
- Historic Market Size - Type Segment 2018 - 2022 ($ billion)
- 4.3 Vehicle Type segment analysis 2018 - 2022
- Historic Market Size - Vehicle Type Segment 2018 - 2022 ($ billion)
- 4.4 Geography segment analysis 2018 - 2022
- Historic Market Size - Geography Segment 2018 - 2022 ($ billion)
- 4.5 Country segment analysis 2018 - 2022
- Historic Market Size - Country Segment 2018 - 2022 ($ billion)
5 Five Forces Analysis
- 5.1 Five forces summary
- Five forces analysis - Comparison between 2023 and 2028
- 5.2 Bargaining power of buyers
- Bargaining power of buyers - Impact of key factors 2023 and 2028
- 5.3 Bargaining power of suppliers
- Bargaining power of suppliers - Impact of key factors in 2023 and 2028
- 5.4 Threat of new entrants
- Threat of new entrants - Impact of key factors in 2023 and 2028
- 5.5 Threat of substitutes
- Threat of substitutes - Impact of key factors in 2023 and 2028
- 5.6 Threat of rivalry
- Threat of rivalry - Impact of key factors in 2023 and 2028
- 5.7 Market condition
- Chart on Market condition - Five forces 2023 and 2028
6 Market Segmentation by Type
- 6.1 Market segments
- Chart on Type - Market share 2023-2028 (%)
- Data Table on Type - Market share 2023-2028 (%)
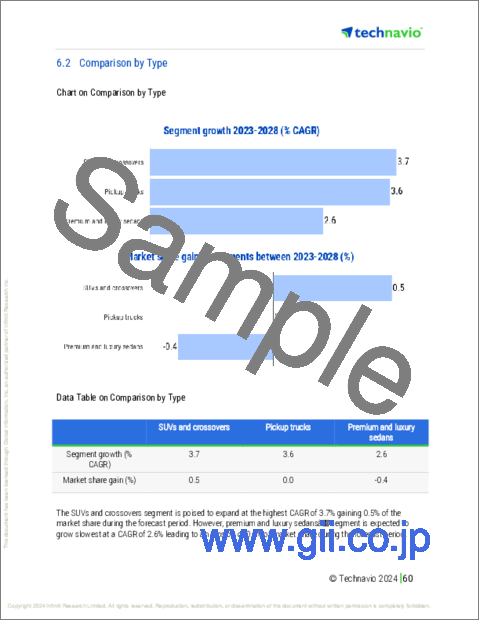
- 6.2 Comparison by Type
- Chart on Comparison by Type
- Data Table on Comparison by Type
- 6.3 SUVs and crossovers - Market size and forecast 2023-2028
- Chart on SUVs and crossovers - Market size and forecast 2023-2028 ($ billion)
- Data Table on SUVs and crossovers - Market size and forecast 2023-2028 ($ billion)
- Chart on SUVs and crossovers - Year-over-year growth 2023-2028 (%)
- Data Table on SUVs and crossovers - Year-over-year growth 2023-2028 (%)
- 6.4 Pickup trucks - Market size and forecast 2023-2028
- Chart on Pickup trucks - Market size and forecast 2023-2028 ($ billion)
- Data Table on Pickup trucks - Market size and forecast 2023-2028 ($ billion)
- Chart on Pickup trucks - Year-over-year growth 2023-2028 (%)
- Data Table on Pickup trucks - Year-over-year growth 2023-2028 (%)
- 6.5 Premium and luxury sedans? - Market size and forecast 2023-2028
- Chart on Premium and luxury sedans? - Market size and forecast 2023-2028 ($ billion)
- Data Table on Premium and luxury sedans? - Market size and forecast 2023-2028 ($ billion)
- Chart on Premium and luxury sedans? - Year-over-year growth 2023-2028 (%)
- Data Table on Premium and luxury sedans? - Year-over-year growth 2023-2028 (%)
- 6.6 Market opportunity by Type
- Market opportunity by Type ($ billion)
- Data Table on Market opportunity by Type ($ billion)
7 Market Segmentation by Vehicle Type
- 7.1 Market segments
- Chart on Vehicle Type - Market share 2023-2028 (%)
- Data Table on Vehicle Type - Market share 2023-2028 (%)
- 7.2 Comparison by Vehicle Type
- Chart on Comparison by Vehicle Type
- Data Table on Comparison by Vehicle Type
- 7.3 Passenger cars - Market size and forecast 2023-2028
- Chart on Passenger cars - Market size and forecast 2023-2028 ($ billion)
- Data Table on Passenger cars - Market size and forecast 2023-2028 ($ billion)
- Chart on Passenger cars - Year-over-year growth 2023-2028 (%)
- Data Table on Passenger cars - Year-over-year growth 2023-2028 (%)
- 7.4 Commercial vehicles - Market size and forecast 2023-2028
- Chart on Commercial vehicles - Market size and forecast 2023-2028 ($ billion)
- Data Table on Commercial vehicles - Market size and forecast 2023-2028 ($ billion)
- Chart on Commercial vehicles - Year-over-year growth 2023-2028 (%)
- Data Table on Commercial vehicles - Year-over-year growth 2023-2028 (%)
- 7.5 Market opportunity by Vehicle Type
- Market opportunity by Vehicle Type ($ billion)
- Data Table on Market opportunity by Vehicle Type ($ billion)
8 Customer Landscape
- 8.1 Customer landscape overview
- Analysis of price sensitivity, lifecycle, customer purchase basket, adoption rates, and purchase criteria
9 Geographic Landscape
- 9.1 Geographic segmentation
- Chart on Market share By Geographical Landscape 2023-2028 (%)
- Data Table on Market share By Geographical Landscape 2023-2028 (%)
- 9.2 Geographic comparison
- Chart on Geographic comparison
- Data Table on Geographic comparison
- 9.3 North America - Market size and forecast 2023-2028
- Chart on North America - Market size and forecast 2023-2028 ($ billion)
- Data Table on North America - Market size and forecast 2023-2028 ($ billion)
- Chart on North America - Year-over-year growth 2023-2028 (%)
- Data Table on North America - Year-over-year growth 2023-2028 (%)
- 9.4 APAC - Market size and forecast 2023-2028
- Chart on APAC - Market size and forecast 2023-2028 ($ billion)
- Data Table on APAC - Market size and forecast 2023-2028 ($ billion)
- Chart on APAC - Year-over-year growth 2023-2028 (%)
- Data Table on APAC - Year-over-year growth 2023-2028 (%)
- 9.5 Europe - Market size and forecast 2023-2028
- Chart on Europe - Market size and forecast 2023-2028 ($ billion)
- Data Table on Europe - Market size and forecast 2023-2028 ($ billion)
- Chart on Europe - Year-over-year growth 2023-2028 (%)
- Data Table on Europe - Year-over-year growth 2023-2028 (%)
- 9.6 Middle East and Africa - Market size and forecast 2023-2028
- Chart on Middle East and Africa - Market size and forecast 2023-2028 ($ billion)
- Data Table on Middle East and Africa - Market size and forecast 2023-2028 ($ billion)
- Chart on Middle East and Africa - Year-over-year growth 2023-2028 (%)
- Data Table on Middle East and Africa - Year-over-year growth 2023-2028 (%)
- 9.7 South America - Market size and forecast 2023-2028
- Chart on South America - Market size and forecast 2023-2028 ($ billion)
- Data Table on South America - Market size and forecast 2023-2028 ($ billion)
- Chart on South America - Year-over-year growth 2023-2028 (%)
- Data Table on South America - Year-over-year growth 2023-2028 (%)
- 9.8 US - Market size and forecast 2023-2028
- Chart on US - Market size and forecast 2023-2028 ($ billion)
- Data Table on US - Market size and forecast 2023-2028 ($ billion)
- Chart on US - Year-over-year growth 2023-2028 (%)
- Data Table on US - Year-over-year growth 2023-2028 (%)
- 9.9 China - Market size and forecast 2023-2028
- Chart on China - Market size and forecast 2023-2028 ($ billion)
- Data Table on China - Market size and forecast 2023-2028 ($ billion)
- Chart on China - Year-over-year growth 2023-2028 (%)
- Data Table on China - Year-over-year growth 2023-2028 (%)
- 9.10 Canada - Market size and forecast 2023-2028
- Chart on Canada - Market size and forecast 2023-2028 ($ billion)
- Data Table on Canada - Market size and forecast 2023-2028 ($ billion)
- Chart on Canada - Year-over-year growth 2023-2028 (%)
- Data Table on Canada - Year-over-year growth 2023-2028 (%)
- 9.11 Japan - Market size and forecast 2023-2028
- Chart on Japan - Market size and forecast 2023-2028 ($ billion)
- Data Table on Japan - Market size and forecast 2023-2028 ($ billion)
- Chart on Japan - Year-over-year growth 2023-2028 (%)
- Data Table on Japan - Year-over-year growth 2023-2028 (%)
- 9.12 UK - Market size and forecast 2023-2028
- Chart on UK - Market size and forecast 2023-2028 ($ billion)
- Data Table on UK - Market size and forecast 2023-2028 ($ billion)
- Chart on UK - Year-over-year growth 2023-2028 (%)
- Data Table on UK - Year-over-year growth 2023-2028 (%)
- 9.13 Market opportunity By Geographical Landscape
- Market opportunity By Geographical Landscape ($ billion)
- Data Tables on Market opportunity By Geographical Landscape ($ billion)
10 Drivers, Challenges, and Opportunity/Restraints
- 10.1 Market drivers
- 10.2 Market challenges
- 10.3 Impact of drivers and challenges
- Impact of drivers and challenges in 2023 and 2028
- 10.4 Market opportunities/restraints
11 Competitive Landscape
- 11.1 Overview
- 11.2 Competitive Landscape
- Overview on criticality of inputs and factors of differentiation
- 11.3 Landscape disruption
- Overview on factors of disruption
- 11.4 Industry risks
- Impact of key risks on business
12 Competitive Analysis
- 12.1 Companies profiled
- Companies covered
- 12.2 Market positioning of companies
- Matrix on companies position and classification
- 12.3 Bayerische Motoren Werke AG
- Bayerische Motoren Werke AG - Overview
- Bayerische Motoren Werke AG - Business segments
- Bayerische Motoren Werke AG - Key news
- Bayerische Motoren Werke AG - Key offerings
- Bayerische Motoren Werke AG - Segment focus
- 12.4 BYD Co. Ltd.
- BYD Co. Ltd. - Overview
- BYD Co. Ltd. - Business segments
- BYD Co. Ltd. - Key news
- BYD Co. Ltd. - Key offerings
- BYD Co. Ltd. - Segment focus
- 12.5 Ford Motor Co.
- Ford Motor Co. - Overview
- Ford Motor Co. - Business segments
- Ford Motor Co. - Key news
- Ford Motor Co. - Key offerings
- Ford Motor Co. - Segment focus
- 12.6 General Motors Co.
- General Motors Co. - Overview
- General Motors Co. - Business segments
- General Motors Co. - Key news
- General Motors Co. - Key offerings
- General Motors Co. - Segment focus
- 12.7 Honda Motor Co. Ltd.
- Honda Motor Co. Ltd. - Overview
- Honda Motor Co. Ltd. - Business segments
- Honda Motor Co. Ltd. - Key offerings
- Honda Motor Co. Ltd. - Segment focus
- 12.8 Hyundai Motor Co.
- Hyundai Motor Co. - Overview
- Hyundai Motor Co. - Business segments
- Hyundai Motor Co. - Key news
- Hyundai Motor Co. - Key offerings
- Hyundai Motor Co. - Segment focus
- 12.9 Isuzu Motors Ltd.
- Isuzu Motors Ltd. - Overview
- Isuzu Motors Ltd. - Product / Service
- Isuzu Motors Ltd. - Key news
- Isuzu Motors Ltd. - Key offerings
- 12.10 Mahindra and Mahindra Ltd.
- Mahindra and Mahindra Ltd. - Overview
- Mahindra and Mahindra Ltd. - Business segments
- Mahindra and Mahindra Ltd. - Key news
- Mahindra and Mahindra Ltd. - Key offerings
- Mahindra and Mahindra Ltd. - Segment focus
- 12.11 Mercedes Benz Group AG
- Mercedes Benz Group AG - Overview
- Mercedes Benz Group AG - Business segments
- Mercedes Benz Group AG - Key news
- Mercedes Benz Group AG - Key offerings
- Mercedes Benz Group AG - Segment focus
- 12.12 MG Motor India Pvt. Ltd.
- MG Motor India Pvt. Ltd. - Overview
- MG Motor India Pvt. Ltd. - Product / Service
- MG Motor India Pvt. Ltd. - Key offerings
- 12.13 Nissan Motor Co. Ltd.
- Nissan Motor Co. Ltd. - Overview
- Nissan Motor Co. Ltd. - Business segments
- Nissan Motor Co. Ltd. - Key news
- Nissan Motor Co. Ltd. - Key offerings
- Nissan Motor Co. Ltd. - Segment focus
- 12.14 Renault SAS
- Renault SAS - Overview
- Renault SAS - Product / Service
- Renault SAS - Key news
- Renault SAS - Key offerings
- 12.15 Stellantis NV
- Stellantis NV - Overview
- Stellantis NV - Business segments
- Stellantis NV - Key news
- Stellantis NV - Key offerings
- Stellantis NV - Segment focus
- 12.16 Toyota Motor Corp.
- Toyota Motor Corp. - Overview
- Toyota Motor Corp. - Business segments
- Toyota Motor Corp. - Key news
- Toyota Motor Corp. - Key offerings
- Toyota Motor Corp. - Segment focus
- 12.17 Volkswagen AG
- Volkswagen AG - Overview
- Volkswagen AG - Business segments
- Volkswagen AG - Key news
- Volkswagen AG - Key offerings
- Volkswagen AG - Segment focus
13 Appendix
- 13.1 Scope of the report
- 13.2 Inclusions and exclusions checklist
- Inclusions checklist
- Exclusions checklist
- 13.3 Currency conversion rates for US$
- Currency conversion rates for US$
- 13.4 Research methodology
- Research methodology
- 13.5 Data procurement
- Information sources
- 13.6 Data validation
- Data validation
- 13.7 Validation techniques employed for market sizing
- Validation techniques employed for market sizing
- 13.8 Data synthesis
- Data synthesis
- 13.9 360 degree market analysis
- 360 degree market analysis
- 13.10 List of abbreviations
- List of abbreviations
