|
|
市場調査レポート
商品コード
1558442
EV充電アダプターの世界市場、2024~2028年Global EV Charging Adapter Market 2024-2028 |
||||||
|
|||||||
カスタマイズ可能
|
|||||||

| EV充電アダプターの世界市場、2024~2028年 |
|
出版日: 2024年08月16日
発行: TechNavio
ページ情報: 英文 171 Pages
納期: 即納可能
|

全表示
- 概要
- 図表
- 目次
EV充電アダプター市場は2023~2028年に192億9,220万米ドル、予測期間中のCAGRは42.77%で成長すると予測されます。
当レポートでは、EV充電アダプター市場の全体的な分析、市場規模・予測、動向、成長促進要因、課題、約25のベンダーを網羅したベンダー分析などを掲載しています。
現在の市場シナリオ、最新動向と促進要因、市場環境全体に関する最新分析を提供しています。同市場は、税制優遇措置によるEV販売の増加、整備されたEV充電器インフラへの需要の押し上げ、政府による補助金や優遇措置、航続距離の問題に対処するための急速充電ユニットへの需要の高まりによって牽引されています。
| 市場範囲 | |
|---|---|
| 基準年 | 2024年 |
| 終了年 | 2028年 |
| 予測期間 | 2024~2028年 |
| 成長モメンタム | 加速 |
| 前年比[2024年] | 31.08% |
| CAGR | 42.77% |
| 増分額 | 192億9,220万米ドル |
本調査では、今後数年間におけるEV充電アダプター市場の成長を促進する主要理由の1つとして、充電時間の短縮への注力を挙げています。また、DC急速充電器アダプターの規格の多様性とEVエネルギー貯蔵システムのキャパシタが市場の大きな需要につながります。
目次
第1章 エグゼクティブサマリー
- 市場概要
第2章 市場情勢
- 市場エコシステム
- 市場の特徴
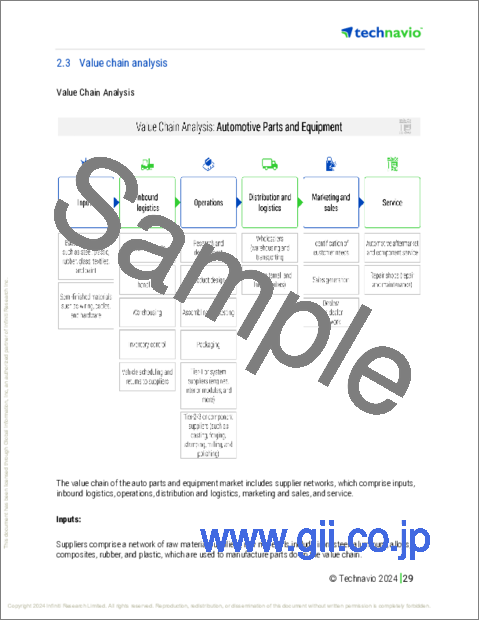
- バリューチェーン分析
第3章 市場規模の評価
- 市場の定義
- 市場セグメント分析
- 市場規模 2023年
- 市場の展望 2023~2028年
第4章 市場規模実績
- EV充電アダプターの世界市場 2018~2022年
- タイプ別セグメント分析 2018~2022年
- 用途別セグメント分析 2018~2022年
- 地域別セグメント分析 2018~2022年
- 国別セグメント分析 2018~2022年
第5章 ファイブフォース分析
- ファイブフォースの要約
- 買い手の交渉力
- 供給企業の交渉力
- 新規参入業者の脅威
- 代替品の脅威
- 競争の脅威
- 市況
第6章 市場セグメンテーション:タイプ別
- 市場セグメンテーション
- 比較:タイプ別
- 交流:市場規模と予測 2023~2028年
- 直流:市場規模と予測 2023~2028年
- 市場機会:タイプ別
第7章 市場セグメンテーション:用途別
- 市場セグメンテーション
- 比較:用途別
- 公共:市場規模と予測 2023~2028年
- 民間:市場規模と予測 2023~2028年
- 市場機会:用途別
第8章 顧客情勢
- 顧客情勢概要
第9章 地域別情勢
- 地域別セグメンテーション
- 比較:地域別
- アジア太平洋:市場規模と予測 2023~2028年
- 欧州:市場規模と予測 2023~2028年
- 北米:市場規模と予測 2023~2028年
- 南米:市場規模と予測 2023~2028年
- 中東・アフリカ:市場規模と予測 2023~2028年
- 中国:市場規模と予測 2023~2028年
- 米国:市場規模と予測 2023~2028年
- ノルウェー:市場規模と予測 2023~2028年
- 日本:市場規模と予測 2023~2028年
- ドイツ:市場規模と予測 2023~2028年
- 市場機会:地域情勢別
第10章 促進要因・課題・機会・抑制要因
- 市場促進要因
- 市場課題
- 促進要因と課題の影響
- 市場の機会・抑制要因
第11章 競合情勢
- 概要
- 競合情勢
- 混乱の状況
- 業界のリスク
第12章 競合分析
- 企業プロファイル
- 企業の市場ポジショニング
- ABB Ltd.
- Aptiv Plc
- ChargePoint Holdings Inc.
- Delta Electronics Inc.
- Eaton Corp. Plc
- Enel Spa
- EV Safe Charge Inc.
- FLO Services USA Inc.
- Kempower Oy
- Lectron EV
- Robert Bosch GmbH
- Schneider Electric SE
- Shanghai Mida EV Power Co. Ltd.
- Shanghai Zencar Industry Co Ltd
- Siemens AG
第13章 付録
Exhibits:
- Exhibits1: Executive Summary - Chart on Market Overview
- Exhibits2: Executive Summary - Data Table on Market Overview
- Exhibits3: Executive Summary - Chart on Global Market Characteristics
- Exhibits4: Executive Summary - Chart on Market By Geographical Landscape
- Exhibits5: Executive Summary - Chart on Market Segmentation by Type
- Exhibits6: Executive Summary - Chart on Market Segmentation by Application
- Exhibits7: Executive Summary - Chart on Incremental Growth
- Exhibits8: Executive Summary - Data Table on Incremental Growth
- Exhibits9: Executive Summary - Chart on Company Market Positioning
- Exhibits10: Parent Market
- Exhibits11: Data Table on - Parent Market
- Exhibits12: Market characteristics analysis
- Exhibits13: Value Chain Analysis
- Exhibits14: Offerings of companies included in the market definition
- Exhibits15: Market segments
- Exhibits16: Chart on Global - Market size and forecast 2023-2028 ($ million)
- Exhibits17: Data Table on Global - Market size and forecast 2023-2028 ($ million)
- Exhibits18: Chart on Global Market: Year-over-year growth 2023-2028 (%)
- Exhibits19: Data Table on Global Market: Year-over-year growth 2023-2028 (%)
- Exhibits20: Historic Market Size - Data Table on Global EV Charging Adapter Market 2018 - 2022 ($ million)
- Exhibits21: Historic Market Size - Type Segment 2018 - 2022 ($ million)
- Exhibits22: Historic Market Size - Application Segment 2018 - 2022 ($ million)
- Exhibits23: Historic Market Size - Geography Segment 2018 - 2022 ($ million)
- Exhibits24: Historic Market Size - Country Segment 2018 - 2022 ($ million)
- Exhibits25: Five forces analysis - Comparison between 2023 and 2028
- Exhibits26: Bargaining power of buyers - Impact of key factors 2023 and 2028
- Exhibits27: Bargaining power of suppliers - Impact of key factors in 2023 and 2028
- Exhibits28: Threat of new entrants - Impact of key factors in 2023 and 2028
- Exhibits29: Threat of substitutes - Impact of key factors in 2023 and 2028
- Exhibits30: Threat of rivalry - Impact of key factors in 2023 and 2028
- Exhibits31: Chart on Market condition - Five forces 2023 and 2028
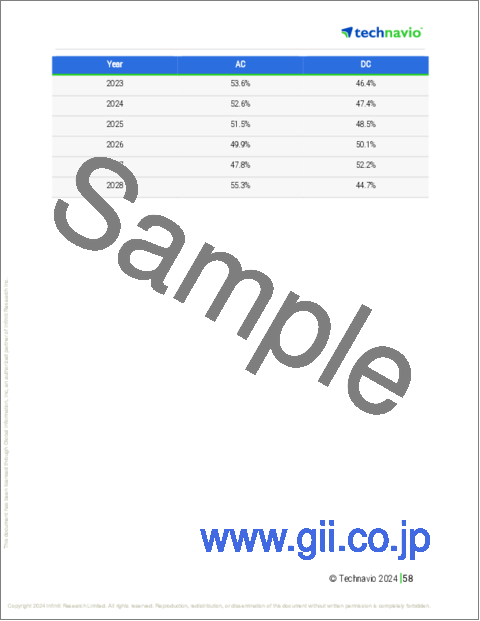
- Exhibits32: Chart on Type - Market share 2023-2028 (%)
- Exhibits33: Data Table on Type - Market share 2023-2028 (%)
- Exhibits34: Chart on Comparison by Type
- Exhibits35: Data Table on Comparison by Type
- Exhibits36: Chart on AC - Market size and forecast 2023-2028 ($ million)
- Exhibits37: Data Table on AC - Market size and forecast 2023-2028 ($ million)
- Exhibits38: Chart on AC - Year-over-year growth 2023-2028 (%)
- Exhibits39: Data Table on AC - Year-over-year growth 2023-2028 (%)
- Exhibits40: Chart on DC - Market size and forecast 2023-2028 ($ million)
- Exhibits41: Data Table on DC - Market size and forecast 2023-2028 ($ million)
- Exhibits42: Chart on DC - Year-over-year growth 2023-2028 (%)
- Exhibits43: Data Table on DC - Year-over-year growth 2023-2028 (%)
- Exhibits44: Market opportunity by Type ($ million)
- Exhibits45: Data Table on Market opportunity by Type ($ million)
- Exhibits46: Chart on Application - Market share 2023-2028 (%)
- Exhibits47: Data Table on Application - Market share 2023-2028 (%)
- Exhibits48: Chart on Comparison by Application
- Exhibits49: Data Table on Comparison by Application
- Exhibits50: Chart on Public - Market size and forecast 2023-2028 ($ million)
- Exhibits51: Data Table on Public - Market size and forecast 2023-2028 ($ million)
- Exhibits52: Chart on Public - Year-over-year growth 2023-2028 (%)
- Exhibits53: Data Table on Public - Year-over-year growth 2023-2028 (%)
- Exhibits54: Chart on Private - Market size and forecast 2023-2028 ($ million)
- Exhibits55: Data Table on Private - Market size and forecast 2023-2028 ($ million)
- Exhibits56: Chart on Private - Year-over-year growth 2023-2028 (%)
- Exhibits57: Data Table on Private - Year-over-year growth 2023-2028 (%)
- Exhibits58: Market opportunity by Application ($ million)
- Exhibits59: Data Table on Market opportunity by Application ($ million)
- Exhibits60: Analysis of price sensitivity, lifecycle, customer purchase basket, adoption rates, and purchase criteria
- Exhibits61: Chart on Market share By Geographical Landscape 2023-2028 (%)
- Exhibits62: Data Table on Market share By Geographical Landscape 2023-2028 (%)
- Exhibits63: Chart on Geographic comparison
- Exhibits64: Data Table on Geographic comparison
- Exhibits65: Chart on APAC - Market size and forecast 2023-2028 ($ million)
- Exhibits66: Data Table on APAC - Market size and forecast 2023-2028 ($ million)
- Exhibits67: Chart on APAC - Year-over-year growth 2023-2028 (%)
- Exhibits68: Data Table on APAC - Year-over-year growth 2023-2028 (%)
- Exhibits69: Chart on Europe - Market size and forecast 2023-2028 ($ million)
- Exhibits70: Data Table on Europe - Market size and forecast 2023-2028 ($ million)
- Exhibits71: Chart on Europe - Year-over-year growth 2023-2028 (%)
- Exhibits72: Data Table on Europe - Year-over-year growth 2023-2028 (%)
- Exhibits73: Chart on North America - Market size and forecast 2023-2028 ($ million)
- Exhibits74: Data Table on North America - Market size and forecast 2023-2028 ($ million)
- Exhibits75: Chart on North America - Year-over-year growth 2023-2028 (%)
- Exhibits76: Data Table on North America - Year-over-year growth 2023-2028 (%)
- Exhibits77: Chart on South America - Market size and forecast 2023-2028 ($ million)
- Exhibits78: Data Table on South America - Market size and forecast 2023-2028 ($ million)
- Exhibits79: Chart on South America - Year-over-year growth 2023-2028 (%)
- Exhibits80: Data Table on South America - Year-over-year growth 2023-2028 (%)
- Exhibits81: Chart on Middle East and Africa - Market size and forecast 2023-2028 ($ million)
- Exhibits82: Data Table on Middle East and Africa - Market size and forecast 2023-2028 ($ million)
- Exhibits83: Chart on Middle East and Africa - Year-over-year growth 2023-2028 (%)
- Exhibits84: Data Table on Middle East and Africa - Year-over-year growth 2023-2028 (%)
- Exhibits85: Chart on China - Market size and forecast 2023-2028 ($ million)
- Exhibits86: Data Table on China - Market size and forecast 2023-2028 ($ million)
- Exhibits87: Chart on China - Year-over-year growth 2023-2028 (%)
- Exhibits88: Data Table on China - Year-over-year growth 2023-2028 (%)
- Exhibits89: Chart on US - Market size and forecast 2023-2028 ($ million)
- Exhibits90: Data Table on US - Market size and forecast 2023-2028 ($ million)
- Exhibits91: Chart on US - Year-over-year growth 2023-2028 (%)
- Exhibits92: Data Table on US - Year-over-year growth 2023-2028 (%)
- Exhibits93: Chart on Norway - Market size and forecast 2023-2028 ($ million)
- Exhibits94: Data Table on Norway - Market size and forecast 2023-2028 ($ million)
- Exhibits95: Chart on Norway - Year-over-year growth 2023-2028 (%)
- Exhibits96: Data Table on Norway - Year-over-year growth 2023-2028 (%)
- Exhibits97: Chart on Japan - Market size and forecast 2023-2028 ($ million)
- Exhibits98: Data Table on Japan - Market size and forecast 2023-2028 ($ million)
- Exhibits99: Chart on Japan - Year-over-year growth 2023-2028 (%)
- Exhibits100: Data Table on Japan - Year-over-year growth 2023-2028 (%)
- Exhibits101: Chart on Germany - Market size and forecast 2023-2028 ($ million)
- Exhibits102: Data Table on Germany - Market size and forecast 2023-2028 ($ million)
- Exhibits103: Chart on Germany - Year-over-year growth 2023-2028 (%)
- Exhibits104: Data Table on Germany - Year-over-year growth 2023-2028 (%)
- Exhibits105: Market opportunity By Geographical Landscape ($ million)
- Exhibits106: Data Tables on Market opportunity By Geographical Landscape ($ million)
- Exhibits107: Impact of drivers and challenges in 2023 and 2028
- Exhibits108: Overview on criticality of inputs and factors of differentiation
- Exhibits109: Overview on factors of disruption
- Exhibits110: Impact of key risks on business
- Exhibits111: Companies covered
- Exhibits112: Matrix on companies position and classification
- Exhibits113: ABB Ltd. - Overview
- Exhibits114: ABB Ltd. - Business segments
- Exhibits115: ABB Ltd. - Key news
- Exhibits116: ABB Ltd. - Key offerings
- Exhibits117: ABB Ltd. - Segment focus
- Exhibits118: Aptiv Plc - Overview
- Exhibits119: Aptiv Plc - Business segments
- Exhibits120: Aptiv Plc - Key news
- Exhibits121: Aptiv Plc - Key offerings
- Exhibits122: Aptiv Plc - Segment focus
- Exhibits123: ChargePoint Holdings Inc. - Overview
- Exhibits124: ChargePoint Holdings Inc. - Product / Service
- Exhibits125: ChargePoint Holdings Inc. - Key news
- Exhibits126: ChargePoint Holdings Inc. - Key offerings
- Exhibits127: Delta Electronics Inc. - Overview
- Exhibits128: Delta Electronics Inc. - Business segments
- Exhibits129: Delta Electronics Inc. - Key news
- Exhibits130: Delta Electronics Inc. - Key offerings
- Exhibits131: Delta Electronics Inc. - Segment focus
- Exhibits132: Eaton Corp. Plc - Overview
- Exhibits133: Eaton Corp. Plc - Business segments
- Exhibits134: Eaton Corp. Plc - Key news
- Exhibits135: Eaton Corp. Plc - Key offerings
- Exhibits136: Eaton Corp. Plc - Segment focus
- Exhibits137: Enel Spa - Overview
- Exhibits138: Enel Spa - Product / Service
- Exhibits139: Enel Spa - Key news
- Exhibits140: Enel Spa - Key offerings
- Exhibits141: EV Safe Charge Inc. - Overview
- Exhibits142: EV Safe Charge Inc. - Product / Service
- Exhibits143: EV Safe Charge Inc. - Key offerings
- Exhibits144: FLO Services USA Inc. - Overview
- Exhibits145: FLO Services USA Inc. - Product / Service
- Exhibits146: FLO Services USA Inc. - Key news
- Exhibits147: FLO Services USA Inc. - Key offerings
- Exhibits148: Kempower Oy - Overview
- Exhibits149: Kempower Oy - Product / Service
- Exhibits150: Kempower Oy - Key offerings
- Exhibits151: Lectron EV - Overview
- Exhibits152: Lectron EV - Product / Service
- Exhibits153: Lectron EV - Key news
- Exhibits154: Lectron EV - Key offerings
- Exhibits155: Robert Bosch GmbH - Overview
- Exhibits156: Robert Bosch GmbH - Product / Service
- Exhibits157: Robert Bosch GmbH - Key news
- Exhibits158: Robert Bosch GmbH - Key offerings
- Exhibits159: Schneider Electric SE - Overview
- Exhibits160: Schneider Electric SE - Business segments
- Exhibits161: Schneider Electric SE - Key news
- Exhibits162: Schneider Electric SE - Key offerings
- Exhibits163: Schneider Electric SE - Segment focus
- Exhibits164: Shanghai Mida EV Power Co. Ltd. - Overview
- Exhibits165: Shanghai Mida EV Power Co. Ltd. - Product / Service
- Exhibits166: Shanghai Mida EV Power Co. Ltd. - Key offerings
- Exhibits167: Shanghai Zencar Industry Co Ltd - Overview
- Exhibits168: Shanghai Zencar Industry Co Ltd - Product / Service
- Exhibits169: Shanghai Zencar Industry Co Ltd - Key offerings
- Exhibits170: Siemens AG - Overview
- Exhibits171: Siemens AG - Business segments
- Exhibits172: Siemens AG - Key news
- Exhibits173: Siemens AG - Key offerings
- Exhibits174: Siemens AG - Segment focus
- Exhibits175: Inclusions checklist
- Exhibits176: Exclusions checklist
- Exhibits177: Currency conversion rates for US$
- Exhibits178: Research methodology
- Exhibits179: Information sources
- Exhibits180: Data validation
- Exhibits181: Validation techniques employed for market sizing
- Exhibits182: Data synthesis
- Exhibits183: 360 degree market analysis
- Exhibits184: List of abbreviations
The ev charging adapter market is forecasted to grow by USD 19292.2 mn during 2023-2028, accelerating at a CAGR of 42.77% during the forecast period. The report on the ev charging adapter market provides a holistic analysis, market size and forecast, trends, growth drivers, and challenges, as well as vendor analysis covering around 25 vendors.
The report offers an up-to-date analysis regarding the current market scenario, the latest trends and drivers, and the overall market environment. The market is driven by increasing ev sales through tax incentives pushing demand for well-built ev charger infrastructure, government subsidies and incentives, and rising demand for rapid charging units to combat range issues.
Technavio's ev charging adapter market is segmented as below:
| Market Scope | |
|---|---|
| Base Year | 2024 |
| End Year | 2028 |
| Series Year | 2024-2028 |
| Growth Momentum | Accelerate |
| YOY 2024 | 31.08% |
| CAGR | 42.77% |
| Incremental Value | $19292.2 mn |
By Type
- AC
- DC
By Application
- Public
- Private
By Geographical Landscape
- APAC
- Europe
- North America
- South America
- Middle East and Africa
This study identifies the focus on reducing charging time as one of the prime reasons driving the ev charging adapter market growth during the next few years. Also, diversity in dc fast charger adapter standards and ultracapacitors in ev energy storage system will lead to sizable demand in the market.
The report on the ev charging adapter market covers the following areas:
- Ev charging adapter market sizing
- Ev charging adapter market forecast
- Ev charging adapter market industry analysis
The robust vendor analysis is designed to help clients improve their market position, and in line with this, this report provides a detailed analysis of several leading ev charging adapter market vendors that include ABB Ltd., Aptiv Plc, ChargePoint Holdings Inc., CHONGQING SENKU MACHINERY IMP AND EXP Co. Ltd., Delta Electronics Inc., Eaton Corp. Plc, EDF Energy Holdings Ltd, Enel Spa, EV Safe Charge Inc., FLO Services USA Inc., Kempower Oy, Lectron EV, Leviton Manufacturing Co. Inc., Phihong USA Corp., Robert Bosch GmbH, Schneider Electric SE, Shanghai Mida EV Power Co. Ltd., Shanghai Zencar Industry Co Ltd, Siemens AG, and Webasto SE. Also, the ev charging adapter market analysis report includes information on upcoming trends and challenges that will influence market growth. This is to help companies strategize and leverage all forthcoming growth opportunities.
The study was conducted using an objective combination of primary and secondary information including inputs from key participants in the industry. The report contains a comprehensive market and vendor landscape in addition to an analysis of the key vendors.
The publisher presents a detailed picture of the market by the way of study, synthesis, and summation of data from multiple sources by an analysis of key parameters such as profit, pricing, competition, and promotions. It presents various market facets by identifying the key industry influencers. The data presented is comprehensive, reliable, and a result of extensive research - both primary and secondary. The market research reports provide a complete competitive landscape and an in-depth vendor selection methodology and analysis using qualitative and quantitative research to forecast the accurate market growth.
Table of Contents
1 Executive Summary
- 1.1 Market overview
- Executive Summary - Chart on Market Overview
- Executive Summary - Data Table on Market Overview
- Executive Summary - Chart on Global Market Characteristics
- Executive Summary - Chart on Market By Geographical Landscape
- Executive Summary - Chart on Market Segmentation by Type
- Executive Summary - Chart on Market Segmentation by Application
- Executive Summary - Chart on Incremental Growth
- Executive Summary - Data Table on Incremental Growth
- Executive Summary - Chart on Company Market Positioning
2 Market Landscape
- 2.1 Market ecosystem
- Parent Market
- Data Table on - Parent Market
- 2.2 Market characteristics
- Market characteristics analysis
- 2.3 Value chain analysis
- Value Chain Analysis
3 Market Sizing
- 3.1 Market definition
- Offerings of companies included in the market definition
- 3.2 Market segment analysis
- Market segments
- 3.3 Market size 2023
- 3.4 Market outlook: Forecast for 2023-2028
- Chart on Global - Market size and forecast 2023-2028 ($ million)
- Data Table on Global - Market size and forecast 2023-2028 ($ million)
- Chart on Global Market: Year-over-year growth 2023-2028 (%)
- Data Table on Global Market: Year-over-year growth 2023-2028 (%)
4 Historic Market Size
- 4.1 Global EV Charging Adapter Market 2018 - 2022
- Historic Market Size - Data Table on Global EV Charging Adapter Market 2018 - 2022 ($ million)
- 4.2 Type segment analysis 2018 - 2022
- Historic Market Size - Type Segment 2018 - 2022 ($ million)
- 4.3 Application segment analysis 2018 - 2022
- Historic Market Size - Application Segment 2018 - 2022 ($ million)
- 4.4 Geography segment analysis 2018 - 2022
- Historic Market Size - Geography Segment 2018 - 2022 ($ million)
- 4.5 Country segment analysis 2018 - 2022
- Historic Market Size - Country Segment 2018 - 2022 ($ million)
5 Five Forces Analysis
- 5.1 Five forces summary
- Five forces analysis - Comparison between 2023 and 2028
- 5.2 Bargaining power of buyers
- Bargaining power of buyers - Impact of key factors 2023 and 2028
- 5.3 Bargaining power of suppliers
- Bargaining power of suppliers - Impact of key factors in 2023 and 2028
- 5.4 Threat of new entrants
- Threat of new entrants - Impact of key factors in 2023 and 2028
- 5.5 Threat of substitutes
- Threat of substitutes - Impact of key factors in 2023 and 2028
- 5.6 Threat of rivalry
- Threat of rivalry - Impact of key factors in 2023 and 2028
- 5.7 Market condition
- Chart on Market condition - Five forces 2023 and 2028
6 Market Segmentation by Type
- 6.1 Market segments
- Chart on Type - Market share 2023-2028 (%)
- Data Table on Type - Market share 2023-2028 (%)
- 6.2 Comparison by Type
- Chart on Comparison by Type
- Data Table on Comparison by Type
- 6.3 AC - Market size and forecast 2023-2028
- Chart on AC - Market size and forecast 2023-2028 ($ million)
- Data Table on AC - Market size and forecast 2023-2028 ($ million)
- Chart on AC - Year-over-year growth 2023-2028 (%)
- Data Table on AC - Year-over-year growth 2023-2028 (%)
- 6.4 DC - Market size and forecast 2023-2028
- Chart on DC - Market size and forecast 2023-2028 ($ million)
- Data Table on DC - Market size and forecast 2023-2028 ($ million)
- Chart on DC - Year-over-year growth 2023-2028 (%)
- Data Table on DC - Year-over-year growth 2023-2028 (%)
- 6.5 Market opportunity by Type
- Market opportunity by Type ($ million)
- Data Table on Market opportunity by Type ($ million)
7 Market Segmentation by Application
- 7.1 Market segments
- Chart on Application - Market share 2023-2028 (%)
- Data Table on Application - Market share 2023-2028 (%)
- 7.2 Comparison by Application
- Chart on Comparison by Application
- Data Table on Comparison by Application
- 7.3 Public - Market size and forecast 2023-2028
- Chart on Public - Market size and forecast 2023-2028 ($ million)
- Data Table on Public - Market size and forecast 2023-2028 ($ million)
- Chart on Public - Year-over-year growth 2023-2028 (%)
- Data Table on Public - Year-over-year growth 2023-2028 (%)
- 7.4 Private - Market size and forecast 2023-2028
- Chart on Private - Market size and forecast 2023-2028 ($ million)
- Data Table on Private - Market size and forecast 2023-2028 ($ million)
- Chart on Private - Year-over-year growth 2023-2028 (%)
- Data Table on Private - Year-over-year growth 2023-2028 (%)
- 7.5 Market opportunity by Application
- Market opportunity by Application ($ million)
- Data Table on Market opportunity by Application ($ million)
8 Customer Landscape
- 8.1 Customer landscape overview
- Analysis of price sensitivity, lifecycle, customer purchase basket, adoption rates, and purchase criteria
9 Geographic Landscape
- 9.1 Geographic segmentation
- Chart on Market share By Geographical Landscape 2023-2028 (%)
- Data Table on Market share By Geographical Landscape 2023-2028 (%)
- 9.2 Geographic comparison
- Chart on Geographic comparison
- Data Table on Geographic comparison
- 9.3 APAC - Market size and forecast 2023-2028
- Chart on APAC - Market size and forecast 2023-2028 ($ million)
- Data Table on APAC - Market size and forecast 2023-2028 ($ million)
- Chart on APAC - Year-over-year growth 2023-2028 (%)
- Data Table on APAC - Year-over-year growth 2023-2028 (%)
- 9.4 Europe - Market size and forecast 2023-2028
- Chart on Europe - Market size and forecast 2023-2028 ($ million)
- Data Table on Europe - Market size and forecast 2023-2028 ($ million)
- Chart on Europe - Year-over-year growth 2023-2028 (%)
- Data Table on Europe - Year-over-year growth 2023-2028 (%)
- 9.5 North America - Market size and forecast 2023-2028
- Chart on North America - Market size and forecast 2023-2028 ($ million)
- Data Table on North America - Market size and forecast 2023-2028 ($ million)
- Chart on North America - Year-over-year growth 2023-2028 (%)
- Data Table on North America - Year-over-year growth 2023-2028 (%)
- 9.6 South America - Market size and forecast 2023-2028
- Chart on South America - Market size and forecast 2023-2028 ($ million)
- Data Table on South America - Market size and forecast 2023-2028 ($ million)
- Chart on South America - Year-over-year growth 2023-2028 (%)
- Data Table on South America - Year-over-year growth 2023-2028 (%)
- 9.7 Middle East and Africa - Market size and forecast 2023-2028
- Chart on Middle East and Africa - Market size and forecast 2023-2028 ($ million)
- Data Table on Middle East and Africa - Market size and forecast 2023-2028 ($ million)
- Chart on Middle East and Africa - Year-over-year growth 2023-2028 (%)
- Data Table on Middle East and Africa - Year-over-year growth 2023-2028 (%)
- 9.8 China - Market size and forecast 2023-2028
- Chart on China - Market size and forecast 2023-2028 ($ million)
- Data Table on China - Market size and forecast 2023-2028 ($ million)
- Chart on China - Year-over-year growth 2023-2028 (%)
- Data Table on China - Year-over-year growth 2023-2028 (%)
- 9.9 US - Market size and forecast 2023-2028
- Chart on US - Market size and forecast 2023-2028 ($ million)
- Data Table on US - Market size and forecast 2023-2028 ($ million)
- Chart on US - Year-over-year growth 2023-2028 (%)
- Data Table on US - Year-over-year growth 2023-2028 (%)
- 9.10 Norway - Market size and forecast 2023-2028
- Chart on Norway - Market size and forecast 2023-2028 ($ million)
- Data Table on Norway - Market size and forecast 2023-2028 ($ million)
- Chart on Norway - Year-over-year growth 2023-2028 (%)
- Data Table on Norway - Year-over-year growth 2023-2028 (%)
- 9.11 Japan - Market size and forecast 2023-2028
- Chart on Japan - Market size and forecast 2023-2028 ($ million)
- Data Table on Japan - Market size and forecast 2023-2028 ($ million)
- Chart on Japan - Year-over-year growth 2023-2028 (%)
- Data Table on Japan - Year-over-year growth 2023-2028 (%)
- 9.12 Germany - Market size and forecast 2023-2028
- Chart on Germany - Market size and forecast 2023-2028 ($ million)
- Data Table on Germany - Market size and forecast 2023-2028 ($ million)
- Chart on Germany - Year-over-year growth 2023-2028 (%)
- Data Table on Germany - Year-over-year growth 2023-2028 (%)
- 9.13 Market opportunity By Geographical Landscape
- Market opportunity By Geographical Landscape ($ million)
- Data Tables on Market opportunity By Geographical Landscape ($ million)
10 Drivers, Challenges, and Opportunity/Restraints
- 10.1 Market drivers
- 10.2 Market challenges
- 10.3 Impact of drivers and challenges
- Impact of drivers and challenges in 2023 and 2028
- 10.4 Market opportunities/restraints
11 Competitive Landscape
- 11.1 Overview
- 11.2 Competitive Landscape
- Overview on criticality of inputs and factors of differentiation
- 11.3 Landscape disruption
- Overview on factors of disruption
- 11.4 Industry risks
- Impact of key risks on business
12 Competitive Analysis
- 12.1 Companies profiled
- Companies covered
- 12.2 Market positioning of companies
- Matrix on companies position and classification
- 12.3 ABB Ltd.
- ABB Ltd. - Overview
- ABB Ltd. - Business segments
- ABB Ltd. - Key news
- ABB Ltd. - Key offerings
- ABB Ltd. - Segment focus
- 12.4 Aptiv Plc
- Aptiv Plc - Overview
- Aptiv Plc - Business segments
- Aptiv Plc - Key news
- Aptiv Plc - Key offerings
- Aptiv Plc - Segment focus
- 12.5 ChargePoint Holdings Inc.
- ChargePoint Holdings Inc. - Overview
- ChargePoint Holdings Inc. - Product / Service
- ChargePoint Holdings Inc. - Key news
- ChargePoint Holdings Inc. - Key offerings
- 12.6 Delta Electronics Inc.
- Delta Electronics Inc. - Overview
- Delta Electronics Inc. - Business segments
- Delta Electronics Inc. - Key news
- Delta Electronics Inc. - Key offerings
- Delta Electronics Inc. - Segment focus
- 12.7 Eaton Corp. Plc
- Eaton Corp. Plc - Overview
- Eaton Corp. Plc - Business segments
- Eaton Corp. Plc - Key news
- Eaton Corp. Plc - Key offerings
- Eaton Corp. Plc - Segment focus
- 12.8 Enel Spa
- Enel Spa - Overview
- Enel Spa - Product / Service
- Enel Spa - Key news
- Enel Spa - Key offerings
- 12.9 EV Safe Charge Inc.
- EV Safe Charge Inc. - Overview
- EV Safe Charge Inc. - Product / Service
- EV Safe Charge Inc. - Key offerings
- 12.10 FLO Services USA Inc.
- FLO Services USA Inc. - Overview
- FLO Services USA Inc. - Product / Service
- FLO Services USA Inc. - Key news
- FLO Services USA Inc. - Key offerings
- 12.11 Kempower Oy
- Kempower Oy - Overview
- Kempower Oy - Product / Service
- Kempower Oy - Key offerings
- 12.12 Lectron EV
- Lectron EV - Overview
- Lectron EV - Product / Service
- Lectron EV - Key news
- Lectron EV - Key offerings
- 12.13 Robert Bosch GmbH
- Robert Bosch GmbH - Overview
- Robert Bosch GmbH - Product / Service
- Robert Bosch GmbH - Key news
- Robert Bosch GmbH - Key offerings
- 12.14 Schneider Electric SE
- Schneider Electric SE - Overview
- Schneider Electric SE - Business segments
- Schneider Electric SE - Key news
- Schneider Electric SE - Key offerings
- Schneider Electric SE - Segment focus
- 12.15 Shanghai Mida EV Power Co. Ltd.
- Shanghai Mida EV Power Co. Ltd. - Overview
- Shanghai Mida EV Power Co. Ltd. - Product / Service
- Shanghai Mida EV Power Co. Ltd. - Key offerings
- 12.16 Shanghai Zencar Industry Co Ltd
- Shanghai Zencar Industry Co Ltd - Overview
- Shanghai Zencar Industry Co Ltd - Product / Service
- Shanghai Zencar Industry Co Ltd - Key offerings
- 12.17 Siemens AG
- Siemens AG - Overview
- Siemens AG - Business segments
- Siemens AG - Key news
- Siemens AG - Key offerings
- Siemens AG - Segment focus
13 Appendix
- 13.1 Scope of the report
- 13.2 Inclusions and exclusions checklist
- Inclusions checklist
- Exclusions checklist
- 13.3 Currency conversion rates for US$
- Currency conversion rates for US$
- 13.4 Research methodology
- Research methodology
- 13.5 Data procurement
- Information sources
- 13.6 Data validation
- Data validation
- 13.7 Validation techniques employed for market sizing
- Validation techniques employed for market sizing
- 13.8 Data synthesis
- Data synthesis
- 360 degree market analysis
- 360 degree market analysis
- 13.10 List of abbreviations
- List of abbreviations
