|
|
市場調査レポート
商品コード
1975397
空港非航空収益の世界市場 2026年~2030年Global Airport Non-Aeronautical Revenue Market 2026-2030 |
||||||

|
|||||||
カスタマイズ可能
|
|||||||


| 空港非航空収益の世界市場 2026年~2030年 |
|
出版日: 2026年03月09日
発行: TechNavio
ページ情報: 英文 301 Pages
納期: 即納可能
|

概要
世界の空港非航空収益市場は、2025年から2030年の間に480億580万米ドルの成長が見込まれ、予測期間中のCAGRは8.5%と予測されています。
本報告書では、世界の空港非航空収益市場に関する包括的な分析、市場規模と予測、動向、成長要因、課題に加え、約25社のベンダー分析を提供しております。
本レポートは、現在の市場状況、最新の動向と促進要因、市場環境全般に関する最新の分析を提供します。市場は、旅客数の増加と世界の接続性の向上、戦略的な商業の多様化とプレミアム化、旅客中心の小売エコシステムの成長によって牽引されています。
本調査は、業界の主要関係者からの情報を含む一次情報と二次情報を客観的に組み合わせて実施されました。本レポートには、主要企業の分析に加え、包括的な市場規模データ、地域別分析を伴うセグメント、ベンダー情勢が含まれています。レポートには過去データと予測データが記載されています。
| 市場範囲 | |
|---|---|
| 基準年 | 2026年 |
| 終了年 | 2030年 |
| 予測期間 | 2026-2030 |
| 成長モメンタム | 加速 |
| 前年比2026年 | 8.2% |
| CAGR | 8.5% |
| 増分額 | 480億580万米ドル |
本調査では、今後数年間における世界の空港非航空収益市場成長を牽引する主要要因の一つとして、空港都市およびエアロトロポリスモデルの拡大を挙げております。また、オムニチャネル小売およびデジタルコマースプラットフォームの統合、プレミアム化、体験型ラグジュアリーサービスの台頭により、市場において相当な需要が見込まれます。
目次
第1章 エグゼクティブサマリー
第2章 Technavio分析
- 価格・ライフサイクル・顧客購入バスケット・採用率・購入基準の分析
- インプットの重要性と差別化の要因
- 混乱の要因
- 促進要因と課題の影響
第3章 市場情勢
- 市場エコシステム
- 市場の特徴
- バリューチェーン分析
第4章 市場規模
- 市場の定義
- 市場セグメント分析
- 市場規模、2025年
- 市場の見通し、2025年~2030年
第5章 市場規模実績
- 空港非航空収益の世界市場、2020年~2024年
- サービスセグメント分析、2020年~2024年
- 事業セグメント分析、2020年~2024年
- タイプセグメント分析、2020年~2024年
- 地域別セグメント分析、2020年~2024年
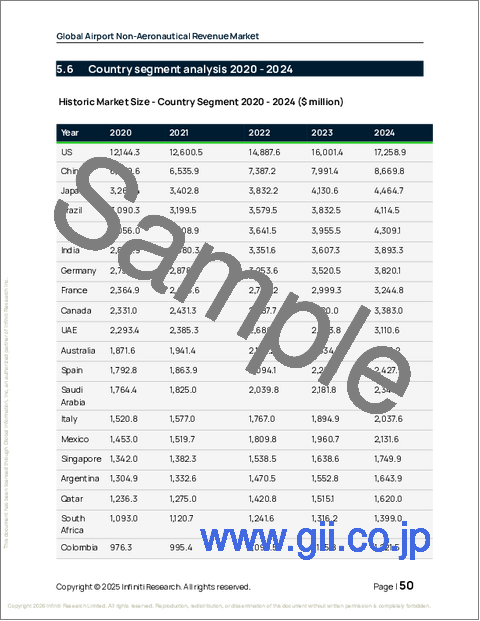
- 国別セグメント分析、2020年~2024年
第6章 定性分析
- AIが空港非航空収益の世界市場
- 地政学的紛争が及ぼす影響空港非航空収益の世界市場
第7章 ファイブフォース分析
- ファイブフォースの要約
- 買い手の交渉力
- 供給企業の交渉力
- 新規参入業者の脅威
- 代替品の脅威
- 競争の脅威
- 市況
第8章 市場セグメンテーション:サービス別
- 比較:サービス別
- コンセッション事業者
- 駐車場およびレンタカー
- 土地賃貸
- 航空会社によるターミナル賃料
- その他
- 市場機会:サービス別
第9章 市場セグメンテーション:事業セグメント別
- 比較:事業セグメント別
- 商業開発
- 広告
- 市場機会:事業セグメント別
第10章 市場セグメンテーション:タイプ別
- 比較:タイプ別
- 大規模空港
- 中規模空港
- 小規模空港
- 市場機会:タイプ別
第11章 顧客情勢
第12章 地域別情勢
- 地域別セグメンテーション
- 地域別比較
- アジア太平洋
- 中国
- 日本
- インド
- オーストラリア
- シンガポール
- インドネシア
- 北米
- 米国
- カナダ
- メキシコ
- 欧州
- 英国
- ドイツ
- フランス
- スペイン
- イタリア
- オランダ
- 中東・アフリカ
- アラブ首長国連邦
- サウジアラビア
- カタール
- 南アフリカ
- エジプト
- 南米
- ブラジル
- アルゼンチン
- コロンビア
- 市場機会:地域別
第13章 促進要因・課題・機会
- 市場促進要因
- 市場の課題
- 促進要因と課題の影響
- 市場機会
第14章 競合情勢
- 概要
- 競合情勢
- 混乱の状況
- 業界のリスク
第15章 競合分析
- 企業プロファイル
- 企業ランキング指標
- 企業の市場ポジショニング
- Aena S.M.E. SA
- Aeroports de Paris SA
- Airports of Thailand PCL
- Copenhagen Airports AS
- Dubai Airports Co.
- Flughafen Munchen GmbH
- Flughafen Zurich AG
- Fraport AG
- GMR Airports Infrastructure Ltd.
- IGA Istanbul Airport
- Japan Airport Terminal Co. Ltd.
- Korea Airports Corp.
- Malaysia Airports Holdings
- Royal Schiphol Group N.V.
- Vinci SA
