|
|
市場調査レポート
商品コード
1516999
軍用空中給油タンカーの世界市場 2024-2028Global military aerial refueling tanker market 2024-2028 |
||||||
|
|||||||
カスタマイズ可能
|
|||||||


| 軍用空中給油タンカーの世界市場 2024-2028 |
|
出版日: 2024年05月17日
発行: TechNavio
ページ情報: 英文 171 Pages
納期: 即納可能
|

全表示
- 概要
- 図表
- 目次
軍用空中給油タンカー市場は2023-2028年に42億1,810万米ドル、予測期間中のCAGRは7.01%で成長すると予測されます。
当レポートでは、軍用空中給油タンカー市場の全体的な分析、市場規模・予測、動向、成長促進要因、課題、約25のベンダーを網羅したベンダー分析などを掲載しています。
現在の市場シナリオ、最新動向と促進要因、市場環境全体に関する最新分析を提供しています。市場は、共同開発/買収アプローチ、次世代長距離攻撃プラットフォームへのシフト、性能を最適化するための搭載燃料量の測定などが牽引しています。
| 市場範囲 | |
|---|---|
| 基準年 | 2024 |
| 終了年 | 2028 |
| 予測期間 | 2024-2028 |
| 成長モメンタム | 加速 |
| 前年比2024年 | 6.43% |
| CAGR | 7.01% |
| 増分額 | 42億1,810万米ドル |
本調査では、今後数年間の軍用空中給油タンカー市場成長を牽引する主な要因の1つとして、多層防空ネットワークへの投資拡大を挙げています。また、VTOL(垂直離着陸機)空中給油タンカーの市場開発と積層造形の導入は、市場の大きな需要につながります。
目次
第1章 エグゼクティブサマリー
- 市場概要
第2章 市場情勢
- 市場エコシステム
- 市場の特徴
- バリューチェーン分析
第3章 市場規模の評価
- 市場の定義
- 市場セグメント分析
- 市場規模 2023
- 市場の見通し 2023-2028
第4章 市場規模実績
- 世界軍用空中給油タンカー市場 2018-2022
- 技術別セグメント分析 2018-2022
- タイプ別セグメント分析 2018-2022
- 地域別セグメント分析 2018-2022
- 国別セグメント分析 2018-2022
第5章 ファイブフォース分析
- ファイブフォースの要約
- 買い手の交渉力
- 供給企業の交渉力
- 新規参入業者の脅威
- 代替品の脅威
- 競争の脅威
- 市況
第6章 市場セグメンテーション:技術別
- 市場セグメンテーション
- 比較:技術別
- プローブ&ドローグ:市場規模と予測 2023-2028
- ブーム&レセプタクル:市場規模と予測 2023-2028
- 市場機会:技術別
第7章 市場セグメンテーション:タイプ別
- 市場セグメンテーション
- 比較:タイプ別
- 有人:市場規模と予測 2023-2028
- 無人:市場規模と予測 2023-2028
- 市場機会:タイプ別
第8章 顧客情勢
- 顧客情勢の概要
第9章 地域別情勢
- 地域別セグメンテーション
- 地域別比較
- 北米:市場規模と予測 2023-2028
- アジア太平洋:市場規模と予測 2023-2028
- 欧州:市場規模と予測 2023-2028
- 中東・アフリカ:市場規模と予測 2023-2028
- 南米:市場規模と予測 2023-2028
- 米国:市場規模と予測 2023-2028
- 中国:市場規模と予測 2023-2028
- フランス:市場規模と予測 2023-2028
- 英国:市場規模と予測 2023-2028
- インド:市場規模と予測 2023-2028
- 市場機会:地域情勢別
第10章 促進要因・課題・機会・抑制要因
- 市場促進要因
- 市場の課題
- 促進要因と課題の影響
- 市場の機会・抑制要因
第11章 競合情勢
- 概要
- 競合情勢
- 混乱の状況
- 業界のリスク
第12章 競合分析
- 企業プロファイル
- 企業の市場ポジショニング
- Airbus SE
- BAE Systems Plc
- Bandak Aviation Inc.
- Cobham Ltd.
- Dassault Aviation SA
- Draken International, LLC
- Eaton Corp. Plc
- Embraer SA
- General Electric Co.
- Israel Aerospace Industries Ltd.
- Liebherr International Deutschland GmbH
- Lockheed Martin Corp.
- Marshall of Cambridge Holdings Ltd.
- Rostec
- The Boeing Co.
第13章 付録
Exhibits:
- Exhibits1: Executive Summary - Chart on Market Overview
- Exhibits2: Executive Summary - Data Table on Market Overview
- Exhibits3: Executive Summary - Chart on Global Market Characteristics
- Exhibits4: Executive Summary - Chart on Market By Geographical Landscape
- Exhibits5: Executive Summary - Chart on Market Segmentation by Technology
- Exhibits6: Executive Summary - Chart on Market Segmentation by Type
- Exhibits7: Executive Summary - Chart on Incremental Growth
- Exhibits8: Executive Summary - Data Table on Incremental Growth
- Exhibits9: Executive Summary - Chart on Company Market Positioning
- Exhibits10: Parent Market
- Exhibits11: Data Table on - Parent Market
- Exhibits12: Market characteristics analysis
- Exhibits13: Value Chain Analysis
- Exhibits14: Offerings of companies included in the market definition
- Exhibits15: Market segments
- Exhibits16: Chart on Global - Market size and forecast 2023-2028 ($ million)
- Exhibits17: Data Table on Global - Market size and forecast 2023-2028 ($ million)
- Exhibits18: Chart on Global Market: Year-over-year growth 2023-2028 (%)
- Exhibits19: Data Table on Global Market: Year-over-year growth 2023-2028 (%)
- Exhibits20: Historic Market Size - Data Table on Global Military Aerial Refueling Tanker Market 2018 - 2022 ($ million)
- Exhibits21: Historic Market Size - Technology Segment 2018 - 2022 ($ million)
- Exhibits22: Historic Market Size - Type Segment 2018 - 2022 ($ million)
- Exhibits23: Historic Market Size - Geography Segment 2018 - 2022 ($ million)
- Exhibits24: Historic Market Size - Country Segment 2018 - 2022 ($ million)
- Exhibits25: Five forces analysis - Comparison between 2023 and 2028
- Exhibits26: Bargaining power of buyers - Impact of key factors 2023 and 2028
- Exhibits27: Bargaining power of suppliers - Impact of key factors in 2023 and 2028
- Exhibits28: Threat of new entrants - Impact of key factors in 2023 and 2028
- Exhibits29: Threat of substitutes - Impact of key factors in 2023 and 2028
- Exhibits30: Threat of rivalry - Impact of key factors in 2023 and 2028
- Exhibits31: Chart on Market condition - Five forces 2023 and 2028
- Exhibits32: Chart on Technology - Market share 2023-2028 (%)
- Exhibits33: Data Table on Technology - Market share 2023-2028 (%)
- Exhibits34: Chart on Comparison by Technology
- Exhibits35: Data Table on Comparison by Technology
- Exhibits36: Chart on Probe-and-drogue - Market size and forecast 2023-2028 ($ million)
- Exhibits37: Data Table on Probe-and-drogue - Market size and forecast 2023-2028 ($ million)
- Exhibits38: Chart on Probe-and-drogue - Year-over-year growth 2023-2028 (%)
- Exhibits39: Data Table on Probe-and-drogue - Year-over-year growth 2023-2028 (%)
- Exhibits40: Chart on Boom-and-receptacle - Market size and forecast 2023-2028 ($ million)
- Exhibits41: Data Table on Boom-and-receptacle - Market size and forecast 2023-2028 ($ million)
- Exhibits42: Chart on Boom-and-receptacle - Year-over-year growth 2023-2028 (%)
- Exhibits43: Data Table on Boom-and-receptacle - Year-over-year growth 2023-2028 (%)
- Exhibits44: Market opportunity by Technology ($ million)
- Exhibits45: Data Table on Market opportunity by Technology ($ million)
- Exhibits46: Chart on Type - Market share 2023-2028 (%)
- Exhibits47: Data Table on Type - Market share 2023-2028 (%)
- Exhibits48: Chart on Comparison by Type
- Exhibits49: Data Table on Comparison by Type
- Exhibits50: Chart on Manned - Market size and forecast 2023-2028 ($ million)
- Exhibits51: Data Table on Manned - Market size and forecast 2023-2028 ($ million)
- Exhibits52: Chart on Manned - Year-over-year growth 2023-2028 (%)
- Exhibits53: Data Table on Manned - Year-over-year growth 2023-2028 (%)
- Exhibits54: Chart on Unmanned - Market size and forecast 2023-2028 ($ million)
- Exhibits55: Data Table on Unmanned - Market size and forecast 2023-2028 ($ million)
- Exhibits56: Chart on Unmanned - Year-over-year growth 2023-2028 (%)
- Exhibits57: Data Table on Unmanned - Year-over-year growth 2023-2028 (%)
- Exhibits58: Market opportunity by Type ($ million)
- Exhibits59: Data Table on Market opportunity by Type ($ million)
- Exhibits60: Analysis of price sensitivity, lifecycle, customer purchase basket, adoption rates, and purchase criteria
- Exhibits61: Chart on Market share By Geographical Landscape 2023-2028 (%)
- Exhibits62: Data Table on Market share By Geographical Landscape 2023-2028 (%)
- Exhibits63: Chart on Geographic comparison
- Exhibits64: Data Table on Geographic comparison
- Exhibits65: Chart on North America - Market size and forecast 2023-2028 ($ million)
- Exhibits66: Data Table on North America - Market size and forecast 2023-2028 ($ million)
- Exhibits67: Chart on North America - Year-over-year growth 2023-2028 (%)
- Exhibits68: Data Table on North America - Year-over-year growth 2023-2028 (%)
- Exhibits69: Chart on APAC - Market size and forecast 2023-2028 ($ million)
- Exhibits70: Data Table on APAC - Market size and forecast 2023-2028 ($ million)
- Exhibits71: Chart on APAC - Year-over-year growth 2023-2028 (%)
- Exhibits72: Data Table on APAC - Year-over-year growth 2023-2028 (%)
- Exhibits73: Chart on Europe - Market size and forecast 2023-2028 ($ million)
- Exhibits74: Data Table on Europe - Market size and forecast 2023-2028 ($ million)
- Exhibits75: Chart on Europe - Year-over-year growth 2023-2028 (%)
- Exhibits76: Data Table on Europe - Year-over-year growth 2023-2028 (%)
- Exhibits77: Chart on Middle East and Africa - Market size and forecast 2023-2028 ($ million)
- Exhibits78: Data Table on Middle East and Africa - Market size and forecast 2023-2028 ($ million)
- Exhibits79: Chart on Middle East and Africa - Year-over-year growth 2023-2028 (%)
- Exhibits80: Data Table on Middle East and Africa - Year-over-year growth 2023-2028 (%)
- Exhibits81: Chart on South America - Market size and forecast 2023-2028 ($ million)
- Exhibits82: Data Table on South America - Market size and forecast 2023-2028 ($ million)
- Exhibits83: Chart on South America - Year-over-year growth 2023-2028 (%)
- Exhibits84: Data Table on South America - Year-over-year growth 2023-2028 (%)
- Exhibits85: Chart on US - Market size and forecast 2023-2028 ($ million)
- Exhibits86: Data Table on US - Market size and forecast 2023-2028 ($ million)
- Exhibits87: Chart on US - Year-over-year growth 2023-2028 (%)
- Exhibits88: Data Table on US - Year-over-year growth 2023-2028 (%)
- Exhibits89: Chart on China - Market size and forecast 2023-2028 ($ million)
- Exhibits90: Data Table on China - Market size and forecast 2023-2028 ($ million)
- Exhibits91: Chart on China - Year-over-year growth 2023-2028 (%)
- Exhibits92: Data Table on China - Year-over-year growth 2023-2028 (%)
- Exhibits93: Chart on France - Market size and forecast 2023-2028 ($ million)
- Exhibits94: Data Table on France - Market size and forecast 2023-2028 ($ million)
- Exhibits95: Chart on France - Year-over-year growth 2023-2028 (%)
- Exhibits96: Data Table on France - Year-over-year growth 2023-2028 (%)
- Exhibits97: Chart on UK - Market size and forecast 2023-2028 ($ million)
- Exhibits98: Data Table on UK - Market size and forecast 2023-2028 ($ million)
- Exhibits99: Chart on UK - Year-over-year growth 2023-2028 (%)
- Exhibits100: Data Table on UK - Year-over-year growth 2023-2028 (%)
- Exhibits101: Chart on India - Market size and forecast 2023-2028 ($ million)
- Exhibits102: Data Table on India - Market size and forecast 2023-2028 ($ million)
- Exhibits103: Chart on India - Year-over-year growth 2023-2028 (%)
- Exhibits104: Data Table on India - Year-over-year growth 2023-2028 (%)
- Exhibits105: Market opportunity By Geographical Landscape ($ million)
- Exhibits106: Data Tables on Market opportunity By Geographical Landscape ($ million)
- Exhibits107: Impact of drivers and challenges in 2023 and 2028
- Exhibits108: Overview on criticality of inputs and factors of differentiation
- Exhibits109: Overview on factors of disruption
- Exhibits110: Impact of key risks on business
- Exhibits111: Companies covered
- Exhibits112: Matrix on companies position and classification
- Exhibits113: Airbus SE - Overview
- Exhibits114: Airbus SE - Business segments
- Exhibits115: Airbus SE - Key news
- Exhibits116: Airbus SE - Key offerings
- Exhibits117: Airbus SE - Segment focus
- Exhibits118: BAE Systems Plc - Overview
- Exhibits119: BAE Systems Plc - Business segments
- Exhibits120: BAE Systems Plc - Key offerings
- Exhibits121: BAE Systems Plc - Segment focus
- Exhibits122: Bandak Aviation Inc. - Overview
- Exhibits123: Bandak Aviation Inc. - Product / Service
- Exhibits124: Bandak Aviation Inc. - Key offerings
- Exhibits125: Cobham Ltd. - Overview
- Exhibits126: Cobham Ltd. - Product / Service
- Exhibits127: Cobham Ltd. - Key offerings
- Exhibits128: Dassault Aviation SA - Overview
- Exhibits129: Dassault Aviation SA - Product / Service
- Exhibits130: Dassault Aviation SA - Key offerings
- Exhibits131: Draken International, LLC - Overview
- Exhibits132: Draken International, LLC - Product / Service
- Exhibits133: Draken International, LLC - Key offerings
- Exhibits134: Eaton Corp. Plc - Overview
- Exhibits135: Eaton Corp. Plc - Business segments
- Exhibits136: Eaton Corp. Plc - Key news
- Exhibits137: Eaton Corp. Plc - Key offerings
- Exhibits138: Eaton Corp. Plc - Segment focus
- Exhibits139: Embraer SA - Overview
- Exhibits140: Embraer SA - Business segments
- Exhibits141: Embraer SA - Key offerings
- Exhibits142: Embraer SA - Segment focus
- Exhibits143: General Electric Co. - Overview
- Exhibits144: General Electric Co. - Business segments
- Exhibits145: General Electric Co. - Key news
- Exhibits146: General Electric Co. - Key offerings
- Exhibits147: General Electric Co. - Segment focus
- Exhibits148: Israel Aerospace Industries Ltd. - Overview
- Exhibits149: Israel Aerospace Industries Ltd. - Product / Service
- Exhibits150: Israel Aerospace Industries Ltd. - Key news
- Exhibits151: Israel Aerospace Industries Ltd. - Key offerings
- Exhibits152: Liebherr International Deutschland GmbH - Overview
- Exhibits153: Liebherr International Deutschland GmbH - Product / Service
- Exhibits154: Liebherr International Deutschland GmbH - Key news
- Exhibits155: Liebherr International Deutschland GmbH - Key offerings
- Exhibits156: Lockheed Martin Corp. - Overview
- Exhibits157: Lockheed Martin Corp. - Business segments
- Exhibits158: Lockheed Martin Corp. - Key offerings
- Exhibits159: Lockheed Martin Corp. - Segment focus
- Exhibits160: Marshall of Cambridge Holdings Ltd. - Overview
- Exhibits161: Marshall of Cambridge Holdings Ltd. - Product / Service
- Exhibits162: Marshall of Cambridge Holdings Ltd. - Key offerings
- Exhibits163: Rostec - Overview
- Exhibits164: Rostec - Product / Service
- Exhibits165: Rostec - Key offerings
- Exhibits166: The Boeing Co. - Overview
- Exhibits167: The Boeing Co. - Business segments
- Exhibits168: The Boeing Co. - Key news
- Exhibits169: The Boeing Co. - Key offerings
- Exhibits170: The Boeing Co. - Segment focus
- Exhibits171: Inclusions checklist
- Exhibits172: Exclusions checklist
- Exhibits173: Currency conversion rates for US$
- Exhibits174: Research methodology
- Exhibits175: Information sources
- Exhibits176: Data validation
- Exhibits177: Validation techniques employed for market sizing
- Exhibits178: Data synthesis
- Exhibits179: 360 degree market analysis
- Exhibits180: List of abbreviations
The military aerial refueling tanker market is forecasted to grow by USD 4218.1 mn during 2023-2028, accelerating AT a CAGR of 7.01% during the forecast period. The report on the military aerial refueling tanker market provides a holistic analysis, market size and forecast, trends, growth drivers, and challenges, as well as vendor analysis covering around 25 vendors.
The report offers an up-to-date analysis regarding the current market scenario, the latest trends and drivers, and the overall market environment. The market is driven by joint development/acquisition approach, shift toward next-generation long-range strike platform, and measured quantity of fuel onboard to optimize performance.
Technavio's military aerial refueling tanker market is segmented as below:
| Market Scope | |
|---|---|
| Base Year | 2024 |
| End Year | 2028 |
| Series Year | 2024-2028 |
| Growth Momentum | Accelerate |
| YOY 2024 | 6.43% |
| CAGR | 7.01% |
| Incremental Value | $4218.1mn |
By Technology
- Probe-and-drogue
- Boom-and-receptacle
By Type
- Manned
- Unmanned
By Geographical Landscape
- North America
- APAC
- Europe
- Middle East and Africa
- South America
This study identifies the growing investments in multi-layered air defense network as one of the prime reasons driving the military aerial refueling tanker market growth during the next few years. Also, development of vtol aerial refueling tankers and implementation of additive manufacturing will lead to sizable demand in the market.
The report on the military aerial refueling tanker market covers the following areas:
- Military aerial refueling tanker market sizing
- Military aerial refueling tanker market forecast
- Military aerial refueling tanker market industry analysis
The robust vendor analysis is designed to help clients improve their market position, and in line with this, this report provides a detailed analysis of several leading military aerial refueling tanker market vendors that include Airbus SE, BAE Systems PLC, Bandak Aviation Inc., Cobham Ltd., Dassault Aviation SA, Draken International, LLC, Eaton Corp. PLC, Embraer SA, General Electric Co., Israel Aerospace Industries Ltd., Liebherr International Deutschland GmbH, Lockheed Martin Corp., Marshall of Cambridge Holdings Ltd., Omega Aerial Refueling Services Inc., Parker Hannifin Corp., Protankgrup, Rostec, Safran SA, Smiths Group PLC, and The Boeing Co.. Also, the military aerial refueling tanker market analysis report includes information on upcoming trends and challenges that will influence market growth. This is to help companies strategize and leverage all forthcoming growth opportunities.
The study was conducted using an objective combination of primary and secondary information including inputs from key participants in the industry. The report contains a comprehensive market and vendor landscape in addition to an analysis of the key vendors.
The publisher presents a detailed picture of the market by the way of study, synthesis, and summation of data from multiple sources by an analysis of key parameters such as profit, pricing, competition, and promotions. IT presents various market facets by identifying the key industry influencers. The data presented is comprehensive, reliable, and a result of extensive research - both primary and secondary. The market research reports provide a complete competitive landscape and an in-depth vendor selection methodology and analysis using qualitative and quantitative research to forecast the accurate market growth.
Table of Contents
1 Executive Summary
- 1.1 Market overview
- Executive Summary - Chart on Market Overview
- Executive Summary - Data Table on Market Overview
- Executive Summary - Chart on Global Market Characteristics
- Executive Summary - Chart on Market By Geographical Landscape
- Executive Summary - Chart on Market Segmentation by Technology
- Executive Summary - Chart on Market Segmentation by Type
- Executive Summary - Chart on Incremental Growth
- Executive Summary - Data Table on Incremental Growth
- Executive Summary - Chart on Company Market Positioning
2 Market Landscape
- 2.1 Market ecosystem
- Parent Market
- Data Table on - Parent Market
- 2.2 Market characteristics
- Market characteristics analysis
- 2.3 Value chain analysis
- Value Chain Analysis
3 Market Sizing
- 3.1 Market definition
- Offerings of companies included in the market definition
- 3.2 Market segment analysis
- Market segments
- 3.3 Market size 2023
- 3.4 Market outlook: Forecast for 2023-2028
- Chart on Global - Market size and forecast 2023-2028 ($ million)
- Data Table on Global - Market size and forecast 2023-2028 ($ million)
- Chart on Global Market: Year-over-year growth 2023-2028 (%)
- Data Table on Global Market: Year-over-year growth 2023-2028 (%)
4 Historic Market Size
- 4.1 Global Military Aerial Refueling Tanker Market 2018 - 2022
- Historic Market Size - Data Table on Global Military Aerial Refueling Tanker Market 2018 - 2022 ($ million)
- 4.2 Technology segment analysis 2018 - 2022
- Historic Market Size - Technology Segment 2018 - 2022 ($ million)
- 4.3 Type segment analysis 2018 - 2022
- Historic Market Size - Type Segment 2018 - 2022 ($ million)
- 4.4 Geography segment analysis 2018 - 2022
- Historic Market Size - Geography Segment 2018 - 2022 ($ million)
- 4.5 Country segment analysis 2018 - 2022
- Historic Market Size - Country Segment 2018 - 2022 ($ million)
5 Five Forces Analysis
- 5.1 Five forces summary
- Five forces analysis - Comparison between 2023 and 2028
- 5.2 Bargaining power of buyers
- Bargaining power of buyers - Impact of key factors 2023 and 2028
- 5.3 Bargaining power of suppliers
- Bargaining power of suppliers - Impact of key factors in 2023 and 2028
- 5.4 Threat of new entrants
- Threat of new entrants - Impact of key factors in 2023 and 2028
- 5.5 Threat of substitutes
- Threat of substitutes - Impact of key factors in 2023 and 2028
- 5.6 Threat of rivalry
- Threat of rivalry - Impact of key factors in 2023 and 2028
- 5.7 Market condition
- Chart on Market condition - Five forces 2023 and 2028
6 Market Segmentation by Technology
- 6.1 Market segments
- Chart on Technology - Market share 2023-2028 (%)
- Data Table on Technology - Market share 2023-2028 (%)
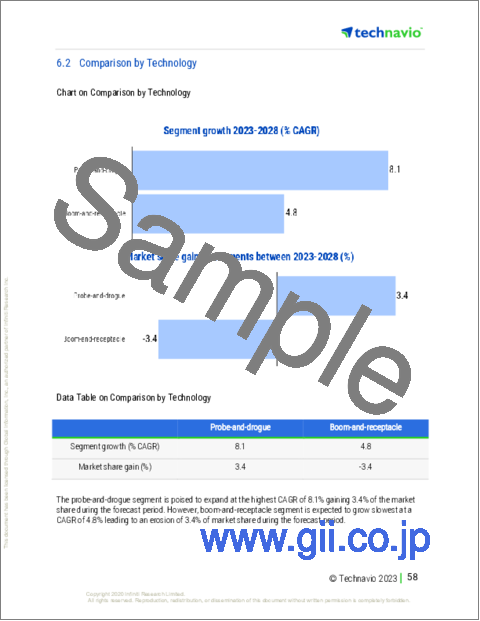
- 6.2 Comparison by Technology
- Chart on Comparison by Technology
- Data Table on Comparison by Technology
- 6.3 Probe-and-drogue - Market size and forecast 2023-2028
- Chart on Probe-and-drogue - Market size and forecast 2023-2028 ($ million)
- Data Table on Probe-and-drogue - Market size and forecast 2023-2028 ($ million)
- Chart on Probe-and-drogue - Year-over-year growth 2023-2028 (%)
- Data Table on Probe-and-drogue - Year-over-year growth 2023-2028 (%)
- 6.4 Boom-and-receptacle - Market size and forecast 2023-2028
- Chart on Boom-and-receptacle - Market size and forecast 2023-2028 ($ million)
- Data Table on Boom-and-receptacle - Market size and forecast 2023-2028 ($ million)
- Chart on Boom-and-receptacle - Year-over-year growth 2023-2028 (%)
- Data Table on Boom-and-receptacle - Year-over-year growth 2023-2028 (%)
- 6.5 Market opportunity by Technology
- Market opportunity by Technology ($ million)
- Data Table on Market opportunity by Technology ($ million)
7 Market Segmentation by Type
- 7.1 Market segments
- Chart on Type - Market share 2023-2028 (%)
- Data Table on Type - Market share 2023-2028 (%)
- 7.2 Comparison by Type
- Chart on Comparison by Type
- Data Table on Comparison by Type
- 7.3 Manned - Market size and forecast 2023-2028
- Chart on Manned - Market size and forecast 2023-2028 ($ million)
- Data Table on Manned - Market size and forecast 2023-2028 ($ million)
- Chart on Manned - Year-over-year growth 2023-2028 (%)
- Data Table on Manned - Year-over-year growth 2023-2028 (%)
- 7.4 Unmanned - Market size and forecast 2023-2028
- Chart on Unmanned - Market size and forecast 2023-2028 ($ million)
- Data Table on Unmanned - Market size and forecast 2023-2028 ($ million)
- Chart on Unmanned - Year-over-year growth 2023-2028 (%)
- Data Table on Unmanned - Year-over-year growth 2023-2028 (%)
- 7.5 Market opportunity by Type
- Market opportunity by Type ($ million)
- Data Table on Market opportunity by Type ($ million)
8 Customer Landscape
- 8.1 Customer landscape overview
- Analysis of price sensitivity, lifecycle, customer purchase basket, adoption rates, and purchase criteria
9 Geographic Landscape
- 9.1 Geographic segmentation
- Chart on Market share By Geographical Landscape 2023-2028 (%)
- Data Table on Market share By Geographical Landscape 2023-2028 (%)
- 9.2 Geographic comparison
- Chart on Geographic comparison
- Data Table on Geographic comparison
- 9.3 North America - Market size and forecast 2023-2028
- Chart on North America - Market size and forecast 2023-2028 ($ million)
- Data Table on North America - Market size and forecast 2023-2028 ($ million)
- Chart on North America - Year-over-year growth 2023-2028 (%)
- Data Table on North America - Year-over-year growth 2023-2028 (%)
- 9.4 APAC - Market size and forecast 2023-2028
- Chart on APAC - Market size and forecast 2023-2028 ($ million)
- Data Table on APAC - Market size and forecast 2023-2028 ($ million)
- Chart on APAC - Year-over-year growth 2023-2028 (%)
- Data Table on APAC - Year-over-year growth 2023-2028 (%)
- 9.5 Europe - Market size and forecast 2023-2028
- Chart on Europe - Market size and forecast 2023-2028 ($ million)
- Data Table on Europe - Market size and forecast 2023-2028 ($ million)
- Chart on Europe - Year-over-year growth 2023-2028 (%)
- Data Table on Europe - Year-over-year growth 2023-2028 (%)
- 9.6 Middle East and Africa - Market size and forecast 2023-2028
- Chart on Middle East and Africa - Market size and forecast 2023-2028 ($ million)
- Data Table on Middle East and Africa - Market size and forecast 2023-2028 ($ million)
- Chart on Middle East and Africa - Year-over-year growth 2023-2028 (%)
- Data Table on Middle East and Africa - Year-over-year growth 2023-2028 (%)
- 9.7 South America - Market size and forecast 2023-2028
- Chart on South America - Market size and forecast 2023-2028 ($ million)
- Data Table on South America - Market size and forecast 2023-2028 ($ million)
- Chart on South America - Year-over-year growth 2023-2028 (%)
- Data Table on South America - Year-over-year growth 2023-2028 (%)
- 9.8 US - Market size and forecast 2023-2028
- Chart on US - Market size and forecast 2023-2028 ($ million)
- Data Table on US - Market size and forecast 2023-2028 ($ million)
- Chart on US - Year-over-year growth 2023-2028 (%)
- Data Table on US - Year-over-year growth 2023-2028 (%)
- 9.9 China - Market size and forecast 2023-2028
- Chart on China - Market size and forecast 2023-2028 ($ million)
- Data Table on China - Market size and forecast 2023-2028 ($ million)
- Chart on China - Year-over-year growth 2023-2028 (%)
- Data Table on China - Year-over-year growth 2023-2028 (%)
- 9.10 France - Market size and forecast 2023-2028
- Chart on France - Market size and forecast 2023-2028 ($ million)
- Data Table on France - Market size and forecast 2023-2028 ($ million)
- Chart on France - Year-over-year growth 2023-2028 (%)
- Data Table on France - Year-over-year growth 2023-2028 (%)
- 9.11 UK - Market size and forecast 2023-2028
- Chart on UK - Market size and forecast 2023-2028 ($ million)
- Data Table on UK - Market size and forecast 2023-2028 ($ million)
- Chart on UK - Year-over-year growth 2023-2028 (%)
- Data Table on UK - Year-over-year growth 2023-2028 (%)
- 9.12 India - Market size and forecast 2023-2028
- Chart on India - Market size and forecast 2023-2028 ($ million)
- Data Table on India - Market size and forecast 2023-2028 ($ million)
- Chart on India - Year-over-year growth 2023-2028 (%)
- Data Table on India - Year-over-year growth 2023-2028 (%)
- 9.13 Market opportunity By Geographical Landscape
- Market opportunity By Geographical Landscape ($ million)
- Data Tables on Market opportunity By Geographical Landscape ($ million)
10 Drivers, Challenges, and Opportunity/Restraints
- 10.1 Market drivers
- 10.2 Market challenges
- 10.3 Impact of drivers and challenges
- Impact of drivers and challenges in 2023 and 2028
- 10.4 Market opportunities/restraints
11 Competitive Landscape
- 11.1 Overview
- 11.2 Competitive Landscape
- Overview on criticality of inputs and factors of differentiation
- 11.3 Landscape disruption
- Overview on factors of disruption
- 11.4 Industry risks
- Impact of key risks on business
12 Competitive Analysis
- 12.1 Companies profiled
- Companies covered
- 12.2 Market positioning of companies
- Matrix on companies position and classification
- 12.3 Airbus SE
- Airbus SE - Overview
- Airbus SE - Business segments
- Airbus SE - Key news
- Airbus SE - Key offerings
- Airbus SE - Segment focus
- 12.4 BAE Systems Plc
- BAE Systems Plc - Overview
- BAE Systems Plc - Business segments
- BAE Systems Plc - Key offerings
- BAE Systems Plc - Segment focus
- 12.5 Bandak Aviation Inc.
- Bandak Aviation Inc. - Overview
- Bandak Aviation Inc. - Product / Service
- Bandak Aviation Inc. - Key offerings
- 12.6 Cobham Ltd.
- Cobham Ltd. - Overview
- Cobham Ltd. - Product / Service
- Cobham Ltd. - Key offerings
- 12.7 Dassault Aviation SA
- Dassault Aviation SA - Overview
- Dassault Aviation SA - Product / Service
- Dassault Aviation SA - Key offerings
- 12.8 Draken International, LLC
- Draken International, LLC - Overview
- Draken International, LLC - Product / Service
- Draken International, LLC - Key offerings
- 12.9 Eaton Corp. Plc
- Eaton Corp. Plc - Overview
- Eaton Corp. Plc - Business segments
- Eaton Corp. Plc - Key news
- Eaton Corp. Plc - Key offerings
- Eaton Corp. Plc - Segment focus
- 12.10 Embraer SA
- Embraer SA - Overview
- Embraer SA - Business segments
- Embraer SA - Key offerings
- Embraer SA - Segment focus
- 12.11 General Electric Co.
- General Electric Co. - Overview
- General Electric Co. - Business segments
- General Electric Co. - Key news
- General Electric Co. - Key offerings
- General Electric Co. - Segment focus
- 12.12 Israel Aerospace Industries Ltd.
- Israel Aerospace Industries Ltd. - Overview
- Israel Aerospace Industries Ltd. - Product / Service
- Israel Aerospace Industries Ltd. - Key news
- Israel Aerospace Industries Ltd. - Key offerings
- 12.13 Liebherr International Deutschland GmbH
- Liebherr International Deutschland GmbH - Overview
- Liebherr International Deutschland GmbH - Product / Service
- Liebherr International Deutschland GmbH - Key news
- Liebherr International Deutschland GmbH - Key offerings
- 12.14 Lockheed Martin Corp.
- Lockheed Martin Corp. - Overview
- Lockheed Martin Corp. - Business segments
- Lockheed Martin Corp. - Key offerings
- Lockheed Martin Corp. - Segment focus
- 12.15 Marshall of Cambridge Holdings Ltd.
- Marshall of Cambridge Holdings Ltd. - Overview
- Marshall of Cambridge Holdings Ltd. - Product / Service
- Marshall of Cambridge Holdings Ltd. - Key offerings
- 12.16 Rostec
- Rostec - Overview
- Rostec - Product / Service
- Rostec - Key offerings
- 12.17 The Boeing Co.
- The Boeing Co. - Overview
- The Boeing Co. - Business segments
- The Boeing Co. - Key news
- The Boeing Co. - Key offerings
- The Boeing Co. - Segment focus
13 Appendix
- 13.1 Scope of the report
- 13.2 Inclusions and exclusions checklist
- Inclusions checklist
- Exclusions checklist
- 13.3 Currency conversion rates for US$
- Currency conversion rates for US$
- 13.4 Research methodology
- Research methodology
- 13.5 Data procurement
- Information sources
- 13.6 Data validation
- Data validation
- 13.7 Validation techniques employed for market sizing
- Validation techniques employed for market sizing
- 13.8 Data synthesis
- Data synthesis
- 13.9 360 degree market analysis
- 360 degree market analysis
- 13.10 List of abbreviations
- List of abbreviations

