|
|
市場調査レポート
商品コード
1557422
歯科用コーンビームCT(CBCT)の世界市場 2024-2028Global Dental Cone Beam Computed Tomography (CBCT) Market 2024-2028 |
||||||

|
|||||||
カスタマイズ可能
|
|||||||

| 歯科用コーンビームCT(CBCT)の世界市場 2024-2028 |
|
出版日: 2024年08月15日
発行: TechNavio
ページ情報: 英文 162 Pages
納期: 即納可能
|

全表示
- 概要
- 図表
- 目次
歯科用コーンビームCT(CBCT)市場は2023-2028年に3億2,230万米ドル、予測期間中のCAGRは6.78%で成長すると予測されます。
当レポートでは、歯科用コーンビームCT(CBCT)市場の全体的な分析、市場規模・予測、動向、成長促進要因、課題、約25のベンダーを網羅したベンダー分析などを掲載しています。
現在の市場シナリオ、最新動向と促進要因、市場環境全体に関する最新分析を提供しています。画像技術の継続的な進歩、口腔衛生意識の高まり、高齢者人口の増加などが市場を牽引しています。
| 市場範囲 | |
|---|---|
| 基準年 | 2024 |
| 終了年 | 2028 |
| 予測期間 | 2024-2028 |
| 成長モメンタム | 加速 |
| 前年比2024年 | 6.23% |
| CAGR | 6.78% |
| 増分額 | 3億2,230万米ドル |
本調査では、コーンビームCT(コンピュータ断層撮影)システムとソフトウェアツールの統合が、今後数年間の歯科用コーンビームCT(CBCT)市場成長を牽引する主な要因の1つであるとしています。また、市場で入手可能な3Dデンタルスキャナーの増加やデンタルツーリズムの増加も市場の大きな需要につながります。
目次
第1章 エグゼクティブサマリー
- 市場概要
第2章 市場情勢
- 市場エコシステム
- 市場の特徴
- バリューチェーン分析
第3章 市場規模の評価
- 市場の定義
- 市場セグメント分析
- 市場規模 2023
- 市場の見通し 2023-2028
第4章 市場規模実績
- 歯科用コーンビームCT(CBCT)の世界市場 2018-2022
- 用途別セグメント分析 2018-2022
- エンドユーザー別セグメント分析 2018-2022
- 地域別セグメント分析 2018-2022
- 国別セグメント分析 2018-2022
第5章 ファイブフォース分析
- ファイブフォースの要約
- 買い手の交渉力
- 供給企業の交渉力
- 新規参入業者の脅威
- 代替品の脅威
- 競争の脅威
- 市況
第6章 市場セグメンテーション:用途別
- 市場セグメンテーション
- 比較:用途別
- 歯科インプラント:市場規模と予測 2023-2028
- 歯内療法と歯周病学:市場規模と予測 2023-2028
- 矯正歯科:市場規模と予測 2023-2028
- 歯科手術:市場規模と予測 2023-2028
- 市場機会:用途別
第7章 市場セグメンテーション:エンドユーザー別
- 市場セグメンテーション
- 比較:エンドユーザー別
- 病院:市場規模と予測 2023-2028
- 歯科医院・歯科技工所:市場規模と予測 2023-2028
- 市場機会:エンドユーザー別
第8章 顧客情勢
- 顧客情勢の概要
第9章 地域別情勢
- 地域別セグメンテーション
- 地域別比較
- 北米:市場規模と予測 2023-2028
- 欧州:市場規模と予測 2023-2028
- アジア:市場規模と予測 2023-2028
- 世界のその他の地域:市場規模と予測 2023-2028
- 米国:市場規模と予測 2023-2028
- ドイツ:市場規模と予測 2023-2028
- 英国:市場規模と予測 2023-2028
- 中国:市場規模と予測 2023-2028
- 日本:市場規模と予測 2023-2028
- 市場機会:地域情勢別
第10章 促進要因・課題・機会・抑制要因
- 市場促進要因
- 市場の課題
- 促進要因と課題の影響
- 市場の機会・抑制要因
第11章 競合情勢
- 概要
- 競合情勢
- 混乱の状況
- 業界のリスク
第12章 競合分析
- 企業プロファイル
- 企業の市場ポジショニング
- Air Techniques Inc.
- Asahi Roentgen Ind. Co. Ltd
- Carestream Health Inc.
- Cefla SC
- Dentium Co. Ltd.
- Dentsply Sirona Inc.
- Durr Dental SE
- Envista Holdings Corp.
- Finapoline SAS
- GENORAY Co. Ltd.
- J. Morita Corp.
- Owandy Radiology
- Planmeca Oy
- PreXion Corp.
- Vatech Co. Ltd.
第13章 付録
Exhibits:
- Exhibits1: Executive Summary - Chart on Market Overview
- Exhibits2: Executive Summary - Data Table on Market Overview
- Exhibits3: Executive Summary - Chart on Global Market Characteristics
- Exhibits4: Executive Summary - Chart on Market By Geographical Landscape
- Exhibits5: Executive Summary - Chart on Market Segmentation by Application
- Exhibits6: Executive Summary - Chart on Market Segmentation by End-user
- Exhibits7: Executive Summary - Chart on Incremental Growth
- Exhibits8: Executive Summary - Data Table on Incremental Growth
- Exhibits9: Executive Summary - Chart on Company Market Positioning
- Exhibits10: Parent Market
- Exhibits11: Data Table on - Parent Market
- Exhibits12: Market characteristics analysis
- Exhibits13: Value Chain Analysis
- Exhibits14: Offerings of companies included in the market definition
- Exhibits15: Market segments
- Exhibits16: Chart on Global - Market size and forecast 2023-2028 ($ million)
- Exhibits17: Data Table on Global - Market size and forecast 2023-2028 ($ million)
- Exhibits18: Chart on Global Market: Year-over-year growth 2023-2028 (%)
- Exhibits19: Data Table on Global Market: Year-over-year growth 2023-2028 (%)
- Exhibits20: Historic Market Size - Data Table on Global Dental Cone Beam Computed Tomography (CBCT) Market 2018 - 2022 ($ million)
- Exhibits21: Historic Market Size - Application Segment 2018 - 2022 ($ million)
- Exhibits22: Historic Market Size - End-user Segment 2018 - 2022 ($ million)
- Exhibits23: Historic Market Size - Geography Segment 2018 - 2022 ($ million)
- Exhibits24: Historic Market Size - Country Segment 2018 - 2022 ($ million)
- Exhibits25: Five forces analysis - Comparison between 2023 and 2028
- Exhibits26: Bargaining power of buyers - Impact of key factors 2023 and 2028
- Exhibits27: Bargaining power of suppliers - Impact of key factors in 2023 and 2028
- Exhibits28: Threat of new entrants - Impact of key factors in 2023 and 2028
- Exhibits29: Threat of substitutes - Impact of key factors in 2023 and 2028
- Exhibits30: Threat of rivalry - Impact of key factors in 2023 and 2028
- Exhibits31: Chart on Market condition - Five forces 2023 and 2028
- Exhibits32: Chart on Application - Market share 2023-2028 (%)
- Exhibits33: Data Table on Application - Market share 2023-2028 (%)
- Exhibits34: Chart on Comparison by Application
- Exhibits35: Data Table on Comparison by Application
- Exhibits36: Chart on Dental implants - Market size and forecast 2023-2028 ($ million)
- Exhibits37: Data Table on Dental implants - Market size and forecast 2023-2028 ($ million)
- Exhibits38: Chart on Dental implants - Year-over-year growth 2023-2028 (%)
- Exhibits39: Data Table on Dental implants - Year-over-year growth 2023-2028 (%)
- Exhibits40: Chart on Endodontic and periodontics - Market size and forecast 2023-2028 ($ million)
- Exhibits41: Data Table on Endodontic and periodontics - Market size and forecast 2023-2028 ($ million)
- Exhibits42: Chart on Endodontic and periodontics - Year-over-year growth 2023-2028 (%)
- Exhibits43: Data Table on Endodontic and periodontics - Year-over-year growth 2023-2028 (%)
- Exhibits44: Chart on Orthodontic - Market size and forecast 2023-2028 ($ million)
- Exhibits45: Data Table on Orthodontic - Market size and forecast 2023-2028 ($ million)
- Exhibits46: Chart on Orthodontic - Year-over-year growth 2023-2028 (%)
- Exhibits47: Data Table on Orthodontic - Year-over-year growth 2023-2028 (%)
- Exhibits48: Chart on Dental surgeries - Market size and forecast 2023-2028 ($ million)
- Exhibits49: Data Table on Dental surgeries - Market size and forecast 2023-2028 ($ million)
- Exhibits50: Chart on Dental surgeries - Year-over-year growth 2023-2028 (%)
- Exhibits51: Data Table on Dental surgeries - Year-over-year growth 2023-2028 (%)
- Exhibits52: Market opportunity by Application ($ million)
- Exhibits53: Data Table on Market opportunity by Application ($ million)
- Exhibits54: Chart on End-user - Market share 2023-2028 (%)
- Exhibits55: Data Table on End-user - Market share 2023-2028 (%)
- Exhibits56: Chart on Comparison by End-user
- Exhibits57: Data Table on Comparison by End-user
- Exhibits58: Chart on Hospitals - Market size and forecast 2023-2028 ($ million)
- Exhibits59: Data Table on Hospitals - Market size and forecast 2023-2028 ($ million)
- Exhibits60: Chart on Hospitals - Year-over-year growth 2023-2028 (%)
- Exhibits61: Data Table on Hospitals - Year-over-year growth 2023-2028 (%)
- Exhibits62: Chart on Dental clinics and laboratories - Market size and forecast 2023-2028 ($ million)
- Exhibits63: Data Table on Dental clinics and laboratories - Market size and forecast 2023-2028 ($ million)
- Exhibits64: Chart on Dental clinics and laboratories - Year-over-year growth 2023-2028 (%)
- Exhibits65: Data Table on Dental clinics and laboratories - Year-over-year growth 2023-2028 (%)
- Exhibits66: Market opportunity by End-user ($ million)
- Exhibits67: Data Table on Market opportunity by End-user ($ million)
- Exhibits68: Analysis of price sensitivity, lifecycle, customer purchase basket, adoption rates, and purchase criteria
- Exhibits69: Chart on Market share By Geographical Landscape 2023-2028 (%)
- Exhibits70: Data Table on Market share By Geographical Landscape 2023-2028 (%)
- Exhibits71: Chart on Geographic comparison
- Exhibits72: Data Table on Geographic comparison
- Exhibits73: Chart on North America - Market size and forecast 2023-2028 ($ million)
- Exhibits74: Data Table on North America - Market size and forecast 2023-2028 ($ million)
- Exhibits75: Chart on North America - Year-over-year growth 2023-2028 (%)
- Exhibits76: Data Table on North America - Year-over-year growth 2023-2028 (%)
- Exhibits77: Chart on Europe - Market size and forecast 2023-2028 ($ million)
- Exhibits78: Data Table on Europe - Market size and forecast 2023-2028 ($ million)
- Exhibits79: Chart on Europe - Year-over-year growth 2023-2028 (%)
- Exhibits80: Data Table on Europe - Year-over-year growth 2023-2028 (%)
- Exhibits81: Chart on Asia - Market size and forecast 2023-2028 ($ million)
- Exhibits82: Data Table on Asia - Market size and forecast 2023-2028 ($ million)
- Exhibits83: Chart on Asia - Year-over-year growth 2023-2028 (%)
- Exhibits84: Data Table on Asia - Year-over-year growth 2023-2028 (%)
- Exhibits85: Chart on Rest of World (ROW) - Market size and forecast 2023-2028 ($ million)
- Exhibits86: Data Table on Rest of World (ROW) - Market size and forecast 2023-2028 ($ million)
- Exhibits87: Chart on Rest of World (ROW) - Year-over-year growth 2023-2028 (%)
- Exhibits88: Data Table on Rest of World (ROW) - Year-over-year growth 2023-2028 (%)
- Exhibits89: Chart on US - Market size and forecast 2023-2028 ($ million)
- Exhibits90: Data Table on US - Market size and forecast 2023-2028 ($ million)
- Exhibits91: Chart on US - Year-over-year growth 2023-2028 (%)
- Exhibits92: Data Table on US - Year-over-year growth 2023-2028 (%)
- Exhibits93: Chart on Germany - Market size and forecast 2023-2028 ($ million)
- Exhibits94: Data Table on Germany - Market size and forecast 2023-2028 ($ million)
- Exhibits95: Chart on Germany - Year-over-year growth 2023-2028 (%)
- Exhibits96: Data Table on Germany - Year-over-year growth 2023-2028 (%)
- Exhibits97: Chart on UK - Market size and forecast 2023-2028 ($ million)
- Exhibits98: Data Table on UK - Market size and forecast 2023-2028 ($ million)
- Exhibits99: Chart on UK - Year-over-year growth 2023-2028 (%)
- Exhibits100: Data Table on UK - Year-over-year growth 2023-2028 (%)
- Exhibits101: Chart on China - Market size and forecast 2023-2028 ($ million)
- Exhibits102: Data Table on China - Market size and forecast 2023-2028 ($ million)
- Exhibits103: Chart on China - Year-over-year growth 2023-2028 (%)
- Exhibits104: Data Table on China - Year-over-year growth 2023-2028 (%)
- Exhibits105: Chart on Japan - Market size and forecast 2023-2028 ($ million)
- Exhibits106: Data Table on Japan - Market size and forecast 2023-2028 ($ million)
- Exhibits107: Chart on Japan - Year-over-year growth 2023-2028 (%)
- Exhibits108: Data Table on Japan - Year-over-year growth 2023-2028 (%)
- Exhibits109: Market opportunity By Geographical Landscape ($ million)
- Exhibits110: Data Tables on Market opportunity By Geographical Landscape ($ million)
- Exhibits111: Impact of drivers and challenges in 2023 and 2028
- Exhibits112: Overview on criticality of inputs and factors of differentiation
- Exhibits113: Overview on factors of disruption
- Exhibits114: Impact of key risks on business
- Exhibits115: Companies covered
- Exhibits116: Matrix on companies position and classification
- Exhibits117: Air Techniques Inc. - Overview
- Exhibits118: Air Techniques Inc. - Product / Service
- Exhibits119: Air Techniques Inc. - Key offerings
- Exhibits120: Asahi Roentgen Ind. Co. Ltd - Overview
- Exhibits121: Asahi Roentgen Ind. Co. Ltd - Product / Service
- Exhibits122: Asahi Roentgen Ind. Co. Ltd - Key offerings
- Exhibits123: Carestream Health Inc. - Overview
- Exhibits124: Carestream Health Inc. - Product / Service
- Exhibits125: Carestream Health Inc. - Key offerings
- Exhibits126: Cefla SC - Overview
- Exhibits127: Cefla SC - Product / Service
- Exhibits128: Cefla SC - Key offerings
- Exhibits129: Dentium Co. Ltd. - Overview
- Exhibits130: Dentium Co. Ltd. - Product / Service
- Exhibits131: Dentium Co. Ltd. - Key offerings
- Exhibits132: Dentsply Sirona Inc. - Overview
- Exhibits133: Dentsply Sirona Inc. - Business segments
- Exhibits134: Dentsply Sirona Inc. - Key news
- Exhibits135: Dentsply Sirona Inc. - Key offerings
- Exhibits136: Dentsply Sirona Inc. - Segment focus
- Exhibits137: Durr Dental SE - Overview
- Exhibits138: Durr Dental SE - Product / Service
- Exhibits139: Durr Dental SE - Key offerings
- Exhibits140: Envista Holdings Corp. - Overview
- Exhibits141: Envista Holdings Corp. - Business segments
- Exhibits142: Envista Holdings Corp. - Key news
- Exhibits143: Envista Holdings Corp. - Key offerings
- Exhibits144: Envista Holdings Corp. - Segment focus
- Exhibits145: Finapoline SAS - Overview
- Exhibits146: Finapoline SAS - Product / Service
- Exhibits147: Finapoline SAS - Key offerings
- Exhibits148: GENORAY Co. Ltd. - Overview
- Exhibits149: GENORAY Co. Ltd. - Product / Service
- Exhibits150: GENORAY Co. Ltd. - Key offerings
- Exhibits151: J. Morita Corp. - Overview
- Exhibits152: J. Morita Corp. - Product / Service
- Exhibits153: J. Morita Corp. - Key offerings
- Exhibits154: Owandy Radiology - Overview
- Exhibits155: Owandy Radiology - Product / Service
- Exhibits156: Owandy Radiology - Key offerings
- Exhibits157: Planmeca Oy - Overview
- Exhibits158: Planmeca Oy - Product / Service
- Exhibits159: Planmeca Oy - Key offerings
- Exhibits160: PreXion Corp. - Overview
- Exhibits161: PreXion Corp. - Product / Service
- Exhibits162: PreXion Corp. - Key offerings
- Exhibits163: Vatech Co. Ltd. - Overview
- Exhibits164: Vatech Co. Ltd. - Product / Service
- Exhibits165: Vatech Co. Ltd. - Key offerings
- Exhibits166: Inclusions checklist
- Exhibits167: Exclusions checklist
- Exhibits168: Currency conversion rates for US$
- Exhibits169: Research methodology
- Exhibits170: Information sources
- Exhibits171: Data validation
- Exhibits172: Validation techniques employed for market sizing
- Exhibits173: Data synthesis
- Exhibits174: 360 degree market analysis
- Exhibits175: List of abbreviations
The dental cone beam computed tomography (CBCT) market is forecasted to grow by USD 322.3 mn during 2023-2028, accelerating at a CAGR of 6.78% during the forecast period. The report on the dental cone beam computed tomography (CBCT) market provides a holistic analysis, market size and forecast, trends, growth drivers, and challenges, as well as vendor analysis covering around 25 vendors.
The report offers an up-to-date analysis regarding the current market scenario, the latest trends and drivers, and the overall market environment. The market is driven by continuous advancements in imaging technology, rising oral health awareness, and growing geriatric population.
Technavio's dental cone beam computed tomography (CBCT) market is segmented as below:
| Market Scope | |
|---|---|
| Base Year | 2024 |
| End Year | 2028 |
| Series Year | 2024-2028 |
| Growth Momentum | Accelerate |
| YOY 2024 | 6.23% |
| CAGR | 6.78% |
| Incremental Value | $322.3 mn |
By Application
- Dental implants
- Endodontic and periodontics
- Orthodontic
- Dental surgeries
By End-user
- Hospitals
- Dental clinics and laboratories
By Geographical Landscape
- North America
- Europe
- Asia
- Rest of World (ROW)
This study identifies the integration of software tools with cone beam computed tomography systems as one of the prime reasons driving the dental cone beam computed tomography (CBCT) market growth during the next few years. Also, increasing number of 3d dental scanners available in market and increasing rate of dental tourism will lead to sizable demand in the market.
The report on the dental cone beam computed tomography (CBCT) market covers the following areas:
- Dental cone beam computed tomography (CBCT) market sizing
- Dental cone beam computed tomography (CBCT) market forecast
- Dental cone beam computed tomography (CBCT) market industry analysis
The robust vendor analysis is designed to help clients improve their market position, and in line with this, this report provides a detailed analysis of several leading dental cone beam computed tomography (CBCT) market vendors that include 3Shape AS, Air Techniques Inc., Asahi Roentgen Ind. Co. Ltd, Carestream Health Inc., Cefla SC, Dentium Co. Ltd., Dentsply Sirona Inc., Durr Dental SE, Envista Holdings Corp., Finapoline SAS, GENORAY Co. Ltd., HDXWILL, J. Morita Corp., LargeV Instrument Corp. Ltd., Owandy Radiology, Planmeca Oy, PointNix Co. Ltd., PreXion Corp., Trident Srl, and Vatech Co. Ltd.. Also, the dental cone beam computed tomography (CBCT) market analysis report includes information on upcoming trends and challenges that will influence market growth. This is to help companies strategize and leverage all forthcoming growth opportunities.
The study was conducted using an objective combination of primary and secondary information including inputs from key participants in the industry. The report contains a comprehensive market and vendor landscape in addition to an analysis of the key vendors.
The publisher presents a detailed picture of the market by the way of study, synthesis, and summation of data from multiple sources by an analysis of key parameters such as profit, pricing, competition, and promotions. It presents various market facets by identifying the key industry influencers. The data presented is comprehensive, reliable, and a result of extensive research - both primary and secondary. The market research reports provide a complete competitive landscape and an in-depth vendor selection methodology and analysis using qualitative and quantitative research to forecast the accurate market growth.
Table of Contents
1 Executive Summary
- 1.1 Market overview
- Executive Summary - Chart on Market Overview
- Executive Summary - Data Table on Market Overview
- Executive Summary - Chart on Global Market Characteristics
- Executive Summary - Chart on Market By Geographical Landscape
- Executive Summary - Chart on Market Segmentation by Application
- Executive Summary - Chart on Market Segmentation by End-user
- Executive Summary - Chart on Incremental Growth
- Executive Summary - Data Table on Incremental Growth
- Executive Summary - Chart on Company Market Positioning
2 Market Landscape
- 2.1 Market ecosystem
- Parent Market
- Data Table on - Parent Market
- 2.2 Market characteristics
- Market characteristics analysis
- 2.3 Value chain analysis
- Value Chain Analysis
3 Market Sizing
- 3.1 Market definition
- Offerings of companies included in the market definition
- 3.2 Market segment analysis
- Market segments
- 3.3 Market size 2023
- 3.4 Market outlook: Forecast for 2023-2028
- Chart on Global - Market size and forecast 2023-2028 ($ million)
- Data Table on Global - Market size and forecast 2023-2028 ($ million)
- Chart on Global Market: Year-over-year growth 2023-2028 (%)
- Data Table on Global Market: Year-over-year growth 2023-2028 (%)
4 Historic Market Size
- 4.1 Global Dental Cone Beam Computed Tomography (CBCT) Market 2018 - 2022
- Historic Market Size - Data Table on Global Dental Cone Beam Computed Tomography (CBCT) Market 2018 - 2022 ($ million)
- 4.2 Application segment analysis 2018 - 2022
- Historic Market Size - Application Segment 2018 - 2022 ($ million)
- 4.3 End-user segment analysis 2018 - 2022
- Historic Market Size - End-user Segment 2018 - 2022 ($ million)
- 4.4 Geography segment analysis 2018 - 2022
- Historic Market Size - Geography Segment 2018 - 2022 ($ million)
- 4.5 Country segment analysis 2018 - 2022
- Historic Market Size - Country Segment 2018 - 2022 ($ million)
5 Five Forces Analysis
- 5.1 Five forces summary
- Five forces analysis - Comparison between 2023 and 2028
- 5.2 Bargaining power of buyers
- Bargaining power of buyers - Impact of key factors 2023 and 2028
- 5.3 Bargaining power of suppliers
- Bargaining power of suppliers - Impact of key factors in 2023 and 2028
- 5.4 Threat of new entrants
- Threat of new entrants - Impact of key factors in 2023 and 2028
- 5.5 Threat of substitutes
- Threat of substitutes - Impact of key factors in 2023 and 2028
- 5.6 Threat of rivalry
- Threat of rivalry - Impact of key factors in 2023 and 2028
- 5.7 Market condition
- Chart on Market condition - Five forces 2023 and 2028
6 Market Segmentation by Application
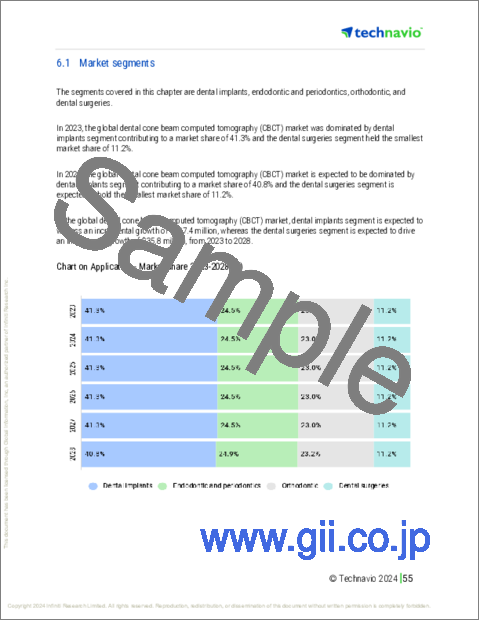
- 6.1 Market segments
- Chart on Application - Market share 2023-2028 (%)
- Data Table on Application - Market share 2023-2028 (%)
- 6.2 Comparison by Application
- Chart on Comparison by Application
- Data Table on Comparison by Application
- 6.3 Dental implants - Market size and forecast 2023-2028
- Chart on Dental implants - Market size and forecast 2023-2028 ($ million)
- Data Table on Dental implants - Market size and forecast 2023-2028 ($ million)
- Chart on Dental implants - Year-over-year growth 2023-2028 (%)
- Data Table on Dental implants - Year-over-year growth 2023-2028 (%)
- 6.4 Endodontic and periodontics - Market size and forecast 2023-2028
- Chart on Endodontic and periodontics - Market size and forecast 2023-2028 ($ million)
- Data Table on Endodontic and periodontics - Market size and forecast 2023-2028 ($ million)
- Chart on Endodontic and periodontics - Year-over-year growth 2023-2028 (%)
- Data Table on Endodontic and periodontics - Year-over-year growth 2023-2028 (%)
- 6.5 Orthodontic - Market size and forecast 2023-2028
- Chart on Orthodontic - Market size and forecast 2023-2028 ($ million)
- Data Table on Orthodontic - Market size and forecast 2023-2028 ($ million)
- Chart on Orthodontic - Year-over-year growth 2023-2028 (%)
- Data Table on Orthodontic - Year-over-year growth 2023-2028 (%)
- 6.6 Dental surgeries - Market size and forecast 2023-2028
- Chart on Dental surgeries - Market size and forecast 2023-2028 ($ million)
- Data Table on Dental surgeries - Market size and forecast 2023-2028 ($ million)
- Chart on Dental surgeries - Year-over-year growth 2023-2028 (%)
- Data Table on Dental surgeries - Year-over-year growth 2023-2028 (%)
- 6.7 Market opportunity by Application
- Market opportunity by Application ($ million)
- Data Table on Market opportunity by Application ($ million)
7 Market Segmentation by End-user
- 7.1 Market segments
- Chart on End-user - Market share 2023-2028 (%)
- Data Table on End-user - Market share 2023-2028 (%)
- 7.2 Comparison by End-user
- Chart on Comparison by End-user
- Data Table on Comparison by End-user
- 7.3 Hospitals - Market size and forecast 2023-2028
- Chart on Hospitals - Market size and forecast 2023-2028 ($ million)
- Data Table on Hospitals - Market size and forecast 2023-2028 ($ million)
- Chart on Hospitals - Year-over-year growth 2023-2028 (%)
- Data Table on Hospitals - Year-over-year growth 2023-2028 (%)
- 7.4 Dental clinics and laboratories - Market size and forecast 2023-2028
- Chart on Dental clinics and laboratories - Market size and forecast 2023-2028 ($ million)
- Data Table on Dental clinics and laboratories - Market size and forecast 2023-2028 ($ million)
- Chart on Dental clinics and laboratories - Year-over-year growth 2023-2028 (%)
- Data Table on Dental clinics and laboratories - Year-over-year growth 2023-2028 (%)
- 7.5 Market opportunity by End-user
- Market opportunity by End-user ($ million)
- Data Table on Market opportunity by End-user ($ million)
8 Customer Landscape
- 8.1 Customer landscape overview
- Analysis of price sensitivity, lifecycle, customer purchase basket, adoption rates, and purchase criteria
9 Geographic Landscape
- 9.1 Geographic segmentation
- Chart on Market share By Geographical Landscape 2023-2028 (%)
- Data Table on Market share By Geographical Landscape 2023-2028 (%)
- 9.2 Geographic comparison
- Chart on Geographic comparison
- Data Table on Geographic comparison
- 9.3 North America - Market size and forecast 2023-2028
- Chart on North America - Market size and forecast 2023-2028 ($ million)
- Data Table on North America - Market size and forecast 2023-2028 ($ million)
- Chart on North America - Year-over-year growth 2023-2028 (%)
- Data Table on North America - Year-over-year growth 2023-2028 (%)
- 9.4 Europe - Market size and forecast 2023-2028
- Chart on Europe - Market size and forecast 2023-2028 ($ million)
- Data Table on Europe - Market size and forecast 2023-2028 ($ million)
- Chart on Europe - Year-over-year growth 2023-2028 (%)
- Data Table on Europe - Year-over-year growth 2023-2028 (%)
- 9.5 Asia - Market size and forecast 2023-2028
- Chart on Asia - Market size and forecast 2023-2028 ($ million)
- Data Table on Asia - Market size and forecast 2023-2028 ($ million)
- Chart on Asia - Year-over-year growth 2023-2028 (%)
- Data Table on Asia - Year-over-year growth 2023-2028 (%)
- 9.6 Rest of World (ROW) - Market size and forecast 2023-2028
- Chart on Rest of World (ROW) - Market size and forecast 2023-2028 ($ million)
- Data Table on Rest of World (ROW) - Market size and forecast 2023-2028 ($ million)
- Chart on Rest of World (ROW) - Year-over-year growth 2023-2028 (%)
- Data Table on Rest of World (ROW) - Year-over-year growth 2023-2028 (%)
- 9.7 US - Market size and forecast 2023-2028
- Chart on US - Market size and forecast 2023-2028 ($ million)
- Data Table on US - Market size and forecast 2023-2028 ($ million)
- Chart on US - Year-over-year growth 2023-2028 (%)
- Data Table on US - Year-over-year growth 2023-2028 (%)
- 9.8 Germany - Market size and forecast 2023-2028
- Chart on Germany - Market size and forecast 2023-2028 ($ million)
- Data Table on Germany - Market size and forecast 2023-2028 ($ million)
- Chart on Germany - Year-over-year growth 2023-2028 (%)
- Data Table on Germany - Year-over-year growth 2023-2028 (%)
- 9.9 UK - Market size and forecast 2023-2028
- Chart on UK - Market size and forecast 2023-2028 ($ million)
- Data Table on UK - Market size and forecast 2023-2028 ($ million)
- Chart on UK - Year-over-year growth 2023-2028 (%)
- Data Table on UK - Year-over-year growth 2023-2028 (%)
- 9.10 China - Market size and forecast 2023-2028
- Chart on China - Market size and forecast 2023-2028 ($ million)
- Data Table on China - Market size and forecast 2023-2028 ($ million)
- Chart on China - Year-over-year growth 2023-2028 (%)
- Data Table on China - Year-over-year growth 2023-2028 (%)
- 9.11 Japan - Market size and forecast 2023-2028
- Chart on Japan - Market size and forecast 2023-2028 ($ million)
- Data Table on Japan - Market size and forecast 2023-2028 ($ million)
- Chart on Japan - Year-over-year growth 2023-2028 (%)
- Data Table on Japan - Year-over-year growth 2023-2028 (%)
- 9.12 Market opportunity By Geographical Landscape
- Market opportunity By Geographical Landscape ($ million)
- Data Tables on Market opportunity By Geographical Landscape ($ million)
10 Drivers, Challenges, and Opportunity/Restraints
- 10.1 Market drivers
- 10.2 Market challenges
- 10.3 Impact of drivers and challenges
- Impact of drivers and challenges in 2023 and 2028
- 10.4 Market opportunities/restraints
11 Competitive Landscape
- 11.1 Overview
- 11.2 Competitive Landscape
- Overview on criticality of inputs and factors of differentiation
- 11.3 Landscape disruption
- Overview on factors of disruption
- 11.4 Industry risks
- Impact of key risks on business
12 Competitive Analysis
- 12.1 Companies profiled
- Companies covered
- 12.2 Market positioning of companies
- Matrix on companies position and classification
- 12.3 Air Techniques Inc.
- Air Techniques Inc. - Overview
- Air Techniques Inc. - Product / Service
- Air Techniques Inc. - Key offerings
- 12.4 Asahi Roentgen Ind. Co. Ltd
- Asahi Roentgen Ind. Co. Ltd - Overview
- Asahi Roentgen Ind. Co. Ltd - Product / Service
- Asahi Roentgen Ind. Co. Ltd - Key offerings
- 12.5 Carestream Health Inc.
- Carestream Health Inc. - Overview
- Carestream Health Inc. - Product / Service
- Carestream Health Inc. - Key offerings
- 12.6 Cefla SC
- Cefla SC - Overview
- Cefla SC - Product / Service
- Cefla SC - Key offerings
- 12.7 Dentium Co. Ltd.
- Dentium Co. Ltd. - Overview
- Dentium Co. Ltd. - Product / Service
- Dentium Co. Ltd. - Key offerings
- 12.8 Dentsply Sirona Inc.
- Dentsply Sirona Inc. - Overview
- Dentsply Sirona Inc. - Business segments
- Dentsply Sirona Inc. - Key news
- Dentsply Sirona Inc. - Key offerings
- Dentsply Sirona Inc. - Segment focus
- 12.9 Durr Dental SE
- Durr Dental SE - Overview
- Durr Dental SE - Product / Service
- Durr Dental SE - Key offerings
- 12.10 Envista Holdings Corp.
- Envista Holdings Corp. - Overview
- Envista Holdings Corp. - Business segments
- Envista Holdings Corp. - Key news
- Envista Holdings Corp. - Key offerings
- Envista Holdings Corp. - Segment focus
- 12.11 Finapoline SAS
- Finapoline SAS - Overview
- Finapoline SAS - Product / Service
- Finapoline SAS - Key offerings
- 12.12 GENORAY Co. Ltd.
- GENORAY Co. Ltd. - Overview
- GENORAY Co. Ltd. - Product / Service
- GENORAY Co. Ltd. - Key offerings
- 12.13 J. Morita Corp.
- J. Morita Corp. - Overview
- J. Morita Corp. - Product / Service
- J. Morita Corp. - Key offerings
- 12.14 Owandy Radiology
- Owandy Radiology - Overview
- Owandy Radiology - Product / Service
- Owandy Radiology - Key offerings
- 12.15 Planmeca Oy
- Planmeca Oy - Overview
- Planmeca Oy - Product / Service
- Planmeca Oy - Key offerings
- 12.16 PreXion Corp.
- PreXion Corp. - Overview
- PreXion Corp. - Product / Service
- PreXion Corp. - Key offerings
- 12.17 Vatech Co. Ltd.
- Vatech Co. Ltd. - Overview
- Vatech Co. Ltd. - Product / Service
- Vatech Co. Ltd. - Key offerings
13 Appendix
- 13.1 Scope of the report
- 13.2 Inclusions and exclusions checklist
- Inclusions checklist
- Exclusions checklist
- 13.3 Currency conversion rates for US$
- Currency conversion rates for US$
- 13.4 Research methodology
- Research methodology
- 13.5 Data procurement
- Information sources
- 13.6 Data validation
- Data validation
- 13.7 Validation techniques employed for market sizing
- Validation techniques employed for market sizing
- 13.8 Data synthesis
- Data synthesis
- 13.9 360 degree market analysis
- 360 degree market analysis
- 13.10 List of abbreviations
- List of abbreviations

