|
|
市場調査レポート
商品コード
1645411
炭素繊維の世界市場 (2025~2029年)Global Carbon Fiber Market 2025-2029 |
||||||

|
|||||||
カスタマイズ可能
|
|||||||


| 炭素繊維の世界市場 (2025~2029年) |
|
出版日: 2025年01月09日
発行: TechNavio
ページ情報: 英文 214 Pages
納期: 即納可能
|

全表示
- 概要
- 図表
- 目次
炭素繊維市場は2024~2029年に26億5,480万米ドル、予測期間中のCAGRは6.5%で成長すると予測されています。
この調査レポートは、炭素繊維市場の全体分析、市場規模・予測、動向、成長促進要因、課題、約25のベンダーを網羅したベンダー分析などを掲載しています。
現在の市場シナリオ、最新動向と促進要因、市場環境全体に関する最新分析を提供しています。同市場は、航空宇宙・防衛分野での炭素繊維使用の増加、風力発電設備の成長、世界の炭素繊維市場における提携やパートナーシップの増加によって牽引されています。
| 市場範囲 | |
|---|---|
| 基準年 | 2025年 |
| 終了年 | 2029年 |
| 予測期間 | 2025~2029年 |
| 成長モメンタム | 加速 |
| 前年比2025年 | 6.1% |
| CAGR | 6.5% |
| 増分額 | 26億5,480万米ドル |
本調査では、炭素繊維リサイクル技術の進歩が、今後数年間の炭素繊維市場成長を牽引する主要因の一つであると指摘しています。また、軽量で高性能な素材への需要の増加や風力エネルギー分野からの需要の増加は、市場の大きな需要につながります。
目次
第1章 エグゼクティブサマリー
- 市場概要
第2章 Technavioの分析
- 価格感度・ライフサイクル・顧客購入バスケット・採用率・購入基準の分析
- インプットの重要性と差別化の要因
- ディスラプションの要因
- 促進要因と課題の影響
第3章 市場情勢
- 市場エコシステム
- 市場の特徴
- バリューチェーン分析
第4章 市場規模
- 市場の定義
- 市場セグメント分析
- 市場規模 (2024年)
- 市場展望 (2024~2029年)
第5章 市場規模実績
- 炭素繊維の世界市場 (2019~2023年)
- エンドユーザー別セグメント分析 (2019~2023年)
- 原材料別セグメント分析 (2019~2023年)
- 地域別セグメント分析 (2019~2023年)
- 国別セグメント分析 (2019~2023年)
第6章 定性分析
- AIの影響:炭素繊維の世界市場
第7章 ファイブフォース分析
- ファイブフォースの要約
- 買い手の交渉力
- 供給企業の交渉力
- 新規参入業者の脅威
- 代替品の脅威
- 競争の脅威
- 市況
第8章 市場セグメンテーション:エンドユーザー別
- 市場セグメント
- 比較:エンドユーザー別
- 航空宇宙・防衛:市場規模と予測 (2024~2029年)
- スポーツ・レジャー:市場規模と予測 (2024~2029年)
- 風力エネルギー:市場規模と予測 (2024~2029年)
- 自動車:市場規模と予測 (2024~2029年)
- その他:市場規模と予測 (2024~2029年)
- 市場機会:エンドユーザー別
第9章 市場セグメンテーション:原材料別
- 市場セグメント
- 比較:原材料別
- PANベース:市場規模と予測 (2024~2029年)
- ピッチベース:市場規模と予測 (2024~2029年)
- レーヨンベース:市場規模と予測 (2024~2029年)
- 市場機会:原材料別
第10章 顧客情勢
- 顧客情勢の概要
第11章 地域別情勢
- 地域別セグメンテーション
- 地域別比較
- 北米:市場規模と予測 (2024~2029年)
- 欧州:市場規模と予測 (2024~2029年)
- アジア太平洋:市場規模と予測 (2024~2029年)
- 南米:市場規模と予測 (2024~2029年)
- 中東・アフリカ:市場規模と予測 (2024~2029年)
- 米国:市場規模と予測 (2024~2029年)
- 中国:市場規模と予測 (2024~2029年)
- インド:市場規模と予測 (2024~2029年)
- ドイツ:市場規模と予測 (2024~2029年)
- カナダ:市場規模と予測 (2024~2029年)
- ロシア:市場規模と予測 (2024~2029年)
- 英国:市場規模と予測 (2024~2029年)
- 日本:市場規模と予測 (2024~2029年)
- 韓国:市場規模と予測 (2024~2029年)
- フランス:市場規模と予測 (2024~2029年)
- 市場機会:地域情勢別
第12章 促進要因・課題・機会・抑制要因
- 市場促進要因
- 市場の課題
- 促進要因と課題の影響
- 市場の機会・抑制要因
第13章 競合情勢
- 概要
- 競合情勢
- ディスラプションの状況
- 業界のリスク
第14章 競合分析
- 企業プロファイル
- 企業ランキング指数
- 企業の市場ポジショニング
- China Composites Group Corp. Ltd.
- DowAksa
- Formosa M Co. Ltd.
- Hexcel Corp.
- Hyosung Advanced Materials
- Kureha Corp.
- Mitsubishi Chemical Corp.
- Nippon Steel Corp.
- Osaka Gas Co. Ltd.
- Saudi Arabian Oil Co.
- SGL Carbon SE
- SIMCO Global Technology and Systems Ltd.
- Solvay SA
- Teijin Ltd.
- Toray Industries Inc.
第15章 付録
Exhibits:
- Exhibits1: Executive Summary - Chart on Market Overview
- Exhibits2: Executive Summary - Data Table on Market Overview
- Exhibits3: Executive Summary - Chart on Global Market Characteristics
- Exhibits4: Executive Summary - Chart on Market By Geographical Landscape
- Exhibits5: Executive Summary - Chart on Market Segmentation by End-user
- Exhibits6: Executive Summary - Chart on Market Segmentation by Raw Material
- Exhibits7: Executive Summary - Chart on Incremental Growth
- Exhibits8: Executive Summary - Data Table on Incremental Growth
- Exhibits9: Executive Summary - Chart on Company Market Positioning
- Exhibits10: Analysis of price sensitivity, lifecycle, customer purchase basket, adoption rates, and purchase criteria
- Exhibits11: Overview on criticality of inputs and factors of differentiation
- Exhibits12: Overview on factors of disruption
- Exhibits13: Impact of drivers and challenges in 2024 and 2029
- Exhibits14: Parent Market
- Exhibits15: Data Table on - Parent Market
- Exhibits16: Market characteristics analysis
- Exhibits17: Value chain analysis
- Exhibits18: Offerings of companies included in the market definition
- Exhibits19: Market segments
- Exhibits20: Chart on Global - Market size and forecast 2024-2029 ($ million)
- Exhibits21: Data Table on Global - Market size and forecast 2024-2029 ($ million)
- Exhibits22: Chart on Global Market: Year-over-year growth 2024-2029 (%)
- Exhibits23: Data Table on Global Market: Year-over-year growth 2024-2029 (%)
- Exhibits24: Historic Market Size - Data Table on Global Carbon Fiber Market 2019 - 2023 ($ million)
- Exhibits25: Historic Market Size - End-user Segment 2019 - 2023 ($ million)
- Exhibits26: Historic Market Size - Raw Material Segment 2019 - 2023 ($ million)
- Exhibits27: Historic Market Size - Geography Segment 2019 - 2023 ($ million)
- Exhibits28: Historic Market Size - Country Segment 2019 - 2023 ($ million)
- Exhibits29: Five forces analysis - Comparison between 2024 and 2029
- Exhibits30: Bargaining power of buyers - Impact of key factors 2024 and 2029
- Exhibits31: Bargaining power of suppliers - Impact of key factors in 2024 and 2029
- Exhibits32: Threat of new entrants - Impact of key factors in 2024 and 2029
- Exhibits33: Threat of substitutes - Impact of key factors in 2024 and 2029
- Exhibits34: Threat of rivalry - Impact of key factors in 2024 and 2029
- Exhibits35: Chart on Market condition - Five forces 2024 and 2029
- Exhibits36: Chart on End-user - Market share 2024-2029 (%)
- Exhibits37: Data Table on End-user - Market share 2024-2029 (%)
- Exhibits38: Chart on Comparison by End-user
- Exhibits39: Data Table on Comparison by End-user
- Exhibits40: Chart on Aerospace and defense - Market size and forecast 2024-2029 ($ million)
- Exhibits41: Data Table on Aerospace and defense - Market size and forecast 2024-2029 ($ million)
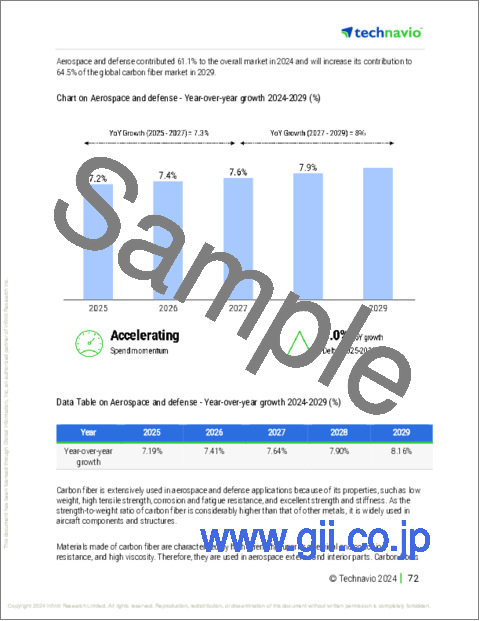
- Exhibits42: Chart on Aerospace and defense - Year-over-year growth 2024-2029 (%)
- Exhibits43: Data Table on Aerospace and defense - Year-over-year growth 2024-2029 (%)
- Exhibits44: Chart on Sports and leisure - Market size and forecast 2024-2029 ($ million)
- Exhibits45: Data Table on Sports and leisure - Market size and forecast 2024-2029 ($ million)
- Exhibits46: Chart on Sports and leisure - Year-over-year growth 2024-2029 (%)
- Exhibits47: Data Table on Sports and leisure - Year-over-year growth 2024-2029 (%)
- Exhibits48: Chart on Wind energy - Market size and forecast 2024-2029 ($ million)
- Exhibits49: Data Table on Wind energy - Market size and forecast 2024-2029 ($ million)
- Exhibits50: Chart on Wind energy - Year-over-year growth 2024-2029 (%)
- Exhibits51: Data Table on Wind energy - Year-over-year growth 2024-2029 (%)
- Exhibits52: Chart on Automotive - Market size and forecast 2024-2029 ($ million)
- Exhibits53: Data Table on Automotive - Market size and forecast 2024-2029 ($ million)
- Exhibits54: Chart on Automotive - Year-over-year growth 2024-2029 (%)
- Exhibits55: Data Table on Automotive - Year-over-year growth 2024-2029 (%)
- Exhibits56: Chart on Others - Market size and forecast 2024-2029 ($ million)
- Exhibits57: Data Table on Others - Market size and forecast 2024-2029 ($ million)
- Exhibits58: Chart on Others - Year-over-year growth 2024-2029 (%)
- Exhibits59: Data Table on Others - Year-over-year growth 2024-2029 (%)
- Exhibits60: Market opportunity by End-user ($ million)
- Exhibits61: Data Table on Market opportunity by End-user ($ million)
- Exhibits62: Chart on Raw Material - Market share 2024-2029 (%)
- Exhibits63: Data Table on Raw Material - Market share 2024-2029 (%)
- Exhibits64: Chart on Comparison by Raw Material
- Exhibits65: Data Table on Comparison by Raw Material
- Exhibits66: Chart on PAN-based - Market size and forecast 2024-2029 ($ million)
- Exhibits67: Data Table on PAN-based - Market size and forecast 2024-2029 ($ million)
- Exhibits68: Chart on PAN-based - Year-over-year growth 2024-2029 (%)
- Exhibits69: Data Table on PAN-based - Year-over-year growth 2024-2029 (%)
- Exhibits70: Chart on Pitch-based - Market size and forecast 2024-2029 ($ million)
- Exhibits71: Data Table on Pitch-based - Market size and forecast 2024-2029 ($ million)
- Exhibits72: Chart on Pitch-based - Year-over-year growth 2024-2029 (%)
- Exhibits73: Data Table on Pitch-based - Year-over-year growth 2024-2029 (%)
- Exhibits74: Chart on Rayon-based - Market size and forecast 2024-2029 ($ million)
- Exhibits75: Data Table on Rayon-based - Market size and forecast 2024-2029 ($ million)
- Exhibits76: Chart on Rayon-based - Year-over-year growth 2024-2029 (%)
- Exhibits77: Data Table on Rayon-based - Year-over-year growth 2024-2029 (%)
- Exhibits78: Market opportunity by Raw Material ($ million)
- Exhibits79: Data Table on Market opportunity by Raw Material ($ million)
- Exhibits80: Analysis of price sensitivity, lifecycle, customer purchase basket, adoption rates, and purchase criteria
- Exhibits81: Chart on Market share By Geographical Landscape 2024-2029 (%)
- Exhibits82: Data Table on Market share By Geographical Landscape 2024-2029 (%)
- Exhibits83: Chart on Geographic comparison
- Exhibits84: Data Table on Geographic comparison
- Exhibits85: Chart on North America - Market size and forecast 2024-2029 ($ million)
- Exhibits86: Data Table on North America - Market size and forecast 2024-2029 ($ million)
- Exhibits87: Chart on North America - Year-over-year growth 2024-2029 (%)
- Exhibits88: Data Table on North America - Year-over-year growth 2024-2029 (%)
- Exhibits89: Chart on Europe - Market size and forecast 2024-2029 ($ million)
- Exhibits90: Data Table on Europe - Market size and forecast 2024-2029 ($ million)
- Exhibits91: Chart on Europe - Year-over-year growth 2024-2029 (%)
- Exhibits92: Data Table on Europe - Year-over-year growth 2024-2029 (%)
- Exhibits93: Chart on APAC - Market size and forecast 2024-2029 ($ million)
- Exhibits94: Data Table on APAC - Market size and forecast 2024-2029 ($ million)
- Exhibits95: Chart on APAC - Year-over-year growth 2024-2029 (%)
- Exhibits96: Data Table on APAC - Year-over-year growth 2024-2029 (%)
- Exhibits97: Chart on South America - Market size and forecast 2024-2029 ($ million)
- Exhibits98: Data Table on South America - Market size and forecast 2024-2029 ($ million)
- Exhibits99: Chart on South America - Year-over-year growth 2024-2029 (%)
- Exhibits100: Data Table on South America - Year-over-year growth 2024-2029 (%)
- Exhibits101: Chart on Middle East and Africa - Market size and forecast 2024-2029 ($ million)
- Exhibits102: Data Table on Middle East and Africa - Market size and forecast 2024-2029 ($ million)
- Exhibits103: Chart on Middle East and Africa - Year-over-year growth 2024-2029 (%)
- Exhibits104: Data Table on Middle East and Africa - Year-over-year growth 2024-2029 (%)
- Exhibits105: Chart on US - Market size and forecast 2024-2029 ($ million)
- Exhibits106: Data Table on US - Market size and forecast 2024-2029 ($ million)
- Exhibits107: Chart on US - Year-over-year growth 2024-2029 (%)
- Exhibits108: Data Table on US - Year-over-year growth 2024-2029 (%)
- Exhibits109: Chart on China - Market size and forecast 2024-2029 ($ million)
- Exhibits110: Data Table on China - Market size and forecast 2024-2029 ($ million)
- Exhibits111: Chart on China - Year-over-year growth 2024-2029 (%)
- Exhibits112: Data Table on China - Year-over-year growth 2024-2029 (%)
- Exhibits113: Chart on India - Market size and forecast 2024-2029 ($ million)
- Exhibits114: Data Table on India - Market size and forecast 2024-2029 ($ million)
- Exhibits115: Chart on India - Year-over-year growth 2024-2029 (%)
- Exhibits116: Data Table on India - Year-over-year growth 2024-2029 (%)
- Exhibits117: Chart on Germany - Market size and forecast 2024-2029 ($ million)
- Exhibits118: Data Table on Germany - Market size and forecast 2024-2029 ($ million)
- Exhibits119: Chart on Germany - Year-over-year growth 2024-2029 (%)
- Exhibits120: Data Table on Germany - Year-over-year growth 2024-2029 (%)
- Exhibits121: Chart on Canada - Market size and forecast 2024-2029 ($ million)
- Exhibits122: Data Table on Canada - Market size and forecast 2024-2029 ($ million)
- Exhibits123: Chart on Canada - Year-over-year growth 2024-2029 (%)
- Exhibits124: Data Table on Canada - Year-over-year growth 2024-2029 (%)
- Exhibits125: Chart on Russia - Market size and forecast 2024-2029 ($ million)
- Exhibits126: Data Table on Russia - Market size and forecast 2024-2029 ($ million)
- Exhibits127: Chart on Russia - Year-over-year growth 2024-2029 (%)
- Exhibits128: Data Table on Russia - Year-over-year growth 2024-2029 (%)
- Exhibits129: Chart on UK - Market size and forecast 2024-2029 ($ million)
- Exhibits130: Data Table on UK - Market size and forecast 2024-2029 ($ million)
- Exhibits131: Chart on UK - Year-over-year growth 2024-2029 (%)
- Exhibits132: Data Table on UK - Year-over-year growth 2024-2029 (%)
- Exhibits133: Chart on Japan - Market size and forecast 2024-2029 ($ million)
- Exhibits134: Data Table on Japan - Market size and forecast 2024-2029 ($ million)
- Exhibits135: Chart on Japan - Year-over-year growth 2024-2029 (%)
- Exhibits136: Data Table on Japan - Year-over-year growth 2024-2029 (%)
- Exhibits137: Chart on South Korea - Market size and forecast 2024-2029 ($ million)
- Exhibits138: Data Table on South Korea - Market size and forecast 2024-2029 ($ million)
- Exhibits139: Chart on South Korea - Year-over-year growth 2024-2029 (%)
- Exhibits140: Data Table on South Korea - Year-over-year growth 2024-2029 (%)
- Exhibits141: Chart on France - Market size and forecast 2024-2029 ($ million)
- Exhibits142: Data Table on France - Market size and forecast 2024-2029 ($ million)
- Exhibits143: Chart on France - Year-over-year growth 2024-2029 (%)
- Exhibits144: Data Table on France - Year-over-year growth 2024-2029 (%)
- Exhibits145: Market opportunity By Geographical Landscape ($ million)
- Exhibits146: Data Tables on Market opportunity By Geographical Landscape ($ million)
- Exhibits147: Impact of drivers and challenges in 2024 and 2029
- Exhibits148: Overview on criticality of inputs and factors of differentiation
- Exhibits149: Overview on factors of disruption
- Exhibits150: Impact of key risks on business
- Exhibits151: Companies covered
- Exhibits152: Company ranking index
- Exhibits153: Matrix on companies position and classification
- Exhibits154: China Composites Group Corp. Ltd. - Overview
- Exhibits155: China Composites Group Corp. Ltd. - Product / Service
- Exhibits156: China Composites Group Corp. Ltd. - Key offerings
- Exhibits157: SWOT
- Exhibits158: DowAksa - Overview
- Exhibits159: DowAksa - Product / Service
- Exhibits160: DowAksa - Key offerings
- Exhibits161: SWOT
- Exhibits162: Formosa M Co. Ltd. - Overview
- Exhibits163: Formosa M Co. Ltd. - Product / Service
- Exhibits164: Formosa M Co. Ltd. - Key offerings
- Exhibits165: SWOT
- Exhibits166: Hexcel Corp. - Overview
- Exhibits167: Hexcel Corp. - Business segments
- Exhibits168: Hexcel Corp. - Key news
- Exhibits169: Hexcel Corp. - Key offerings
- Exhibits170: Hexcel Corp. - Segment focus
- Exhibits171: SWOT
- Exhibits172: Hyosung Advanced Materials - Overview
- Exhibits173: Hyosung Advanced Materials - Product / Service
- Exhibits174: Hyosung Advanced Materials - Key offerings
- Exhibits175: SWOT
- Exhibits176: Kureha Corp. - Overview
- Exhibits177: Kureha Corp. - Business segments
- Exhibits178: Kureha Corp. - Key news
- Exhibits179: Kureha Corp. - Key offerings
- Exhibits180: Kureha Corp. - Segment focus
- Exhibits181: SWOT
- Exhibits182: Mitsubishi Chemical Corp. - Overview
- Exhibits183: Mitsubishi Chemical Corp. - Business segments
- Exhibits184: Mitsubishi Chemical Corp. - Key offerings
- Exhibits185: Mitsubishi Chemical Corp. - Segment focus
- Exhibits186: SWOT
- Exhibits187: Nippon Steel Corp. - Overview
- Exhibits188: Nippon Steel Corp. - Business segments
- Exhibits189: Nippon Steel Corp. - Key news
- Exhibits190: Nippon Steel Corp. - Key offerings
- Exhibits191: Nippon Steel Corp. - Segment focus
- Exhibits192: SWOT
- Exhibits193: Osaka Gas Co. Ltd. - Overview
- Exhibits194: Osaka Gas Co. Ltd. - Business segments
- Exhibits195: Osaka Gas Co. Ltd. - Key offerings
- Exhibits196: Osaka Gas Co. Ltd. - Segment focus
- Exhibits197: SWOT
- Exhibits198: Saudi Arabian Oil Co. - Overview
- Exhibits199: Saudi Arabian Oil Co. - Product / Service
- Exhibits200: Saudi Arabian Oil Co. - Key offerings
- Exhibits201: SWOT
- Exhibits202: SGL Carbon SE - Overview
- Exhibits203: SGL Carbon SE - Business segments
- Exhibits204: SGL Carbon SE - Key news
- Exhibits205: SGL Carbon SE - Key offerings
- Exhibits206: SGL Carbon SE - Segment focus
- Exhibits207: SWOT
- Exhibits208: SIMCO Global Technology and Systems Ltd. - Overview
- Exhibits209: SIMCO Global Technology and Systems Ltd. - Product / Service
- Exhibits210: SIMCO Global Technology and Systems Ltd. - Key offerings
- Exhibits211: SWOT
- Exhibits212: Solvay SA - Overview
- Exhibits213: Solvay SA - Business segments
- Exhibits214: Solvay SA - Key news
- Exhibits215: Solvay SA - Key offerings
- Exhibits216: Solvay SA - Segment focus
- Exhibits217: SWOT
- Exhibits218: Teijin Ltd. - Overview
- Exhibits219: Teijin Ltd. - Business segments
- Exhibits220: Teijin Ltd. - Key news
- Exhibits221: Teijin Ltd. - Key offerings
- Exhibits222: Teijin Ltd. - Segment focus
- Exhibits223: SWOT
- Exhibits224: Toray Industries Inc. - Overview
- Exhibits225: Toray Industries Inc. - Business segments
- Exhibits226: Toray Industries Inc. - Key news
- Exhibits227: Toray Industries Inc. - Key offerings
- Exhibits228: Toray Industries Inc. - Segment focus
- Exhibits229: SWOT
- Exhibits230: Inclusions checklist
- Exhibits231: Exclusions checklist
- Exhibits232: Currency conversion rates for US$
- Exhibits233: Research methodology
- Exhibits234: Information sources
- Exhibits235: Data validation
- Exhibits236: Validation techniques employed for market sizing
- Exhibits237: Data synthesis
- Exhibits238: 360 degree market analysis
- Exhibits239: List of abbreviations
The carbon fiber market is forecasted to grow by $ 2654.8 mn during 2024-2029, accelerating at a CAGR of 6.5% during the forecast period. The report on the carbon fiber market provides a holistic analysis, market size and forecast, trends, growth drivers, and challenges, as well as vendor analysis covering around 25 vendors.
The report offers an up-to-date analysis regarding the current market scenario, the latest trends and drivers, and the overall market environment. The market is driven by increasing use of carbon fibers in aerospace and defense sector, growth of wind power capacities, and increasing collaborations and partnerships in global carbon fiber market.
| Market Scope | |
|---|---|
| Base Year | 2025 |
| End Year | 2029 |
| Series Year | 2025-2029 |
| Growth Momentum | Accelerate |
| YOY 2025 | 6.1% |
| CAGR | 6.5% |
| Incremental Value | $2654.8 mn |
Technavio's carbon fiber market is segmented as below:
By End-user
- Aerospace and defense
- Sports and leisure
- Wind energy
- Automotive
- Others
By Raw Material
- PAN-based
- Pitch-based
- Rayon-based
By Geographical Landscape
- North America
- Europe
- APAC
- South America
- Middle East and Africa
This study identifies the advancements in carbon fiber recycling technologies as one of the prime reasons driving the carbon fiber market growth during the next few years. Also, increasing demand for lightweight and high-performance materials and rise in demand from wind energy sector will lead to sizable demand in the market.
The report on the carbon fiber market covers the following areas:
- Carbon Fiber Market sizing
- Carbon Fiber Market forecast
- Carbon Fiber Market industry analysis
The robust vendor analysis is designed to help clients improve their market position, and in line with this, this report provides a detailed analysis of several leading carbon fiber market vendors that include 3M Co., China Composites Group Corp. Ltd., DowAksa, Evonik Industries AG, Formosa M Co. Ltd., Hexcel Corp., Hyosung Advanced Materials, Kordcarbon AS, Kureha Corp., Mitsubishi Chemical Corp., Nippon Steel Corp., Osaka Gas Co. Ltd., Saudi Arabian Oil Co., SGL Carbon SE, SIMCO Global Technology and Systems Ltd., Solvay SA, Taekwang Group, Teijin Ltd., Toray Industries Inc., and UMATEX ROSATOM State Corp.. Also, the carbon fiber market analysis report includes information on upcoming trends and challenges that will influence market growth. This is to help companies strategize and leverage all forthcoming growth opportunities.
The study was conducted using an objective combination of primary and secondary information including inputs from key participants in the industry. The report contains a comprehensive market and vendor landscape in addition to an analysis of the key vendors.
The publisher presents a detailed picture of the market by the way of study, synthesis, and summation of data from multiple sources by an analysis of key parameters such as profit, pricing, competition, and promotions. It presents various market facets by identifying the key industry influencers. The data presented is comprehensive, reliable, and a result of extensive primary and secondary research. The market research reports provide a complete competitive landscape and an in-depth vendor selection methodology and analysis using qualitative and quantitative research to forecast accurate market growth.
Table of Contents
1 Executive Summary
- 1.1 Market overview
- Executive Summary - Chart on Market Overview
- Executive Summary - Data Table on Market Overview
- Executive Summary - Chart on Global Market Characteristics
- Executive Summary - Chart on Market By Geographical Landscape
- Executive Summary - Chart on Market Segmentation by End-user
- Executive Summary - Chart on Market Segmentation by Raw Material
- Executive Summary - Chart on Incremental Growth
- Executive Summary - Data Table on Incremental Growth
- Executive Summary - Chart on Company Market Positioning
2 Technavio Analysis
- 2.1 Analysis of price sensitivity, lifecycle, customer purchase basket, adoption rates, and purchase criteria
- Analysis of price sensitivity, lifecycle, customer purchase basket, adoption rates, and purchase criteria
- 2.2 Criticality of inputs and Factors of differentiation
- Overview on criticality of inputs and factors of differentiation
- 2.3 Factors of disruption
- Overview on factors of disruption
- 2.4 Impact of drivers and challenges
- Impact of drivers and challenges in 2024 and 2029
3 Market Landscape
- 3.1 Market ecosystem
- Parent Market
- Data Table on - Parent Market
- 3.2 Market characteristics
- Market characteristics analysis
- 3.3 Value chain analysis
- Value chain analysis
4 Market Sizing
- 4.1 Market definition
- Offerings of companies included in the market definition
- 4.2 Market segment analysis
- Market segments
- 4.3 Market size 2024
- 4.4 Market outlook: Forecast for 2024-2029
- Chart on Global - Market size and forecast 2024-2029 ($ million)
- Data Table on Global - Market size and forecast 2024-2029 ($ million)
- Chart on Global Market: Year-over-year growth 2024-2029 (%)
- Data Table on Global Market: Year-over-year growth 2024-2029 (%)
5 Historic Market Size
- 5.1 Global Carbon Fiber Market 2019 - 2023
- Historic Market Size - Data Table on Global Carbon Fiber Market 2019 - 2023 ($ million)
- 5.2 End-user segment analysis 2019 - 2023
- Historic Market Size - End-user Segment 2019 - 2023 ($ million)
- 5.3 Raw Material segment analysis 2019 - 2023
- Historic Market Size - Raw Material Segment 2019 - 2023 ($ million)
- 5.4 Geography segment analysis 2019 - 2023
- Historic Market Size - Geography Segment 2019 - 2023 ($ million)
- 5.5 Country segment analysis 2019 - 2023
- Historic Market Size - Country Segment 2019 - 2023 ($ million)
6 Qualitative Analysis
- 6.1 Impact of AI on the Global Carbon Fiber Market
7 Five Forces Analysis
- 7.1 Five forces summary
- Five forces analysis - Comparison between 2024 and 2029
- 7.2 Bargaining power of buyers
- Bargaining power of buyers - Impact of key factors 2024 and 2029
- 7.3 Bargaining power of suppliers
- Bargaining power of suppliers - Impact of key factors in 2024 and 2029
- 7.4 Threat of new entrants
- Threat of new entrants - Impact of key factors in 2024 and 2029
- 7.5 Threat of substitutes
- Threat of substitutes - Impact of key factors in 2024 and 2029
- 7.6 Threat of rivalry
- Threat of rivalry - Impact of key factors in 2024 and 2029
- 7.7 Market condition
- Chart on Market condition - Five forces 2024 and 2029
8 Market Segmentation by End-user
- 8.1 Market segments
- Chart on End-user - Market share 2024-2029 (%)
- Data Table on End-user - Market share 2024-2029 (%)
- 8.2 Comparison by End-user
- Chart on Comparison by End-user
- Data Table on Comparison by End-user
- 8.3 Aerospace and defense - Market size and forecast 2024-2029
- Chart on Aerospace and defense - Market size and forecast 2024-2029 ($ million)
- Data Table on Aerospace and defense - Market size and forecast 2024-2029 ($ million)
- Chart on Aerospace and defense - Year-over-year growth 2024-2029 (%)
- Data Table on Aerospace and defense - Year-over-year growth 2024-2029 (%)
- 8.4 Sports and leisure - Market size and forecast 2024-2029
- Chart on Sports and leisure - Market size and forecast 2024-2029 ($ million)
- Data Table on Sports and leisure - Market size and forecast 2024-2029 ($ million)
- Chart on Sports and leisure - Year-over-year growth 2024-2029 (%)
- Data Table on Sports and leisure - Year-over-year growth 2024-2029 (%)
- 8.5 Wind energy - Market size and forecast 2024-2029
- Chart on Wind energy - Market size and forecast 2024-2029 ($ million)
- Data Table on Wind energy - Market size and forecast 2024-2029 ($ million)
- Chart on Wind energy - Year-over-year growth 2024-2029 (%)
- Data Table on Wind energy - Year-over-year growth 2024-2029 (%)
- 8.6 Automotive - Market size and forecast 2024-2029
- Chart on Automotive - Market size and forecast 2024-2029 ($ million)
- Data Table on Automotive - Market size and forecast 2024-2029 ($ million)
- Chart on Automotive - Year-over-year growth 2024-2029 (%)
- Data Table on Automotive - Year-over-year growth 2024-2029 (%)
- 8.7 Others - Market size and forecast 2024-2029
- Chart on Others - Market size and forecast 2024-2029 ($ million)
- Data Table on Others - Market size and forecast 2024-2029 ($ million)
- Chart on Others - Year-over-year growth 2024-2029 (%)
- Data Table on Others - Year-over-year growth 2024-2029 (%)
- 8.8 Market opportunity by End-user
- Market opportunity by End-user ($ million)
- Data Table on Market opportunity by End-user ($ million)
9 Market Segmentation by Raw Material
- 9.1 Market segments
- Chart on Raw Material - Market share 2024-2029 (%)
- Data Table on Raw Material - Market share 2024-2029 (%)
- 9.2 Comparison by Raw Material
- Chart on Comparison by Raw Material
- Data Table on Comparison by Raw Material
- 9.3 PAN-based - Market size and forecast 2024-2029
- Chart on PAN-based - Market size and forecast 2024-2029 ($ million)
- Data Table on PAN-based - Market size and forecast 2024-2029 ($ million)
- Chart on PAN-based - Year-over-year growth 2024-2029 (%)
- Data Table on PAN-based - Year-over-year growth 2024-2029 (%)
- 9.4 Pitch-based - Market size and forecast 2024-2029
- Chart on Pitch-based - Market size and forecast 2024-2029 ($ million)
- Data Table on Pitch-based - Market size and forecast 2024-2029 ($ million)
- Chart on Pitch-based - Year-over-year growth 2024-2029 (%)
- Data Table on Pitch-based - Year-over-year growth 2024-2029 (%)
- 9.5 Rayon-based - Market size and forecast 2024-2029
- Chart on Rayon-based - Market size and forecast 2024-2029 ($ million)
- Data Table on Rayon-based - Market size and forecast 2024-2029 ($ million)
- Chart on Rayon-based - Year-over-year growth 2024-2029 (%)
- Data Table on Rayon-based - Year-over-year growth 2024-2029 (%)
- 9.6 Market opportunity by Raw Material
- Market opportunity by Raw Material ($ million)
- Data Table on Market opportunity by Raw Material ($ million)
10 Customer Landscape
- 10.1 Customer landscape overview
- Analysis of price sensitivity, lifecycle, customer purchase basket, adoption rates, and purchase criteria
11 Geographic Landscape
- 11.1 Geographic segmentation
- Chart on Market share By Geographical Landscape 2024-2029 (%)
- Data Table on Market share By Geographical Landscape 2024-2029 (%)
- 11.2 Geographic comparison
- Chart on Geographic comparison
- Data Table on Geographic comparison
- 11.3 North America - Market size and forecast 2024-2029
- Chart on North America - Market size and forecast 2024-2029 ($ million)
- Data Table on North America - Market size and forecast 2024-2029 ($ million)
- Chart on North America - Year-over-year growth 2024-2029 (%)
- Data Table on North America - Year-over-year growth 2024-2029 (%)
- 11.4 Europe - Market size and forecast 2024-2029
- Chart on Europe - Market size and forecast 2024-2029 ($ million)
- Data Table on Europe - Market size and forecast 2024-2029 ($ million)
- Chart on Europe - Year-over-year growth 2024-2029 (%)
- Data Table on Europe - Year-over-year growth 2024-2029 (%)
- 11.5 APAC - Market size and forecast 2024-2029
- Chart on APAC - Market size and forecast 2024-2029 ($ million)
- Data Table on APAC - Market size and forecast 2024-2029 ($ million)
- Chart on APAC - Year-over-year growth 2024-2029 (%)
- Data Table on APAC - Year-over-year growth 2024-2029 (%)
- 11.6 South America - Market size and forecast 2024-2029
- Chart on South America - Market size and forecast 2024-2029 ($ million)
- Data Table on South America - Market size and forecast 2024-2029 ($ million)
- Chart on South America - Year-over-year growth 2024-2029 (%)
- Data Table on South America - Year-over-year growth 2024-2029 (%)
- 11.7 Middle East and Africa - Market size and forecast 2024-2029
- Chart on Middle East and Africa - Market size and forecast 2024-2029 ($ million)
- Data Table on Middle East and Africa - Market size and forecast 2024-2029 ($ million)
- Chart on Middle East and Africa - Year-over-year growth 2024-2029 (%)
- Data Table on Middle East and Africa - Year-over-year growth 2024-2029 (%)
- 11.8 US - Market size and forecast 2024-2029
- Chart on US - Market size and forecast 2024-2029 ($ million)
- Data Table on US - Market size and forecast 2024-2029 ($ million)
- Chart on US - Year-over-year growth 2024-2029 (%)
- Data Table on US - Year-over-year growth 2024-2029 (%)
- 11.9 China - Market size and forecast 2024-2029
- Chart on China - Market size and forecast 2024-2029 ($ million)
- Data Table on China - Market size and forecast 2024-2029 ($ million)
- Chart on China - Year-over-year growth 2024-2029 (%)
- Data Table on China - Year-over-year growth 2024-2029 (%)
- 11.10 India - Market size and forecast 2024-2029
- Chart on India - Market size and forecast 2024-2029 ($ million)
- Data Table on India - Market size and forecast 2024-2029 ($ million)
- Chart on India - Year-over-year growth 2024-2029 (%)
- Data Table on India - Year-over-year growth 2024-2029 (%)
- 11.11 Germany - Market size and forecast 2024-2029
- Chart on Germany - Market size and forecast 2024-2029 ($ million)
- Data Table on Germany - Market size and forecast 2024-2029 ($ million)
- Chart on Germany - Year-over-year growth 2024-2029 (%)
- Data Table on Germany - Year-over-year growth 2024-2029 (%)
- 11.12 Canada - Market size and forecast 2024-2029
- Chart on Canada - Market size and forecast 2024-2029 ($ million)
- Data Table on Canada - Market size and forecast 2024-2029 ($ million)
- Chart on Canada - Year-over-year growth 2024-2029 (%)
- Data Table on Canada - Year-over-year growth 2024-2029 (%)
- 11.13 Russia - Market size and forecast 2024-2029
- Chart on Russia - Market size and forecast 2024-2029 ($ million)
- Data Table on Russia - Market size and forecast 2024-2029 ($ million)
- Chart on Russia - Year-over-year growth 2024-2029 (%)
- Data Table on Russia - Year-over-year growth 2024-2029 (%)
- 11.14 UK - Market size and forecast 2024-2029
- Chart on UK - Market size and forecast 2024-2029 ($ million)
- Data Table on UK - Market size and forecast 2024-2029 ($ million)
- Chart on UK - Year-over-year growth 2024-2029 (%)
- Data Table on UK - Year-over-year growth 2024-2029 (%)
- 11.15 Japan - Market size and forecast 2024-2029
- Chart on Japan - Market size and forecast 2024-2029 ($ million)
- Data Table on Japan - Market size and forecast 2024-2029 ($ million)
- Chart on Japan - Year-over-year growth 2024-2029 (%)
- Data Table on Japan - Year-over-year growth 2024-2029 (%)
- 11.16 South Korea - Market size and forecast 2024-2029
- Chart on South Korea - Market size and forecast 2024-2029 ($ million)
- Data Table on South Korea - Market size and forecast 2024-2029 ($ million)
- Chart on South Korea - Year-over-year growth 2024-2029 (%)
- Data Table on South Korea - Year-over-year growth 2024-2029 (%)
- 11.17 France - Market size and forecast 2024-2029
- Chart on France - Market size and forecast 2024-2029 ($ million)
- Data Table on France - Market size and forecast 2024-2029 ($ million)
- Chart on France - Year-over-year growth 2024-2029 (%)
- Data Table on France - Year-over-year growth 2024-2029 (%)
- 11.18 Market opportunity By Geographical Landscape
- Market opportunity By Geographical Landscape ($ million)
- Data Tables on Market opportunity By Geographical Landscape ($ million)
12 Drivers, Challenges, and Opportunity/Restraints
- 12.1 Market drivers
- 12.2 Market challenges
- 12.3 Impact of drivers and challenges
- Impact of drivers and challenges in 2024 and 2029
- 12.4 Market opportunities/restraints
13 Competitive Landscape
- 13.1 Overview
- 13.2 Competitive Landscape
- Overview on criticality of inputs and factors of differentiation
- 13.3 Landscape disruption
- Overview on factors of disruption
- 13.4 Industry risks
- Impact of key risks on business
14 Competitive Analysis
- 14.1 Companies profiled
- Companies covered
- 14.2 Company ranking index
- Company ranking index
- 14.3 Market positioning of companies
- Matrix on companies position and classification
- 14.4 China Composites Group Corp. Ltd.
- China Composites Group Corp. Ltd. - Overview
- China Composites Group Corp. Ltd. - Product / Service
- China Composites Group Corp. Ltd. - Key offerings
- SWOT
- 14.5 DowAksa
- DowAksa - Overview
- DowAksa - Product / Service
- DowAksa - Key offerings
- SWOT
- 14.6 Formosa M Co. Ltd.
- Formosa M Co. Ltd. - Overview
- Formosa M Co. Ltd. - Product / Service
- Formosa M Co. Ltd. - Key offerings
- SWOT
- 14.7 Hexcel Corp.
- Hexcel Corp. - Overview
- Hexcel Corp. - Business segments
- Hexcel Corp. - Key news
- Hexcel Corp. - Key offerings
- Hexcel Corp. - Segment focus
- SWOT
- 14.8 Hyosung Advanced Materials
- Hyosung Advanced Materials - Overview
- Hyosung Advanced Materials - Product / Service
- Hyosung Advanced Materials - Key offerings
- SWOT
- 14.9 Kureha Corp.
- Kureha Corp. - Overview
- Kureha Corp. - Business segments
- Kureha Corp. - Key news
- Kureha Corp. - Key offerings
- Kureha Corp. - Segment focus
- SWOT
- 14.10 Mitsubishi Chemical Corp.
- Mitsubishi Chemical Corp. - Overview
- Mitsubishi Chemical Corp. - Business segments
- Mitsubishi Chemical Corp. - Key offerings
- Mitsubishi Chemical Corp. - Segment focus
- SWOT
- 14.11 Nippon Steel Corp.
- Nippon Steel Corp. - Overview
- Nippon Steel Corp. - Business segments
- Nippon Steel Corp. - Key news
- Nippon Steel Corp. - Key offerings
- Nippon Steel Corp. - Segment focus
- SWOT
- 14.12 Osaka Gas Co. Ltd.
- Osaka Gas Co. Ltd. - Overview
- Osaka Gas Co. Ltd. - Business segments
- Osaka Gas Co. Ltd. - Key offerings
- Osaka Gas Co. Ltd. - Segment focus
- SWOT
- 14.13 Saudi Arabian Oil Co.
- Saudi Arabian Oil Co. - Overview
- Saudi Arabian Oil Co. - Product / Service
- Saudi Arabian Oil Co. - Key offerings
- SWOT
- 14.14 SGL Carbon SE
- SGL Carbon SE - Overview
- SGL Carbon SE - Business segments
- SGL Carbon SE - Key news
- SGL Carbon SE - Key offerings
- SGL Carbon SE - Segment focus
- SWOT
- 14.15 SIMCO Global Technology and Systems Ltd.
- SIMCO Global Technology and Systems Ltd. - Overview
- SIMCO Global Technology and Systems Ltd. - Product / Service
- SIMCO Global Technology and Systems Ltd. - Key offerings
- SWOT
- 14.16 Solvay SA
- Solvay SA - Overview
- Solvay SA - Business segments
- Solvay SA - Key news
- Solvay SA - Key offerings
- Solvay SA - Segment focus
- SWOT
- 14.17 Teijin Ltd.
- Teijin Ltd. - Overview
- Teijin Ltd. - Business segments
- Teijin Ltd. - Key news
- Teijin Ltd. - Key offerings
- Teijin Ltd. - Segment focus
- SWOT
- 14.18 Toray Industries Inc.
- Toray Industries Inc. - Overview
- Toray Industries Inc. - Business segments
- Toray Industries Inc. - Key news
- Toray Industries Inc. - Key offerings
- Toray Industries Inc. - Segment focus
- SWOT
15 Appendix
- 15.1 Scope of the report
- 15.2 Inclusions and exclusions checklist
- Inclusions checklist
- Exclusions checklist
- 15.3 Currency conversion rates for US$
- Currency conversion rates for US$
- 15.4 Research methodology
- Research methodology
- 15.5 Data procurement
- Information sources
- 15.6 Data validation
- Data validation
- 15.7 Validation techniques employed for market sizing
- Validation techniques employed for market sizing
- 15.8 Data synthesis
- Data synthesis
- 15.9 360 degree market analysis
- 360 degree market analysis
- 15.10 List of abbreviations
- List of abbreviations

