|
|
市場調査レポート
商品コード
1491592
女性用避妊薬の世界市場 2024-2028Global female contraceptive market 2024-2028 |
||||||

|
|||||||
カスタマイズ可能
|
|||||||


| 女性用避妊薬の世界市場 2024-2028 |
|
出版日: 2024年05月21日
発行: TechNavio
ページ情報: 英文 178 Pages
納期: 即納可能
|

全表示
- 概要
- 図表
- 目次
女性用避妊薬市場は2023-2028年に 45億7,150万米ドル、予測期間中のCAGRは4.6%で成長すると予測されています。
当レポートでは、女性用避妊薬市場の全体的な分析、市場規模・予測、動向、成長促進要因、課題、約25のベンダーを網羅したベンダー分析などを掲載しています。
現在の市場シナリオ、最新動向と促進要因、市場環境全体に関する最新分析を提供しています。市場は、革新的なマーケティング戦略の採用の増加、消費者の視点の進化、さまざまな避妊方法の利用可能性によって牽引されています。
| 市場範囲 | |
|---|---|
| 基準年 | 2024 |
| 終了年 | 2028 |
| 予測期間 | 2024-2028 |
| 成長モメンタム | 加速 |
| 前年比2024年 | 4.32% |
| CAGR | 4.6% |
| 増分額 | 45億7,150万米ドル |
本調査では、女性用コンドームの人気の高まりが、今後数年間の女性用避妊薬市場の成長を牽引する主要因の1つであるとしています。また、コンドームの技術的進歩やeコマースプラットフォームの高成長も、市場の大きな需要につながると思われます。
目次
第1章 エグゼクティブサマリー
- 市場概要
第2章 市場情勢
- 市場エコシステム
- 市場の特徴
- バリューチェーン分析
第3章 市場規模の評価
- 市場の定義
- 市場セグメント分析
- 市場規模 2023
- 市場の見通し 2023-2028
第4章 市場規模実績
- 世界女性用避妊薬市場 2018-2022
- 流通チャネルセグメント分析 2018-2022
- 製品セグメント分析 2018-2022
- 地域別セグメント分析 2018-2022
- 国別セグメント分析 2018-2022
第5章 ファイブフォース分析
- ファイブフォースの要約
- 買い手の交渉力
- 供給企業の交渉力
- 新規参入業者の脅威
- 代替品の脅威
- 競争の脅威
- 市況
第6章 市場セグメンテーション:流通チャネル別
- 市場セグメンテーション
- 比較:流通チャネル別
- オフライン:市場規模と予測 2023-2028
- オンライン:市場規模と予測 2023-2028
- 市場機会:流通チャネル別
第7章 市場セグメンテーション:製品別
- 市場セグメンテーション
- 比較:製品別
- 女性用避妊薬デバイス:市場規模と予測 2023-2028
- 女性用避妊薬:市場規模と予測 2023-2028
- 市場機会:製品別
第8章 顧客情勢
- 顧客情勢の概要
第9章 地域別情勢
- 地域別セグメンテーション
- 地域別比較
- 北米:市場規模と予測 2023-2028
- 欧州:市場規模と予測 2023-2028
- アジア太平洋:市場規模と予測 2023-2028
- 南米:市場規模と予測 2023-2028
- 中東・アフリカ:市場規模と予測 2023-2028
- 米国:市場規模と予測 2023-2028
- 中国:市場規模と予測 2023-2028
- フランス:市場規模と予測 2023-2028
- カナダ:市場規模と予測 2023-2028
- 日本:市場規模と予測 2023-2028
- 市場機会:地域情勢別
第10章 促進要因・課題・機会・抑制要因
- 市場促進要因
- 市場の課題
- 促進要因と課題の影響
- 市場の機会・抑制要因
第11章 競合情勢
- 概要
- 競合情勢
- 混乱の状況
- 業界のリスク
第12章 競合分析
- 企業プロファイル
- 企業の市場ポジショニング
- AbbVie Inc.
- Afaxys Pharma LLC
- Agile Therapeutics Inc.
- Ansell Ltd.
- Bayer AG
- The Cooper Companies Inc.
- Cupid Ltd.
- Johnson and Johnson Services Inc.
- Mayer Laboratories Inc.
- Merck and Co. Inc.
- Pfizer Inc.
- Reckitt Benckiser Group Plc
- Teva Pharmaceutical Industries Ltd.
- Veru Inc.
- Viatris Inc.
第13章 付録
Exhibits:
- Exhibits1: Executive Summary - Chart on Market Overview
- Exhibits2: Executive Summary - Data Table on Market Overview
- Exhibits3: Executive Summary - Chart on Global Market Characteristics
- Exhibits4: Executive Summary - Chart on Market By Geographical Landscape
- Exhibits5: Executive Summary - Chart on Market Segmentation by Distribution Channel
- Exhibits6: Executive Summary - Chart on Market Segmentation by Product
- Exhibits7: Executive Summary - Chart on Incremental Growth
- Exhibits8: Executive Summary - Data Table on Incremental Growth
- Exhibits9: Executive Summary - Chart on Company Market Positioning
- Exhibits10: Parent Market
- Exhibits11: Data Table on - Parent Market
- Exhibits12: Market characteristics analysis
- Exhibits13: Value Chain Analysis
- Exhibits14: Offerings of companies included in the market definition
- Exhibits15: Market segments
- Exhibits16: Chart on Global - Market size and forecast 2023-2028 ($ million)
- Exhibits17: Data Table on Global - Market size and forecast 2023-2028 ($ million)
- Exhibits18: Chart on Global Market: Year-over-year growth 2023-2028 (%)
- Exhibits19: Data Table on Global Market: Year-over-year growth 2023-2028 (%)
- Exhibits20: Historic Market Size - Data Table on Global Female Contraceptive Market 2018 - 2022 ($ million)
- Exhibits21: Historic Market Size - Distribution Channel Segment 2018 - 2022 ($ million)
- Exhibits22: Historic Market Size - Product Segment 2018 - 2022 ($ million)
- Exhibits23: Historic Market Size - Geography Segment 2018 - 2022 ($ million)
- Exhibits24: Historic Market Size - Country Segment 2018 - 2022 ($ million)
- Exhibits25: Five forces analysis - Comparison between 2023 and 2028
- Exhibits26: Bargaining power of buyers - Impact of key factors 2023 and 2028
- Exhibits27: Bargaining power of suppliers - Impact of key factors in 2023 and 2028
- Exhibits28: Threat of new entrants - Impact of key factors in 2023 and 2028
- Exhibits29: Threat of substitutes - Impact of key factors in 2023 and 2028
- Exhibits30: Threat of rivalry - Impact of key factors in 2023 and 2028
- Exhibits31: Chart on Market condition - Five forces 2023 and 2028
- Exhibits32: Chart on Distribution Channel - Market share 2023-2028 (%)
- Exhibits33: Data Table on Distribution Channel - Market share 2023-2028 (%)
- Exhibits34: Chart on Comparison by Distribution Channel
- Exhibits35: Data Table on Comparison by Distribution Channel
- Exhibits36: Chart on Offline - Market size and forecast 2023-2028 ($ million)
- Exhibits37: Data Table on Offline - Market size and forecast 2023-2028 ($ million)
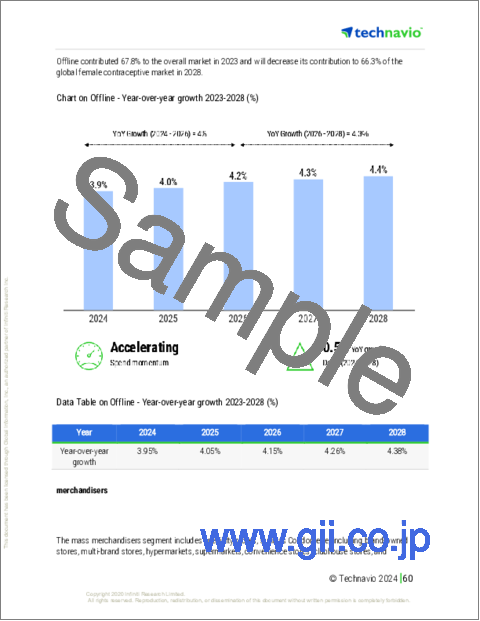
- Exhibits38: Chart on Offline - Year-over-year growth 2023-2028 (%)
- Exhibits39: Data Table on Offline - Year-over-year growth 2023-2028 (%)
- Exhibits40: Chart on Online - Market size and forecast 2023-2028 ($ million)
- Exhibits41: Data Table on Online - Market size and forecast 2023-2028 ($ million)
- Exhibits42: Chart on Online - Year-over-year growth 2023-2028 (%)
- Exhibits43: Data Table on Online - Year-over-year growth 2023-2028 (%)
- Exhibits44: Market opportunity by Distribution Channel ($ million)
- Exhibits45: Data Table on Market opportunity by Distribution Channel ($ million)
- Exhibits46: Chart on Product - Market share 2023-2028 (%)
- Exhibits47: Data Table on Product - Market share 2023-2028 (%)
- Exhibits48: Chart on Comparison by Product
- Exhibits49: Data Table on Comparison by Product
- Exhibits50: Chart on Female contraceptive devices - Market size and forecast 2023-2028 ($ million)
- Exhibits51: Data Table on Female contraceptive devices - Market size and forecast 2023-2028 ($ million)
- Exhibits52: Chart on Female contraceptive devices - Year-over-year growth 2023-2028 (%)
- Exhibits53: Data Table on Female contraceptive devices - Year-over-year growth 2023-2028 (%)
- Exhibits54: Chart on Female contraceptive drugs - Market size and forecast 2023-2028 ($ million)
- Exhibits55: Data Table on Female contraceptive drugs - Market size and forecast 2023-2028 ($ million)
- Exhibits56: Chart on Female contraceptive drugs - Year-over-year growth 2023-2028 (%)
- Exhibits57: Data Table on Female contraceptive drugs - Year-over-year growth 2023-2028 (%)
- Exhibits58: Market opportunity by Product ($ million)
- Exhibits59: Data Table on Market opportunity by Product ($ million)
- Exhibits60: Analysis of price sensitivity, lifecycle, customer purchase basket, adoption rates, and purchase criteria
- Exhibits61: Chart on Market share By Geographical Landscape 2023-2028 (%)
- Exhibits62: Data Table on Market share By Geographical Landscape 2023-2028 (%)
- Exhibits63: Chart on Geographic comparison
- Exhibits64: Data Table on Geographic comparison
- Exhibits65: Chart on North America - Market size and forecast 2023-2028 ($ million)
- Exhibits66: Data Table on North America - Market size and forecast 2023-2028 ($ million)
- Exhibits67: Chart on North America - Year-over-year growth 2023-2028 (%)
- Exhibits68: Data Table on North America - Year-over-year growth 2023-2028 (%)
- Exhibits69: Chart on Europe - Market size and forecast 2023-2028 ($ million)
- Exhibits70: Data Table on Europe - Market size and forecast 2023-2028 ($ million)
- Exhibits71: Chart on Europe - Year-over-year growth 2023-2028 (%)
- Exhibits72: Data Table on Europe - Year-over-year growth 2023-2028 (%)
- Exhibits73: Chart on APAC - Market size and forecast 2023-2028 ($ million)
- Exhibits74: Data Table on APAC - Market size and forecast 2023-2028 ($ million)
- Exhibits75: Chart on APAC - Year-over-year growth 2023-2028 (%)
- Exhibits76: Data Table on APAC - Year-over-year growth 2023-2028 (%)
- Exhibits77: Chart on South America - Market size and forecast 2023-2028 ($ million)
- Exhibits78: Data Table on South America - Market size and forecast 2023-2028 ($ million)
- Exhibits79: Chart on South America - Year-over-year growth 2023-2028 (%)
- Exhibits80: Data Table on South America - Year-over-year growth 2023-2028 (%)
- Exhibits81: Chart on Middle East and Africa - Market size and forecast 2023-2028 ($ million)
- Exhibits82: Data Table on Middle East and Africa - Market size and forecast 2023-2028 ($ million)
- Exhibits83: Chart on Middle East and Africa - Year-over-year growth 2023-2028 (%)
- Exhibits84: Data Table on Middle East and Africa - Year-over-year growth 2023-2028 (%)
- Exhibits85: Chart on US - Market size and forecast 2023-2028 ($ million)
- Exhibits86: Data Table on US - Market size and forecast 2023-2028 ($ million)
- Exhibits87: Chart on US - Year-over-year growth 2023-2028 (%)
- Exhibits88: Data Table on US - Year-over-year growth 2023-2028 (%)
- Exhibits89: Chart on China - Market size and forecast 2023-2028 ($ million)
- Exhibits90: Data Table on China - Market size and forecast 2023-2028 ($ million)
- Exhibits91: Chart on China - Year-over-year growth 2023-2028 (%)
- Exhibits92: Data Table on China - Year-over-year growth 2023-2028 (%)
- Exhibits93: Chart on France - Market size and forecast 2023-2028 ($ million)
- Exhibits94: Data Table on France - Market size and forecast 2023-2028 ($ million)
- Exhibits95: Chart on France - Year-over-year growth 2023-2028 (%)
- Exhibits96: Data Table on France - Year-over-year growth 2023-2028 (%)
- Exhibits97: Chart on Canada - Market size and forecast 2023-2028 ($ million)
- Exhibits98: Data Table on Canada - Market size and forecast 2023-2028 ($ million)
- Exhibits99: Chart on Canada - Year-over-year growth 2023-2028 (%)
- Exhibits100: Data Table on Canada - Year-over-year growth 2023-2028 (%)
- Exhibits101: Chart on Japan - Market size and forecast 2023-2028 ($ million)
- Exhibits102: Data Table on Japan - Market size and forecast 2023-2028 ($ million)
- Exhibits103: Chart on Japan - Year-over-year growth 2023-2028 (%)
- Exhibits104: Data Table on Japan - Year-over-year growth 2023-2028 (%)
- Exhibits105: Market opportunity By Geographical Landscape ($ million)
- Exhibits106: Data Tables on Market opportunity By Geographical Landscape ($ million)
- Exhibits107: Impact of drivers and challenges in 2023 and 2028
- Exhibits108: Overview on criticality of inputs and factors of differentiation
- Exhibits109: Overview on factors of disruption
- Exhibits110: Impact of key risks on business
- Exhibits111: Companies covered
- Exhibits112: Matrix on companies position and classification
- Exhibits113: AbbVie Inc. - Overview
- Exhibits114: AbbVie Inc. - Product / Service
- Exhibits115: AbbVie Inc. - Key news
- Exhibits116: AbbVie Inc. - Key offerings
- Exhibits117: Afaxys Pharma LLC - Overview
- Exhibits118: Afaxys Pharma LLC - Product / Service
- Exhibits119: Afaxys Pharma LLC - Key offerings
- Exhibits120: Agile Therapeutics Inc. - Overview
- Exhibits121: Agile Therapeutics Inc. - Product / Service
- Exhibits122: Agile Therapeutics Inc. - Key offerings
- Exhibits123: Ansell Ltd. - Overview
- Exhibits124: Ansell Ltd. - Business segments
- Exhibits125: Ansell Ltd. - Key news
- Exhibits126: Ansell Ltd. - Key offerings
- Exhibits127: Ansell Ltd. - Segment focus
- Exhibits128: Bayer AG - Overview
- Exhibits129: Bayer AG - Business segments
- Exhibits130: Bayer AG - Key news
- Exhibits131: Bayer AG - Key offerings
- Exhibits132: Bayer AG - Segment focus
- Exhibits133: The Cooper Companies Inc. - Overview
- Exhibits134: The Cooper Companies Inc. - Product / Service
- Exhibits135: The Cooper Companies Inc. - Key offerings
- Exhibits136: Cupid Ltd. - Overview
- Exhibits137: Cupid Ltd. - Product / Service
- Exhibits138: Cupid Ltd. - Key offerings
- Exhibits139: Johnson and Johnson Services Inc. - Overview
- Exhibits140: Johnson and Johnson Services Inc. - Business segments
- Exhibits141: Johnson and Johnson Services Inc. - Key news
- Exhibits142: Johnson and Johnson Services Inc. - Key offerings
- Exhibits143: Johnson and Johnson Services Inc. - Segment focus
- Exhibits144: Mayer Laboratories Inc. - Overview
- Exhibits145: Mayer Laboratories Inc. - Product / Service
- Exhibits146: Mayer Laboratories Inc. - Key offerings
- Exhibits147: Merck and Co. Inc. - Overview
- Exhibits148: Merck and Co. Inc. - Business segments
- Exhibits149: Merck and Co. Inc. - Key news
- Exhibits150: Merck and Co. Inc. - Key offerings
- Exhibits151: Merck and Co. Inc. - Segment focus
- Exhibits152: Pfizer Inc. - Overview
- Exhibits153: Pfizer Inc. - Product / Service
- Exhibits154: Pfizer Inc. - Key news
- Exhibits155: Pfizer Inc. - Key offerings
- Exhibits156: Reckitt Benckiser Group Plc - Overview
- Exhibits157: Reckitt Benckiser Group Plc - Business segments
- Exhibits158: Reckitt Benckiser Group Plc - Key news
- Exhibits159: Reckitt Benckiser Group Plc - Key offerings
- Exhibits160: Reckitt Benckiser Group Plc - Segment focus
- Exhibits161: Teva Pharmaceutical Industries Ltd. - Overview
- Exhibits162: Teva Pharmaceutical Industries Ltd. - Business segments
- Exhibits163: Teva Pharmaceutical Industries Ltd. - Key news
- Exhibits164: Teva Pharmaceutical Industries Ltd. - Key offerings
- Exhibits165: Teva Pharmaceutical Industries Ltd. - Segment focus
- Exhibits166: Veru Inc. - Overview
- Exhibits167: Veru Inc. - Business segments
- Exhibits168: Veru Inc. - Key news
- Exhibits169: Veru Inc. - Key offerings
- Exhibits170: Veru Inc. - Segment focus
- Exhibits171: Viatris Inc. - Overview
- Exhibits172: Viatris Inc. - Business segments
- Exhibits173: Viatris Inc. - Key news
- Exhibits174: Viatris Inc. - Key offerings
- Exhibits175: Viatris Inc. - Segment focus
- Exhibits176: Inclusions checklist
- Exhibits177: Exclusions checklist
- Exhibits178: Currency conversion rates for US$
- Exhibits179: Research methodology
- Exhibits180: Information sources
- Exhibits181: Data validation
- Exhibits182: Validation techniques employed for market sizing
- Exhibits183: Data synthesis
- Exhibits184: 360 degree market analysis
- Exhibits185: List of abbreviations
The female contraceptive market is forecasted to grow by USD 4571.5 mn during 2023-2028, accelerating at a CAGR of 4.6% during the forecast period. The report on the female contraceptive market provides a holistic analysis, market size and forecast, trends, growth drivers, and challenges, as well as vendor analysis covering around 25 vendors.
The report offers an up-to-date analysis regarding the current market scenario, the latest trends and drivers, and the overall market environment. The market is driven by increasing adoption of innovative marketing strategies, evolving consumer perspective, and availability of different methods of contraception.
Technavio's female contraceptive market is segmented as below:
| Market Scope | |
|---|---|
| Base Year | 2024 |
| End Year | 2028 |
| Series Year | 2024-2028 |
| Growth Momentum | Accelerate |
| YOY 2024 | 4.32% |
| CAGR | 4.6% |
| Incremental Value | $4571.5mn |
ByDistribution Channel
- Offline
- Online
ByProduct
- Female contraceptive devices
- Female contraceptive drugs
ByGeography
- North America
- Europe
- APAC
- South America
- Middle East and Africa
This study identifies the increasing popularity of female condoms as one of the prime reasons driving the female contraceptive market growth during the next few years. Also, technological advances in iuss and high growth of e-commerce platforms will lead to sizable demand in the market.
The report on the female contraceptive market covers the following areas:
- Female contraceptive market sizing
- Female contraceptive market forecast
- Female contraceptive market industry analysis
The robust vendor analysis is designed to help clients improve their market position, and in line with this, this report provides a detailed analysis of several leading female contraceptive market vendors that include AbbVie Inc., Afaxys Pharma LLC, Agile Therapeutics Inc., Amgen Inc., Ansell Ltd., Bayer AG, The Cooper Companies Inc., Cupid Ltd., Exeltis USA Inc., Johnson and Johnson Services Inc., Mayer Laboratories Inc., Medisafe Distribution Inc., Merck and Co. Inc., Pfizer Inc., Piramal Enterprises Ltd., Reckitt Benckiser Group Plc, Sun Pharmaceutical Industries Ltd., Teva Pharmaceutical Industries Ltd., Veru Inc., and Viatris Inc.. Also, the female contraceptive market analysis report includes information on upcoming trends and challenges that will influence market growth. This is to help companies strategize and leverage all forthcoming growth opportunities.
The study was conducted using an objective combination of primary and secondary information including inputs from key participants in the industry. The report contains a comprehensive market and vendor landscape in addition to an analysis of the key vendors.
The publisher presents a detailed picture of the market by the way of study, synthesis, and summation of data from multiple sources by an analysis of key parameters such as profit, pricing, competition, and promotions. It presents various market facets by identifying the key industry influencers. The data presented is comprehensive, reliable, and a result of extensive research - both primary and secondary. The market research reports provide a complete competitive landscape and an in-depth vendor selection methodology and analysis using qualitative and quantitative research to forecast the accurate market growth.
Table of Contents
1 Executive Summary
- 1.1 Market overview
- Executive Summary - Chart on Market Overview
- Executive Summary - Data Table on Market Overview
- Executive Summary - Chart on Global Market Characteristics
- Executive Summary - Chart on Market By Geographical Landscape
- Executive Summary - Chart on Market Segmentation by Distribution Channel
- Executive Summary - Chart on Market Segmentation by Product
- Executive Summary - Chart on Incremental Growth
- Executive Summary - Data Table on Incremental Growth
- Executive Summary - Chart on Company Market Positioning
2 Market Landscape
- 2.1 Market ecosystem
- Parent Market
- Data Table on - Parent Market
- 2.2 Market characteristics
- Market characteristics analysis
- 2.3 Value chain analysis
- Value Chain Analysis
3 Market Sizing
- 3.1 Market definition
- Offerings of companies included in the market definition
- 3.2 Market segment analysis
- Market segments
- 3.3 Market size 2023
- 3.4 Market outlook: Forecast for 2023-2028
- Chart on Global - Market size and forecast 2023-2028 ($ million)
- Data Table on Global - Market size and forecast 2023-2028 ($ million)
- Chart on Global Market: Year-over-year growth 2023-2028 (%)
- Data Table on Global Market: Year-over-year growth 2023-2028 (%)
4 Historic Market Size
- 4.1 Global Female Contraceptive Market 2018 - 2022
- Historic Market Size - Data Table on Global Female Contraceptive Market 2018 - 2022 ($ million)
- 4.2 Distribution Channel segment analysis 2018 - 2022
- Historic Market Size - Distribution Channel Segment 2018 - 2022 ($ million)
- 4.3 Product segment analysis 2018 - 2022
- Historic Market Size - Product Segment 2018 - 2022 ($ million)
- 4.4 Geography segment analysis 2018 - 2022
- Historic Market Size - Geography Segment 2018 - 2022 ($ million)
- 4.5 Country segment analysis 2018 - 2022
- Historic Market Size - Country Segment 2018 - 2022 ($ million)
5 Five Forces Analysis
- 5.1 Five forces summary
- Five forces analysis - Comparison between 2023 and 2028
- 5.2 Bargaining power of buyers
- Bargaining power of buyers - Impact of key factors 2023 and 2028
- 5.3 Bargaining power of suppliers
- Bargaining power of suppliers - Impact of key factors in 2023 and 2028
- 5.4 Threat of new entrants
- Threat of new entrants - Impact of key factors in 2023 and 2028
- 5.5 Threat of substitutes
- Threat of substitutes - Impact of key factors in 2023 and 2028
- 5.6 Threat of rivalry
- Threat of rivalry - Impact of key factors in 2023 and 2028
- 5.7 Market condition
- Chart on Market condition - Five forces 2023 and 2028
6 Market Segmentation by Distribution Channel
- 6.1 Market segments
- Chart on Distribution Channel - Market share 2023-2028 (%)
- Data Table on Distribution Channel - Market share 2023-2028 (%)
- 6.2 Comparison by Distribution Channel
- Chart on Comparison by Distribution Channel
- Data Table on Comparison by Distribution Channel
- 6.3 Offline - Market size and forecast 2023-2028
- Chart on Offline - Market size and forecast 2023-2028 ($ million)
- Data Table on Offline - Market size and forecast 2023-2028 ($ million)
- Chart on Offline - Year-over-year growth 2023-2028 (%)
- Data Table on Offline - Year-over-year growth 2023-2028 (%)
- 6.4 Online - Market size and forecast 2023-2028
- Chart on Online - Market size and forecast 2023-2028 ($ million)
- Data Table on Online - Market size and forecast 2023-2028 ($ million)
- Chart on Online - Year-over-year growth 2023-2028 (%)
- Data Table on Online - Year-over-year growth 2023-2028 (%)
- 6.5 Market opportunity by Distribution Channel
- Market opportunity by Distribution Channel ($ million)
- Data Table on Market opportunity by Distribution Channel ($ million)
7 Market Segmentation by Product
- 7.1 Market segments
- Chart on Product - Market share 2023-2028 (%)
- Data Table on Product - Market share 2023-2028 (%)
- 7.2 Comparison by Product
- Chart on Comparison by Product
- Data Table on Comparison by Product
- 7.3 Female contraceptive devices - Market size and forecast 2023-2028
- Chart on Female contraceptive devices - Market size and forecast 2023-2028 ($ million)
- Data Table on Female contraceptive devices - Market size and forecast 2023-2028 ($ million)
- Chart on Female contraceptive devices - Year-over-year growth 2023-2028 (%)
- Data Table on Female contraceptive devices - Year-over-year growth 2023-2028 (%)
- 7.4 Female contraceptive drugs - Market size and forecast 2023-2028
- Chart on Female contraceptive drugs - Market size and forecast 2023-2028 ($ million)
- Data Table on Female contraceptive drugs - Market size and forecast 2023-2028 ($ million)
- Chart on Female contraceptive drugs - Year-over-year growth 2023-2028 (%)
- Data Table on Female contraceptive drugs - Year-over-year growth 2023-2028 (%)
- 7.5 Market opportunity by Product
- Market opportunity by Product ($ million)
- Data Table on Market opportunity by Product ($ million)
8 Customer Landscape
- 8.1 Customer landscape overview
- Analysis of price sensitivity, lifecycle, customer purchase basket, adoption rates, and purchase criteria
9 Geographic Landscape
- 9.1 Geographic segmentation
- Chart on Market share By Geographical Landscape 2023-2028 (%)
- Data Table on Market share By Geographical Landscape 2023-2028 (%)
- 9.2 Geographic comparison
- Chart on Geographic comparison
- Data Table on Geographic comparison
- 9.3 North America - Market size and forecast 2023-2028
- Chart on North America - Market size and forecast 2023-2028 ($ million)
- Data Table on North America - Market size and forecast 2023-2028 ($ million)
- Chart on North America - Year-over-year growth 2023-2028 (%)
- Data Table on North America - Year-over-year growth 2023-2028 (%)
- 9.4 Europe - Market size and forecast 2023-2028
- Chart on Europe - Market size and forecast 2023-2028 ($ million)
- Data Table on Europe - Market size and forecast 2023-2028 ($ million)
- Chart on Europe - Year-over-year growth 2023-2028 (%)
- Data Table on Europe - Year-over-year growth 2023-2028 (%)
- 9.5 APAC - Market size and forecast 2023-2028
- Chart on APAC - Market size and forecast 2023-2028 ($ million)
- Data Table on APAC - Market size and forecast 2023-2028 ($ million)
- Chart on APAC - Year-over-year growth 2023-2028 (%)
- Data Table on APAC - Year-over-year growth 2023-2028 (%)
- 9.6 South America - Market size and forecast 2023-2028
- Chart on South America - Market size and forecast 2023-2028 ($ million)
- Data Table on South America - Market size and forecast 2023-2028 ($ million)
- Chart on South America - Year-over-year growth 2023-2028 (%)
- Data Table on South America - Year-over-year growth 2023-2028 (%)
- 9.7 Middle East and Africa - Market size and forecast 2023-2028
- Chart on Middle East and Africa - Market size and forecast 2023-2028 ($ million)
- Data Table on Middle East and Africa - Market size and forecast 2023-2028 ($ million)
- Chart on Middle East and Africa - Year-over-year growth 2023-2028 (%)
- Data Table on Middle East and Africa - Year-over-year growth 2023-2028 (%)
- 9.8 US - Market size and forecast 2023-2028
- Chart on US - Market size and forecast 2023-2028 ($ million)
- Data Table on US - Market size and forecast 2023-2028 ($ million)
- Chart on US - Year-over-year growth 2023-2028 (%)
- Data Table on US - Year-over-year growth 2023-2028 (%)
- 9.9 China - Market size and forecast 2023-2028
- Chart on China - Market size and forecast 2023-2028 ($ million)
- Data Table on China - Market size and forecast 2023-2028 ($ million)
- Chart on China - Year-over-year growth 2023-2028 (%)
- Data Table on China - Year-over-year growth 2023-2028 (%)
- 9.10 France - Market size and forecast 2023-2028
- Chart on France - Market size and forecast 2023-2028 ($ million)
- Data Table on France - Market size and forecast 2023-2028 ($ million)
- Chart on France - Year-over-year growth 2023-2028 (%)
- Data Table on France - Year-over-year growth 2023-2028 (%)
- 9.11 Canada - Market size and forecast 2023-2028
- Chart on Canada - Market size and forecast 2023-2028 ($ million)
- Data Table on Canada - Market size and forecast 2023-2028 ($ million)
- Chart on Canada - Year-over-year growth 2023-2028 (%)
- Data Table on Canada - Year-over-year growth 2023-2028 (%)
- 9.12 Japan - Market size and forecast 2023-2028
- Chart on Japan - Market size and forecast 2023-2028 ($ million)
- Data Table on Japan - Market size and forecast 2023-2028 ($ million)
- Chart on Japan - Year-over-year growth 2023-2028 (%)
- Data Table on Japan - Year-over-year growth 2023-2028 (%)
- 9.13 Market opportunity By Geographical Landscape
- Market opportunity By Geographical Landscape ($ million)
- Data Tables on Market opportunity By Geographical Landscape ($ million)
10 Drivers, Challenges, and Opportunity/Restraints
- 10.1 Market drivers
- 10.2 Market challenges
- 10.3 Impact of drivers and challenges
- Impact of drivers and challenges in 2023 and 2028
- 10.4 Market opportunities/restraints
11 Competitive Landscape
- 11.1 Overview
- 11.2 Competitive Landscape
- Overview on criticality of inputs and factors of differentiation
- 11.3 Landscape disruption
- Overview on factors of disruption
- 11.4 Industry risks
- Impact of key risks on business
12 Competitive Analysis
- 12.1 Companies profiled
- Companies covered
- 12.2 Market positioning of companies
- Matrix on companies position and classification
- 12.3 AbbVie Inc.
- AbbVie Inc. - Overview
- AbbVie Inc. - Product / Service
- AbbVie Inc. - Key news
- AbbVie Inc. - Key offerings
- 12.4 Afaxys Pharma LLC
- Afaxys Pharma LLC - Overview
- Afaxys Pharma LLC - Product / Service
- Afaxys Pharma LLC - Key offerings
- 12.5 Agile Therapeutics Inc.
- Agile Therapeutics Inc. - Overview
- Agile Therapeutics Inc. - Product / Service
- Agile Therapeutics Inc. - Key offerings
- 12.6 Ansell Ltd.
- Ansell Ltd. - Overview
- Ansell Ltd. - Business segments
- Ansell Ltd. - Key news
- Ansell Ltd. - Key offerings
- Ansell Ltd. - Segment focus
- 12.7 Bayer AG
- Bayer AG - Overview
- Bayer AG - Business segments
- Bayer AG - Key news
- Bayer AG - Key offerings
- Bayer AG - Segment focus
- 12.8 The Cooper Companies Inc.
- The Cooper Companies Inc. - Overview
- The Cooper Companies Inc. - Product / Service
- The Cooper Companies Inc. - Key offerings
- 12.9 Cupid Ltd.
- Cupid Ltd. - Overview
- Cupid Ltd. - Product / Service
- Cupid Ltd. - Key offerings
- 12.10 Johnson and Johnson Services Inc.
- Johnson and Johnson Services Inc. - Overview
- Johnson and Johnson Services Inc. - Business segments
- Johnson and Johnson Services Inc. - Key news
- Johnson and Johnson Services Inc. - Key offerings
- Johnson and Johnson Services Inc. - Segment focus
- 12.11 Mayer Laboratories Inc.
- Mayer Laboratories Inc. - Overview
- Mayer Laboratories Inc. - Product / Service
- Mayer Laboratories Inc. - Key offerings
- 12.12 Merck and Co. Inc.
- Merck and Co. Inc. - Overview
- Merck and Co. Inc. - Business segments
- Merck and Co. Inc. - Key news
- Merck and Co. Inc. - Key offerings
- Merck and Co. Inc. - Segment focus
- 12.13 Pfizer Inc.
- Pfizer Inc. - Overview
- Pfizer Inc. - Product / Service
- Pfizer Inc. - Key news
- Pfizer Inc. - Key offerings
- 12.14 Reckitt Benckiser Group Plc
- Reckitt Benckiser Group Plc - Overview
- Reckitt Benckiser Group Plc - Business segments
- Reckitt Benckiser Group Plc - Key news
- Reckitt Benckiser Group Plc - Key offerings
- Reckitt Benckiser Group Plc - Segment focus
- 12.15 Teva Pharmaceutical Industries Ltd.
- Teva Pharmaceutical Industries Ltd. - Overview
- Teva Pharmaceutical Industries Ltd. - Business segments
- Teva Pharmaceutical Industries Ltd. - Key news
- Teva Pharmaceutical Industries Ltd. - Key offerings
- Teva Pharmaceutical Industries Ltd. - Segment focus
- 12.16 Veru Inc.
- Veru Inc. - Overview
- Veru Inc. - Business segments
- Veru Inc. - Key news
- Veru Inc. - Key offerings
- Veru Inc. - Segment focus
- 12.17 Viatris Inc.
- Viatris Inc. - Overview
- Viatris Inc. - Business segments
- Viatris Inc. - Key news
- Viatris Inc. - Key offerings
- Viatris Inc. - Segment focus
13 Appendix
- 13.1 Scope of the report
- 13.2 Inclusions and exclusions checklist
- Inclusions checklist
- Exclusions checklist
- 13.3 Currency conversion rates for US$
- Currency conversion rates for US$
- 13.4 Research methodology
- Research methodology
- 13.5 Data procurement
- Information sources
- 13.6 Data validation
- Data validation
- 13.7 Validation techniques employed for market sizing
- Validation techniques employed for market sizing
- 13.8 Data synthesis
- Data synthesis
- 13.9 360 degree market analysis
- 360 degree market analysis
- 13.10 List of abbreviations
- List of abbreviations

