|
|
市場調査レポート
商品コード
1697274
フラックサンドの世界市場 2025~2029年Global Frac Sand Market 2025-2029 |
||||||
|
|||||||
カスタマイズ可能
|
|||||||


| フラックサンドの世界市場 2025~2029年 |
|
出版日: 2025年03月28日
発行: TechNavio
ページ情報: 英文 221 Pages
納期: 即納可能
|

全表示
- 概要
- 図表
- 目次
フラックサンド市場は2024-2029年に53億3,850万米ドル、予測期間中のCAGRは10.1%で成長すると予測されます。
当レポートでは、フラックサンド市場の全体的な分析、市場規模・予測、動向、成長促進要因、課題、約25のベンダーを網羅したベンダー分析などを掲載しています。
現在の市場シナリオ、最新動向と促進要因、市場環境全体に関する最新分析を提供しています。非従来型石油・ガス資源の豊富さ、細目の未加工フラックサンドの需要拡大、廃棄物削減のための破砕現場での技術革新などが市場を牽引しています。
| 市場範囲 | |
|---|---|
| 基準年 | 2025 |
| 終了年 | 2029 |
| 予測期間 | 2025-2029 |
| 成長モメンタム | 加速 |
| 前年比2025年 | 8.8% |
| CAGR | 10.1% |
| 増分額 | 53億3,850万米ドル |
本調査は、業界の主要参加者からのインプットを含め、一次情報と二次情報を客観的に組み合わせて実施しました。レポートには、主要企業の分析に加え、包括的な市場規模データ、地域別分析によるセグメント、ベンダー情勢が含まれています。レポートには過去データと予測データがあります。
本調査では、今後数年間のフラックサンド市場の成長を促進する主な理由の一つとして、石油精製の増加を挙げています。また、グリーンフラッキング法の採用の増加とiotのアプリケーションの増加は、市場の大きな需要につながります。
目次
第1章 エグゼクティブサマリー
- 市場概要
第2章 Technavio分析
- 価格・ライフサイクル・顧客購入バスケット・採用率・購入基準の分析
- インプットの重要性と差別化の要因
- 混乱の要因
- 促進要因と課題の影響
第3章 市場情勢
- 市場エコシステム
- 市場の特徴
- バリューチェーン分析
第4章 市場規模
- 市場の定義
- 市場セグメント分析
- 市場規模 2024
- 市場の見通し 2024-2029
第5章 市場規模実績
- フラックサンドの世界市場 2019-2023
- 方法別セグメント分析 2019-2023
- タイプ別セグメント分析 2019-2023
- 用途別セグメント分析 2019-2023
- 地域別セグメント分析 2019-2023
- 国別セグメント分析 2019-2023
第6章 定性分析
- AIの影響:フラックサンドの世界市場
第7章 ファイブフォース分析
- ファイブフォースの要約
- 買い手の交渉力
- 供給企業の交渉力
- 新規参入業者の脅威
- 代替品の脅威
- 競争の脅威
- 市況
第8章 市場セグメンテーション:方法別
- 市場セグメント
- 比較:方法別
- 石油探査:市場規模と予測 2024-2029
- 天然ガス探査:市場規模と予測 2024-2029
- 市場機会:方法別
第9章 市場セグメンテーション:タイプ別
- 市場セグメント
- 比較:タイプ別
- ホワイトフラック:市場規模と予測 2024-2029
- ブラウンフラック:市場規模と予測 2024-2029
- 市場機会:タイプ別
第10章 市場セグメンテーション:用途別
- 市場セグメント
- 比較:用途別
- 水圧破砕:市場規模と予測 2024-2029
- 鋳物鋳造:市場規模と予測 2024-2029
- 研磨ブラスト:市場規模と予測 2024-2029
- ガラス製造:市場規模と予測 2024-2029
- その他:市場規模と予測 2024-2029
- 市場機会:用途別
第11章 顧客情勢
- 顧客情勢の概要
第12章 地域別情勢
- 地域別セグメンテーション
- 地域別比較
- 北米:市場規模と予測 2024-2029
- 欧州:市場規模と予測 2024-2029
- アジア太平洋:市場規模と予測 2024-2029
- 中東・アフリカ:市場規模と予測 2024-2029
- 南米:市場規模と予測 2024-2029
- 米国:市場規模と予測 2024-2029
- カナダ:市場規模と予測 2024-2029
- メキシコ:市場規模と予測 2024-2029
- ドイツ:市場規模と予測 2024-2029
- 中国:市場規模と予測 2024-2029
- 日本:市場規模と予測 2024-2029
- 英国:市場規模と予測 2024-2029
- インド:市場規模と予測 2024-2029
- フランス:市場規模と予測 2024-2029
- イタリア:市場規模と予測 2024-2029
- 市場機会:地域情勢別
第13章 促進要因・課題・機会・抑制要因
- 市場促進要因
- 市場の課題
- 促進要因と課題の影響
- 市場の機会・抑制要因
第14章 競合情勢
- 概要
- 競合情勢
- 混乱の状況
- 業界のリスク
第15章 競合分析
- 企業プロファイル
- 企業ランキング指数
- 企業の市場ポジショニング
- Athabasca Minerals Inc.
- Badger Mining Corp.
- CARBO Ceramics Inc.
- Chongqing Changjiang River Moulding Material Group Co. Ltd.
- Covia Holdings LLC
- Diversity Technologies Corp.
- Emerge Energy Services LP
- Hi Crush Inc.
- Preferred Proppants LLC
- SCR Sibelco NV
- Sierra Frac Sand LLC
- SmartSand Inc.
- Source Energy Services Ltd.
- US Silica Holdings Inc.
- Vista Proppants and Logistics
第16章 付録
Exhibits:
- Exhibits1: Executive Summary - Chart on Market Overview
- Exhibits2: Executive Summary - Data Table on Market Overview
- Exhibits3: Executive Summary - Chart on Global Market Characteristics
- Exhibits4: Executive Summary - Chart on Market By Geographical Landscape
- Exhibits5: Executive Summary - Chart on Market Segmentation by Method
- Exhibits6: Executive Summary - Chart on Market Segmentation by Type
- Exhibits7: Executive Summary - Chart on Market Segmentation by Application
- Exhibits8: Executive Summary - Chart on Incremental Growth
- Exhibits9: Executive Summary - Data Table on Incremental Growth
- Exhibits10: Executive Summary - Chart on Company Market Positioning
- Exhibits11: Analysis of price sensitivity, lifecycle, customer purchase basket, adoption rates, and purchase criteria
- Exhibits12: Overview on criticality of inputs and factors of differentiation
- Exhibits13: Overview on factors of disruption
- Exhibits14: Impact of drivers and challenges in 2024 and 2029
- Exhibits15: Parent Market
- Exhibits16: Data Table on - Parent Market
- Exhibits17: Market characteristics analysis
- Exhibits18: Value chain analysis
- Exhibits19: Offerings of companies included in the market definition
- Exhibits20: Market segments
- Exhibits21: Chart on Global - Market size and forecast 2024-2029 ($ million)
- Exhibits22: Data Table on Global - Market size and forecast 2024-2029 ($ million)
- Exhibits23: Chart on Global Market: Year-over-year growth 2024-2029 (%)
- Exhibits24: Data Table on Global Market: Year-over-year growth 2024-2029 (%)
- Exhibits25: Historic Market Size - Data Table on Global Frac Sand Market 2019 - 2023 ($ million)
- Exhibits26: Historic Market Size - Method Segment 2019 - 2023 ($ million)
- Exhibits27: Historic Market Size - Type Segment 2019 - 2023 ($ million)
- Exhibits28: Historic Market Size - Application Segment 2019 - 2023 ($ million)
- Exhibits29: Historic Market Size - Geography Segment 2019 - 2023 ($ million)
- Exhibits30: Historic Market Size - Country Segment 2019 - 2023 ($ million)
- Exhibits31: Five forces analysis - Comparison between 2024 and 2029
- Exhibits32: Bargaining power of buyers - Impact of key factors 2024 and 2029
- Exhibits33: Bargaining power of suppliers - Impact of key factors in 2024 and 2029
- Exhibits34: Threat of new entrants - Impact of key factors in 2024 and 2029
- Exhibits35: Threat of substitutes - Impact of key factors in 2024 and 2029
- Exhibits36: Threat of rivalry - Impact of key factors in 2024 and 2029
- Exhibits37: Chart on Market condition - Five forces 2024 and 2029
- Exhibits38: Chart on Method - Market share 2024-2029 (%)
- Exhibits39: Data Table on Method - Market share 2024-2029 (%)
- Exhibits40: Chart on Comparison by Method
- Exhibits41: Data Table on Comparison by Method
- Exhibits42: Chart on Oil exploration - Market size and forecast 2024-2029 ($ million)
- Exhibits43: Data Table on Oil exploration - Market size and forecast 2024-2029 ($ million)
- Exhibits44: Chart on Oil exploration - Year-over-year growth 2024-2029 (%)
- Exhibits45: Data Table on Oil exploration - Year-over-year growth 2024-2029 (%)
- Exhibits46: Chart on Natural gas exploration - Market size and forecast 2024-2029 ($ million)
- Exhibits47: Data Table on Natural gas exploration - Market size and forecast 2024-2029 ($ million)
- Exhibits48: Chart on Natural gas exploration - Year-over-year growth 2024-2029 (%)
- Exhibits49: Data Table on Natural gas exploration - Year-over-year growth 2024-2029 (%)
- Exhibits50: Market opportunity by Method ($ million)
- Exhibits51: Data Table on Market opportunity by Method ($ million)
- Exhibits52: Chart on Type - Market share 2024-2029 (%)
- Exhibits53: Data Table on Type - Market share 2024-2029 (%)
- Exhibits54: Chart on Comparison by Type
- Exhibits55: Data Table on Comparison by Type
- Exhibits56: Chart on White frac - Market size and forecast 2024-2029 ($ million)
- Exhibits57: Data Table on White frac - Market size and forecast 2024-2029 ($ million)
- Exhibits58: Chart on White frac - Year-over-year growth 2024-2029 (%)
- Exhibits59: Data Table on White frac - Year-over-year growth 2024-2029 (%)
- Exhibits60: Chart on Brown frac - Market size and forecast 2024-2029 ($ million)
- Exhibits61: Data Table on Brown frac - Market size and forecast 2024-2029 ($ million)
- Exhibits62: Chart on Brown frac - Year-over-year growth 2024-2029 (%)
- Exhibits63: Data Table on Brown frac - Year-over-year growth 2024-2029 (%)
- Exhibits64: Market opportunity by Type ($ million)
- Exhibits65: Data Table on Market opportunity by Type ($ million)
- Exhibits66: Chart on Application - Market share 2024-2029 (%)
- Exhibits67: Data Table on Application - Market share 2024-2029 (%)
- Exhibits68: Chart on Comparison by Application
- Exhibits69: Data Table on Comparison by Application
- Exhibits70: Chart on Hydraulic fracturing - Market size and forecast 2024-2029 ($ million)
- Exhibits71: Data Table on Hydraulic fracturing - Market size and forecast 2024-2029 ($ million)
- Exhibits72: Chart on Hydraulic fracturing - Year-over-year growth 2024-2029 (%)
- Exhibits73: Data Table on Hydraulic fracturing - Year-over-year growth 2024-2029 (%)
- Exhibits74: Chart on Foundry casting - Market size and forecast 2024-2029 ($ million)
- Exhibits75: Data Table on Foundry casting - Market size and forecast 2024-2029 ($ million)
- Exhibits76: Chart on Foundry casting - Year-over-year growth 2024-2029 (%)
- Exhibits77: Data Table on Foundry casting - Year-over-year growth 2024-2029 (%)
- Exhibits78: Chart on Abrasive blasting - Market size and forecast 2024-2029 ($ million)
- Exhibits79: Data Table on Abrasive blasting - Market size and forecast 2024-2029 ($ million)
- Exhibits80: Chart on Abrasive blasting - Year-over-year growth 2024-2029 (%)
- Exhibits81: Data Table on Abrasive blasting - Year-over-year growth 2024-2029 (%)
- Exhibits82: Chart on Glass manufacturing - Market size and forecast 2024-2029 ($ million)
- Exhibits83: Data Table on Glass manufacturing - Market size and forecast 2024-2029 ($ million)
- Exhibits84: Chart on Glass manufacturing - Year-over-year growth 2024-2029 (%)
- Exhibits85: Data Table on Glass manufacturing - Year-over-year growth 2024-2029 (%)
- Exhibits86: Chart on Others - Market size and forecast 2024-2029 ($ million)
- Exhibits87: Data Table on Others - Market size and forecast 2024-2029 ($ million)
- Exhibits88: Chart on Others - Year-over-year growth 2024-2029 (%)
- Exhibits89: Data Table on Others - Year-over-year growth 2024-2029 (%)
- Exhibits90: Market opportunity by Application ($ million)
- Exhibits91: Data Table on Market opportunity by Application ($ million)
- Exhibits92: Analysis of price sensitivity, lifecycle, customer purchase basket, adoption rates, and purchase criteria
- Exhibits93: Chart on Market share By Geographical Landscape 2024-2029 (%)
- Exhibits94: Data Table on Market share By Geographical Landscape 2024-2029 (%)
- Exhibits95: Chart on Geographic comparison
- Exhibits96: Data Table on Geographic comparison
- Exhibits97: Chart on North America - Market size and forecast 2024-2029 ($ million)
- Exhibits98: Data Table on North America - Market size and forecast 2024-2029 ($ million)
- Exhibits99: Chart on North America - Year-over-year growth 2024-2029 (%)
- Exhibits100: Data Table on North America - Year-over-year growth 2024-2029 (%)
- Exhibits101: Chart on Europe - Market size and forecast 2024-2029 ($ million)
- Exhibits102: Data Table on Europe - Market size and forecast 2024-2029 ($ million)
- Exhibits103: Chart on Europe - Year-over-year growth 2024-2029 (%)
- Exhibits104: Data Table on Europe - Year-over-year growth 2024-2029 (%)
- Exhibits105: Chart on APAC - Market size and forecast 2024-2029 ($ million)
- Exhibits106: Data Table on APAC - Market size and forecast 2024-2029 ($ million)
- Exhibits107: Chart on APAC - Year-over-year growth 2024-2029 (%)
- Exhibits108: Data Table on APAC - Year-over-year growth 2024-2029 (%)
- Exhibits109: Chart on Middle East and Africa - Market size and forecast 2024-2029 ($ million)
- Exhibits110: Data Table on Middle East and Africa - Market size and forecast 2024-2029 ($ million)
- Exhibits111: Chart on Middle East and Africa - Year-over-year growth 2024-2029 (%)
- Exhibits112: Data Table on Middle East and Africa - Year-over-year growth 2024-2029 (%)
- Exhibits113: Chart on South America - Market size and forecast 2024-2029 ($ million)
- Exhibits114: Data Table on South America - Market size and forecast 2024-2029 ($ million)
- Exhibits115: Chart on South America - Year-over-year growth 2024-2029 (%)
- Exhibits116: Data Table on South America - Year-over-year growth 2024-2029 (%)
- Exhibits117: Chart on US - Market size and forecast 2024-2029 ($ million)
- Exhibits118: Data Table on US - Market size and forecast 2024-2029 ($ million)
- Exhibits119: Chart on US - Year-over-year growth 2024-2029 (%)
- Exhibits120: Data Table on US - Year-over-year growth 2024-2029 (%)
- Exhibits121: Chart on Canada - Market size and forecast 2024-2029 ($ million)
- Exhibits122: Data Table on Canada - Market size and forecast 2024-2029 ($ million)
- Exhibits123: Chart on Canada - Year-over-year growth 2024-2029 (%)
- Exhibits124: Data Table on Canada - Year-over-year growth 2024-2029 (%)
- Exhibits125: Chart on Mexico - Market size and forecast 2024-2029 ($ million)
- Exhibits126: Data Table on Mexico - Market size and forecast 2024-2029 ($ million)
- Exhibits127: Chart on Mexico - Year-over-year growth 2024-2029 (%)
- Exhibits128: Data Table on Mexico - Year-over-year growth 2024-2029 (%)
- Exhibits129: Chart on Germany - Market size and forecast 2024-2029 ($ million)
- Exhibits130: Data Table on Germany - Market size and forecast 2024-2029 ($ million)
- Exhibits131: Chart on Germany - Year-over-year growth 2024-2029 (%)
- Exhibits132: Data Table on Germany - Year-over-year growth 2024-2029 (%)
- Exhibits133: Chart on China - Market size and forecast 2024-2029 ($ million)
- Exhibits134: Data Table on China - Market size and forecast 2024-2029 ($ million)
- Exhibits135: Chart on China - Year-over-year growth 2024-2029 (%)
- Exhibits136: Data Table on China - Year-over-year growth 2024-2029 (%)
- Exhibits137: Chart on Japan - Market size and forecast 2024-2029 ($ million)
- Exhibits138: Data Table on Japan - Market size and forecast 2024-2029 ($ million)
- Exhibits139: Chart on Japan - Year-over-year growth 2024-2029 (%)
- Exhibits140: Data Table on Japan - Year-over-year growth 2024-2029 (%)
- Exhibits141: Chart on UK - Market size and forecast 2024-2029 ($ million)
- Exhibits142: Data Table on UK - Market size and forecast 2024-2029 ($ million)
- Exhibits143: Chart on UK - Year-over-year growth 2024-2029 (%)
- Exhibits144: Data Table on UK - Year-over-year growth 2024-2029 (%)
- Exhibits145: Chart on India - Market size and forecast 2024-2029 ($ million)
- Exhibits146: Data Table on India - Market size and forecast 2024-2029 ($ million)
- Exhibits147: Chart on India - Year-over-year growth 2024-2029 (%)
- Exhibits148: Data Table on India - Year-over-year growth 2024-2029 (%)
- Exhibits149: Chart on France - Market size and forecast 2024-2029 ($ million)
- Exhibits150: Data Table on France - Market size and forecast 2024-2029 ($ million)
- Exhibits151: Chart on France - Year-over-year growth 2024-2029 (%)
- Exhibits152: Data Table on France - Year-over-year growth 2024-2029 (%)
- Exhibits153: Chart on Italy - Market size and forecast 2024-2029 ($ million)
- Exhibits154: Data Table on Italy - Market size and forecast 2024-2029 ($ million)
- Exhibits155: Chart on Italy - Year-over-year growth 2024-2029 (%)
- Exhibits156: Data Table on Italy - Year-over-year growth 2024-2029 (%)
- Exhibits157: Market opportunity By Geographical Landscape ($ million)
- Exhibits158: Data Tables on Market opportunity By Geographical Landscape ($ million)
- Exhibits159: Impact of drivers and challenges in 2024 and 2029
- Exhibits160: Overview on criticality of inputs and factors of differentiation
- Exhibits161: Overview on factors of disruption
- Exhibits162: Impact of key risks on business
- Exhibits163: Companies covered
- Exhibits164: Company ranking index
- Exhibits165: Matrix on companies position and classification
- Exhibits166: Athabasca Minerals Inc. - Overview
- Exhibits167: Athabasca Minerals Inc. - Product / Service
- Exhibits168: Athabasca Minerals Inc. - Key offerings
- Exhibits169: SWOT
- Exhibits170: Badger Mining Corp. - Overview
- Exhibits171: Badger Mining Corp. - Product / Service
- Exhibits172: Badger Mining Corp. - Key offerings
- Exhibits173: SWOT
- Exhibits174: CARBO Ceramics Inc. - Overview
- Exhibits175: CARBO Ceramics Inc. - Product / Service
- Exhibits176: CARBO Ceramics Inc. - Key offerings
- Exhibits177: SWOT
- Exhibits178: Chongqing Changjiang River Moulding Material Group Co. Ltd. - Overview
- Exhibits179: Chongqing Changjiang River Moulding Material Group Co. Ltd. - Product / Service
- Exhibits180: Chongqing Changjiang River Moulding Material Group Co. Ltd. - Key offerings
- Exhibits181: SWOT
- Exhibits182: Covia Holdings LLC - Overview
- Exhibits183: Covia Holdings LLC - Product / Service
- Exhibits184: Covia Holdings LLC - Key news
- Exhibits185: Covia Holdings LLC - Key offerings
- Exhibits186: SWOT
- Exhibits187: Diversity Technologies Corp. - Overview
- Exhibits188: Diversity Technologies Corp. - Product / Service
- Exhibits189: Diversity Technologies Corp. - Key offerings
- Exhibits190: SWOT
- Exhibits191: Emerge Energy Services LP - Overview
- Exhibits192: Emerge Energy Services LP - Product / Service
- Exhibits193: Emerge Energy Services LP - Key offerings
- Exhibits194: SWOT
- Exhibits195: Hi Crush Inc. - Overview
- Exhibits196: Hi Crush Inc. - Product / Service
- Exhibits197: Hi Crush Inc. - Key offerings
- Exhibits198: SWOT
- Exhibits199: Preferred Proppants LLC - Overview
- Exhibits200: Preferred Proppants LLC - Product / Service
- Exhibits201: Preferred Proppants LLC - Key offerings
- Exhibits202: SWOT
- Exhibits203: SCR Sibelco NV - Overview
- Exhibits204: SCR Sibelco NV - Product / Service
- Exhibits205: SCR Sibelco NV - Key news
- Exhibits206: SCR Sibelco NV - Key offerings
- Exhibits207: SWOT
- Exhibits208: Sierra Frac Sand LLC - Overview
- Exhibits209: Sierra Frac Sand LLC - Product / Service
- Exhibits210: Sierra Frac Sand LLC - Key offerings
- Exhibits211: SWOT
- Exhibits212: SmartSand Inc. - Overview
- Exhibits213: SmartSand Inc. - Business segments
- Exhibits214: SmartSand Inc. - Key offerings
- Exhibits215: SmartSand Inc. - Segment focus
- Exhibits216: SWOT
- Exhibits217: Source Energy Services Ltd. - Overview
- Exhibits218: Source Energy Services Ltd. - Product / Service
- Exhibits219: Source Energy Services Ltd. - Key news
- Exhibits220: Source Energy Services Ltd. - Key offerings
- Exhibits221: SWOT
- Exhibits222: US Silica Holdings Inc. - Overview
- Exhibits223: US Silica Holdings Inc. - Business segments
- Exhibits224: US Silica Holdings Inc. - Key offerings
- Exhibits225: US Silica Holdings Inc. - Segment focus
- Exhibits226: SWOT
- Exhibits227: Vista Proppants and Logistics - Overview
- Exhibits228: Vista Proppants and Logistics - Product / Service
- Exhibits229: Vista Proppants and Logistics - Key offerings
- Exhibits230: SWOT
- Exhibits231: Inclusions checklist
- Exhibits232: Exclusions checklist
- Exhibits233: Currency conversion rates for US$
- Exhibits234: Research methodology
- Exhibits235: Information sources
- Exhibits236: Data validation
- Exhibits237: Validation techniques employed for market sizing
- Exhibits238: Data synthesis
- Exhibits239: 360 degree market analysis
- Exhibits240: List of abbreviations
The frac sand market is forecasted to grow by USD 5338.5 mn during 2024-2029, accelerating at a CAGR of 10.1% during the forecast period. The report on the frac sand market provides a holistic analysis, market size and forecast, trends, growth drivers, and challenges, as well as vendor analysis covering around 25 vendors.
The report offers an up-to-date analysis regarding the current market scenario, the latest trends and drivers, and the overall market environment. The market is driven by abundance of unconventional oil and gas resources, growing demand for fine mesh raw frac sand, and innovation at frac sites to reduce wastage.
| Market Scope | |
|---|---|
| Base Year | 2025 |
| End Year | 2029 |
| Series Year | 2025-2029 |
| Growth Momentum | Accelerate |
| YOY 2025 | 8.8% |
| CAGR | 10.1% |
| Incremental Value | $5338.5 mn |
The study was conducted using an objective combination of primary and secondary information including inputs from key participants in the industry. The report contains a comprehensive market size data, segment with regional analysis and vendor landscape in addition to an analysis of the key companies. Reports have historic and forecast data.
Technavio's frac sand market is segmented as below:
By Method
- Oil exploration
- Natural gas exploration
By Type
- White frac
- Brown frac
By Application
- Hydraulic fracturing
- Foundry casting
- Abrasive blasting
- Glass manufacturing
- Others
By Geographical Landscape
- North America
- Europe
- APAC
- Middle East and Africa
- South America
This study identifies the growing petroleum refining as one of the prime reasons driving the frac sand market growth during the next few years. Also, rise in adoption of green fracking methods and increasing applications of iot will lead to sizable demand in the market.
The report on the frac sand market covers the following areas:
- Frac Sand Market sizing
- Frac Sand Market forecast
- Frac Sand Market industry analysis
The robust vendor analysis is designed to help clients improve their market position, and in line with this, this report provides a detailed analysis of several leading frac sand market vendors that include Athabasca Minerals Inc., Atlas Sand Co. LLC, Badger Mining Corp., CARBO Ceramics Inc., Chongqing Changjiang River Moulding Material Group Co. Ltd., Covia Holdings LLC, Diversity Technologies Corp., Emerge Energy Services LP, FEECO International Inc., Hi Crush Inc., Permian Frac Sand LLC, Preferred Proppants LLC, SCR Sibelco NV, Sierra Frac Sand LLC, SmartSand Inc., Source Energy Services Ltd., US Silica Holdings Inc., Victory Nickel Inc., and Vista Proppants and Logistics. Also, the frac sand market analysis report includes information on upcoming trends and challenges that will influence market growth. This is to help companies strategize and leverage all forthcoming growth opportunities.
The publisher presents a detailed picture of the market by the way of study, synthesis, and summation of data from multiple sources by an analysis of key parameters such as profit, pricing, competition, and promotions. It presents various market facets by identifying the key industry influencers. The data presented is comprehensive, reliable, and a result of extensive primary and secondary research. The market research reports provide a complete competitive landscape and an in-depth vendor selection methodology and analysis using qualitative and quantitative research to forecast accurate market growth.
Table of Contents
1 Executive Summary
- 1.1 Market overview
- Executive Summary - Chart on Market Overview
- Executive Summary - Data Table on Market Overview
- Executive Summary - Chart on Global Market Characteristics
- Executive Summary - Chart on Market By Geographical Landscape
- Executive Summary - Chart on Market Segmentation by Method
- Executive Summary - Chart on Market Segmentation by Type
- Executive Summary - Chart on Market Segmentation by Application
- Executive Summary - Chart on Incremental Growth
- Executive Summary - Data Table on Incremental Growth
- Executive Summary - Chart on Company Market Positioning
2 Technavio Analysis
- 2.1 Analysis of price sensitivity, lifecycle, customer purchase basket, adoption rates, and purchase criteria
- Analysis of price sensitivity, lifecycle, customer purchase basket, adoption rates, and purchase criteria
- 2.2 Criticality of inputs and Factors of differentiation
- Overview on criticality of inputs and factors of differentiation
- 2.3 Factors of disruption
- Overview on factors of disruption
- 2.4 Impact of drivers and challenges
- Impact of drivers and challenges in 2024 and 2029
3 Market Landscape
- 3.1 Market ecosystem
- Parent Market
- Data Table on - Parent Market
- 3.2 Market characteristics
- Market characteristics analysis
- 3.3 Value chain analysis
- Value chain analysis
4 Market Sizing
- 4.1 Market definition
- Offerings of companies included in the market definition
- 4.2 Market segment analysis
- Market segments
- 4.3 Market size 2024
- 4.4 Market outlook: Forecast for 2024-2029
- Chart on Global - Market size and forecast 2024-2029 ($ million)
- Data Table on Global - Market size and forecast 2024-2029 ($ million)
- Chart on Global Market: Year-over-year growth 2024-2029 (%)
- Data Table on Global Market: Year-over-year growth 2024-2029 (%)
5 Historic Market Size
- 5.1 Global Frac Sand Market 2019 - 2023
- Historic Market Size - Data Table on Global Frac Sand Market 2019 - 2023 ($ million)
- 5.2 Method segment analysis 2019 - 2023
- Historic Market Size - Method Segment 2019 - 2023 ($ million)
- 5.3 Type segment analysis 2019 - 2023
- Historic Market Size - Type Segment 2019 - 2023 ($ million)
- 5.4 Application segment analysis 2019 - 2023
- Historic Market Size - Application Segment 2019 - 2023 ($ million)
- 5.5 Geography segment analysis 2019 - 2023
- Historic Market Size - Geography Segment 2019 - 2023 ($ million)
- 5.6 Country segment analysis 2019 - 2023
- Historic Market Size - Country Segment 2019 - 2023 ($ million)
6 Qualitative Analysis
- 6.1 Impact of AI on Global Frac Sand Market
7 Five Forces Analysis
- 7.1 Five forces summary
- Five forces analysis - Comparison between 2024 and 2029
- 7.2 Bargaining power of buyers
- Bargaining power of buyers - Impact of key factors 2024 and 2029
- 7.3 Bargaining power of suppliers
- Bargaining power of suppliers - Impact of key factors in 2024 and 2029
- 7.4 Threat of new entrants
- Threat of new entrants - Impact of key factors in 2024 and 2029
- 7.5 Threat of substitutes
- Threat of substitutes - Impact of key factors in 2024 and 2029
- 7.6 Threat of rivalry
- Threat of rivalry - Impact of key factors in 2024 and 2029
- 7.7 Market condition
- Chart on Market condition - Five forces 2024 and 2029
8 Market Segmentation by Method
- 8.1 Market segments
- Chart on Method - Market share 2024-2029 (%)
- Data Table on Method - Market share 2024-2029 (%)
- 8.2 Comparison by Method
- Chart on Comparison by Method
- Data Table on Comparison by Method
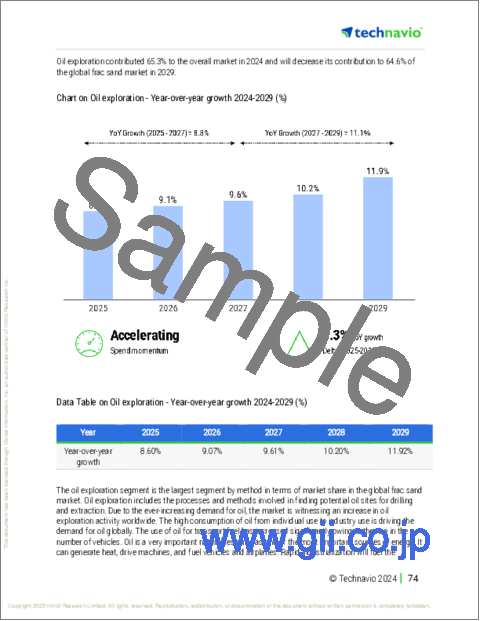
- 8.3 Oil exploration - Market size and forecast 2024-2029
- Chart on Oil exploration - Market size and forecast 2024-2029 ($ million)
- Data Table on Oil exploration - Market size and forecast 2024-2029 ($ million)
- Chart on Oil exploration - Year-over-year growth 2024-2029 (%)
- Data Table on Oil exploration - Year-over-year growth 2024-2029 (%)
- 8.4 Natural gas exploration - Market size and forecast 2024-2029
- Chart on Natural gas exploration - Market size and forecast 2024-2029 ($ million)
- Data Table on Natural gas exploration - Market size and forecast 2024-2029 ($ million)
- Chart on Natural gas exploration - Year-over-year growth 2024-2029 (%)
- Data Table on Natural gas exploration - Year-over-year growth 2024-2029 (%)
- 8.5 Market opportunity by Method
- Market opportunity by Method ($ million)
- Data Table on Market opportunity by Method ($ million)
9 Market Segmentation by Type
- 9.1 Market segments
- Chart on Type - Market share 2024-2029 (%)
- Data Table on Type - Market share 2024-2029 (%)
- 9.2 Comparison by Type
- Chart on Comparison by Type
- Data Table on Comparison by Type
- 9.3 White frac - Market size and forecast 2024-2029
- Chart on White frac - Market size and forecast 2024-2029 ($ million)
- Data Table on White frac - Market size and forecast 2024-2029 ($ million)
- Chart on White frac - Year-over-year growth 2024-2029 (%)
- Data Table on White frac - Year-over-year growth 2024-2029 (%)
- 9.4 Brown frac - Market size and forecast 2024-2029
- Chart on Brown frac - Market size and forecast 2024-2029 ($ million)
- Data Table on Brown frac - Market size and forecast 2024-2029 ($ million)
- Chart on Brown frac - Year-over-year growth 2024-2029 (%)
- Data Table on Brown frac - Year-over-year growth 2024-2029 (%)
- 9.5 Market opportunity by Type
- Market opportunity by Type ($ million)
- Data Table on Market opportunity by Type ($ million)
10 Market Segmentation by Application
- 10.1 Market segments
- Chart on Application - Market share 2024-2029 (%)
- Data Table on Application - Market share 2024-2029 (%)
- 10.2 Comparison by Application
- Chart on Comparison by Application
- Data Table on Comparison by Application
- 10.3 Hydraulic fracturing - Market size and forecast 2024-2029
- Chart on Hydraulic fracturing - Market size and forecast 2024-2029 ($ million)
- Data Table on Hydraulic fracturing - Market size and forecast 2024-2029 ($ million)
- Chart on Hydraulic fracturing - Year-over-year growth 2024-2029 (%)
- Data Table on Hydraulic fracturing - Year-over-year growth 2024-2029 (%)
- 10.4 Foundry casting - Market size and forecast 2024-2029
- Chart on Foundry casting - Market size and forecast 2024-2029 ($ million)
- Data Table on Foundry casting - Market size and forecast 2024-2029 ($ million)
- Chart on Foundry casting - Year-over-year growth 2024-2029 (%)
- Data Table on Foundry casting - Year-over-year growth 2024-2029 (%)
- 10.5 Abrasive blasting - Market size and forecast 2024-2029
- Chart on Abrasive blasting - Market size and forecast 2024-2029 ($ million)
- Data Table on Abrasive blasting - Market size and forecast 2024-2029 ($ million)
- Chart on Abrasive blasting - Year-over-year growth 2024-2029 (%)
- Data Table on Abrasive blasting - Year-over-year growth 2024-2029 (%)
- 10.6 Glass manufacturing - Market size and forecast 2024-2029
- Chart on Glass manufacturing - Market size and forecast 2024-2029 ($ million)
- Data Table on Glass manufacturing - Market size and forecast 2024-2029 ($ million)
- Chart on Glass manufacturing - Year-over-year growth 2024-2029 (%)
- Data Table on Glass manufacturing - Year-over-year growth 2024-2029 (%)
- 10.7 Others - Market size and forecast 2024-2029
- Chart on Others - Market size and forecast 2024-2029 ($ million)
- Data Table on Others - Market size and forecast 2024-2029 ($ million)
- Chart on Others - Year-over-year growth 2024-2029 (%)
- Data Table on Others - Year-over-year growth 2024-2029 (%)
- 10.8 Market opportunity by Application
- Market opportunity by Application ($ million)
- Data Table on Market opportunity by Application ($ million)
11 Customer Landscape
- 11.1 Customer landscape overview
- Analysis of price sensitivity, lifecycle, customer purchase basket, adoption rates, and purchase criteria
12 Geographic Landscape
- 12.1 Geographic segmentation
- Chart on Market share By Geographical Landscape 2024-2029 (%)
- Data Table on Market share By Geographical Landscape 2024-2029 (%)
- 12.2 Geographic comparison
- Chart on Geographic comparison
- Data Table on Geographic comparison
- 12.3 North America - Market size and forecast 2024-2029
- Chart on North America - Market size and forecast 2024-2029 ($ million)
- Data Table on North America - Market size and forecast 2024-2029 ($ million)
- Chart on North America - Year-over-year growth 2024-2029 (%)
- Data Table on North America - Year-over-year growth 2024-2029 (%)
- 12.4 Europe - Market size and forecast 2024-2029
- Chart on Europe - Market size and forecast 2024-2029 ($ million)
- Data Table on Europe - Market size and forecast 2024-2029 ($ million)
- Chart on Europe - Year-over-year growth 2024-2029 (%)
- Data Table on Europe - Year-over-year growth 2024-2029 (%)
- 12.5 APAC - Market size and forecast 2024-2029
- Chart on APAC - Market size and forecast 2024-2029 ($ million)
- Data Table on APAC - Market size and forecast 2024-2029 ($ million)
- Chart on APAC - Year-over-year growth 2024-2029 (%)
- Data Table on APAC - Year-over-year growth 2024-2029 (%)
- 12.6 Middle East and Africa - Market size and forecast 2024-2029
- Chart on Middle East and Africa - Market size and forecast 2024-2029 ($ million)
- Data Table on Middle East and Africa - Market size and forecast 2024-2029 ($ million)
- Chart on Middle East and Africa - Year-over-year growth 2024-2029 (%)
- Data Table on Middle East and Africa - Year-over-year growth 2024-2029 (%)
- 12.7 South America - Market size and forecast 2024-2029
- Chart on South America - Market size and forecast 2024-2029 ($ million)
- Data Table on South America - Market size and forecast 2024-2029 ($ million)
- Chart on South America - Year-over-year growth 2024-2029 (%)
- Data Table on South America - Year-over-year growth 2024-2029 (%)
- 12.8 US - Market size and forecast 2024-2029
- Chart on US - Market size and forecast 2024-2029 ($ million)
- Data Table on US - Market size and forecast 2024-2029 ($ million)
- Chart on US - Year-over-year growth 2024-2029 (%)
- Data Table on US - Year-over-year growth 2024-2029 (%)
- 12.9 Canada - Market size and forecast 2024-2029
- Chart on Canada - Market size and forecast 2024-2029 ($ million)
- Data Table on Canada - Market size and forecast 2024-2029 ($ million)
- Chart on Canada - Year-over-year growth 2024-2029 (%)
- Data Table on Canada - Year-over-year growth 2024-2029 (%)
- 12.10 Mexico - Market size and forecast 2024-2029
- Chart on Mexico - Market size and forecast 2024-2029 ($ million)
- Data Table on Mexico - Market size and forecast 2024-2029 ($ million)
- Chart on Mexico - Year-over-year growth 2024-2029 (%)
- Data Table on Mexico - Year-over-year growth 2024-2029 (%)
- 12.11 Germany - Market size and forecast 2024-2029
- Chart on Germany - Market size and forecast 2024-2029 ($ million)
- Data Table on Germany - Market size and forecast 2024-2029 ($ million)
- Chart on Germany - Year-over-year growth 2024-2029 (%)
- Data Table on Germany - Year-over-year growth 2024-2029 (%)
- 12.12 China - Market size and forecast 2024-2029
- Chart on China - Market size and forecast 2024-2029 ($ million)
- Data Table on China - Market size and forecast 2024-2029 ($ million)
- Chart on China - Year-over-year growth 2024-2029 (%)
- Data Table on China - Year-over-year growth 2024-2029 (%)
- 12.13 Japan - Market size and forecast 2024-2029
- Chart on Japan - Market size and forecast 2024-2029 ($ million)
- Data Table on Japan - Market size and forecast 2024-2029 ($ million)
- Chart on Japan - Year-over-year growth 2024-2029 (%)
- Data Table on Japan - Year-over-year growth 2024-2029 (%)
- 12.14 UK - Market size and forecast 2024-2029
- Chart on UK - Market size and forecast 2024-2029 ($ million)
- Data Table on UK - Market size and forecast 2024-2029 ($ million)
- Chart on UK - Year-over-year growth 2024-2029 (%)
- Data Table on UK - Year-over-year growth 2024-2029 (%)
- 12.15 India - Market size and forecast 2024-2029
- Chart on India - Market size and forecast 2024-2029 ($ million)
- Data Table on India - Market size and forecast 2024-2029 ($ million)
- Chart on India - Year-over-year growth 2024-2029 (%)
- Data Table on India - Year-over-year growth 2024-2029 (%)
- 12.16 France - Market size and forecast 2024-2029
- Chart on France - Market size and forecast 2024-2029 ($ million)
- Data Table on France - Market size and forecast 2024-2029 ($ million)
- Chart on France - Year-over-year growth 2024-2029 (%)
- Data Table on France - Year-over-year growth 2024-2029 (%)
- 12.17 Italy - Market size and forecast 2024-2029
- Chart on Italy - Market size and forecast 2024-2029 ($ million)
- Data Table on Italy - Market size and forecast 2024-2029 ($ million)
- Chart on Italy - Year-over-year growth 2024-2029 (%)
- Data Table on Italy - Year-over-year growth 2024-2029 (%)
- 12.18 Market opportunity By Geographical Landscape
- Market opportunity By Geographical Landscape ($ million)
- Data Tables on Market opportunity By Geographical Landscape ($ million)
13 Drivers, Challenges, and Opportunity/Restraints
- 13.1 Market drivers
- 13.2 Market challenges
- 13.3 Impact of drivers and challenges
- Impact of drivers and challenges in 2024 and 2029
- 13.4 Market opportunities/restraints
14 Competitive Landscape
- 14.1 Overview
- 14.2 Competitive Landscape
- Overview on criticality of inputs and factors of differentiation
- 14.3 Landscape disruption
- Overview on factors of disruption
- 14.4 Industry risks
- Impact of key risks on business
15 Competitive Analysis
- 15.1 Companies profiled
- Companies covered
- 15.2 Company ranking index
- Company ranking index
- 15.3 Market positioning of companies
- Matrix on companies position and classification
- 15.4 Athabasca Minerals Inc.
- Athabasca Minerals Inc. - Overview
- Athabasca Minerals Inc. - Product / Service
- Athabasca Minerals Inc. - Key offerings
- SWOT
- 15.5 Badger Mining Corp.
- Badger Mining Corp. - Overview
- Badger Mining Corp. - Product / Service
- Badger Mining Corp. - Key offerings
- SWOT
- 15.6 CARBO Ceramics Inc.
- CARBO Ceramics Inc. - Overview
- CARBO Ceramics Inc. - Product / Service
- CARBO Ceramics Inc. - Key offerings
- SWOT
- 15.7 Chongqing Changjiang River Moulding Material Group Co. Ltd.
- Chongqing Changjiang River Moulding Material Group Co. Ltd. - Overview
- Chongqing Changjiang River Moulding Material Group Co. Ltd. - Product / Service
- Chongqing Changjiang River Moulding Material Group Co. Ltd. - Key offerings
- SWOT
- 15.8 Covia Holdings LLC
- Covia Holdings LLC - Overview
- Covia Holdings LLC - Product / Service
- Covia Holdings LLC - Key news
- Covia Holdings LLC - Key offerings
- SWOT
- 15.9 Diversity Technologies Corp.
- Diversity Technologies Corp. - Overview
- Diversity Technologies Corp. - Product / Service
- Diversity Technologies Corp. - Key offerings
- SWOT
- 15.10 Emerge Energy Services LP
- Emerge Energy Services LP - Overview
- Emerge Energy Services LP - Product / Service
- Emerge Energy Services LP - Key offerings
- SWOT
- 15.11 Hi Crush Inc.
- Hi Crush Inc. - Overview
- Hi Crush Inc. - Product / Service
- Hi Crush Inc. - Key offerings
- SWOT
- 15.12 Preferred Proppants LLC
- Preferred Proppants LLC - Overview
- Preferred Proppants LLC - Product / Service
- Preferred Proppants LLC - Key offerings
- SWOT
- 15.13 SCR Sibelco NV
- SCR Sibelco NV - Overview
- SCR Sibelco NV - Product / Service
- SCR Sibelco NV - Key news
- SCR Sibelco NV - Key offerings
- SWOT
- 15.14 Sierra Frac Sand LLC
- Sierra Frac Sand LLC - Overview
- Sierra Frac Sand LLC - Product / Service
- Sierra Frac Sand LLC - Key offerings
- SWOT
- 15.15 SmartSand Inc.
- SmartSand Inc. - Overview
- SmartSand Inc. - Business segments
- SmartSand Inc. - Key offerings
- SmartSand Inc. - Segment focus
- SWOT
- 15.16 Source Energy Services Ltd.
- Source Energy Services Ltd. - Overview
- Source Energy Services Ltd. - Product / Service
- Source Energy Services Ltd. - Key news
- Source Energy Services Ltd. - Key offerings
- SWOT
- 15.17 US Silica Holdings Inc.
- US Silica Holdings Inc. - Overview
- US Silica Holdings Inc. - Business segments
- US Silica Holdings Inc. - Key offerings
- US Silica Holdings Inc. - Segment focus
- SWOT
- 15.18 Vista Proppants and Logistics
- Vista Proppants and Logistics - Overview
- Vista Proppants and Logistics - Product / Service
- Vista Proppants and Logistics - Key offerings
- SWOT
16 Appendix
- 16.1 Scope of the report
- 16.2 Inclusions and exclusions checklist
- Inclusions checklist
- Exclusions checklist
- 16.3 Currency conversion rates for US$
- Currency conversion rates for US$
- 16.4 Research methodology
- Research methodology
- 16.5 Data procurement
- Information sources
- 16.6 Data validation
- Data validation
- 16.7 Validation techniques employed for market sizing
- Validation techniques employed for market sizing
- 16.8 Data synthesis
- Data synthesis
- 16.9 360 degree market analysis
- 360 degree market analysis
- 16.10 List of abbreviations
- List of abbreviations

