|
|
市場調査レポート
商品コード
1685598
抗肥満薬の世界市場 2025~2029年Global Anti-obesity Drugs Market 2025-2029 |
||||||

|
|||||||
カスタマイズ可能
|
|||||||

| 抗肥満薬の世界市場 2025~2029年 |
|
出版日: 2025年03月13日
発行: TechNavio
ページ情報: 英文 228 Pages
納期: 即納可能
|

全表示
- 概要
- 図表
- 目次
抗肥満薬市場は、2024年から2029年にかけて229億530万米ドル、予測期間中のCAGRは15.7%で成長すると予測されています。
当レポートでは、抗肥満薬市場の全体的な分析、市場規模・予測、動向、成長促進要因、課題、約25のベンダーを網羅したベンダー分析などを掲載しています。
現在の市場シナリオ、最新動向と促進要因、市場環境全体に関する最新分析を提供しています。市場は、肥満人口の増加、病的肥満に対する限定的な肥満手術の使用、承認された薬剤の限られた数によって牽引されています。
| 市場範囲 | |
|---|---|
| 基準年 | 2025 |
| 終了年 | 2029 |
| 予測期間 | 2025-2029 |
| 成長モメンタム | 加速 |
| 前年比2025年 | 13.2% |
| CAGR | 15.7% |
| 増分額 | 229億530万米ドル |
本調査は、業界の主要参加者からのインプットを含め、一次情報と二次情報を客観的に組み合わせて実施しました。レポートには、主要企業の分析に加え、包括的な市場規模データ、地域分析によるセグメント、ベンダー情勢が含まれています。レポートにはヒストリカルデータと予測データがあります。
本調査では、今後数年間の抗肥満薬市場成長を牽引する主な要因の一つとして、肥満と2型糖尿病の両方をターゲットとする薬剤の調査を挙げています。また、体重管理に関する意識、小児肥満や病的肥満の発生率の増加は、市場の大きな需要につながります。
目次
第1章 エグゼクティブサマリー
- 市場概要
第2章 Technavio分析
- 価格・ライフサイクル・顧客購入バスケット・採用率・購入基準の分析
- インプットの重要性と差別化の要因
- 混乱の要因
- 促進要因と課題の影響
第3章 市場情勢
- 市場エコシステム
- 市場の特徴
- バリューチェーン分析
第4章 市場規模
- 市場の定義
- 市場セグメント分析
- 市場規模 2024
- 市場の見通し 2024-2029
第5章 市場規模実績
- 抗肥満薬の世界市場 2019-2023
- タイプ別セグメント分析 2019-2023
- 薬物クラス別セグメント分析 2019-2023
- 流通チャネル別セグメント分析 2019-2023
- 投与経路別セグメント分析 2019-2023
- 地域別セグメント分析 2019-2023
- 国別セグメント分析 2019-2023
第6章 定性分析
- AIの影響:抗肥満薬の世界市場
第7章 ファイブフォース分析
- ファイブフォースの要約
- 買い手の交渉力
- 供給企業の交渉力
- 新規参入業者の脅威
- 代替品の脅威
- 競争の脅威
- 市況
第8章 市場セグメンテーション:タイプ別
- 市場セグメント
- 比較:タイプ別
- クラスIII:市場規模と予測 2024-2029
- クラス II 抗肥満薬:市場規模と予測 2024-2029
- クラス I 抗肥満薬:市場規模と予測 2024-2029
- 市場機会:タイプ別
第9章 市場セグメンテーション:薬剤クラス別
- 市場セグメント
- 比較:薬剤クラス別
- 末梢作用薬:市場規模と予測 2024-2029
- 中枢作用薬:市場規模と予測 2024-2029
- 市場機会:薬剤クラス別
第10章 市場セグメンテーション:流通チャネル別
- 市場セグメント
- 比較:流通チャネル別
- 病院薬局:市場規模と予測 2024-2029
- 小売薬局:市場規模と予測 2024-2029
- ドラッグストア:市場規模と予測 2024-2029
- eコマース:市場規模と予測 2024-2029
- 市場機会:流通チャネル別
第11章 市場セグメンテーション:投与経路別
- 市場セグメント
- 比較:投与経路別
- 経口投与:市場規模と予測 2024-2029
- 皮下投与:市場規模と予測 2024-2029
- 市場機会:投与経路別
第12章 顧客情勢
- 顧客情勢の概要
第13章 地域別情勢
- 地域別セグメンテーション
- 地域別比較
- 北米:市場規模と予測 2024-2029
- 欧州:市場規模と予測 2024-2029
- アジア:市場規模と予測 2024-2029
- 世界のその他の地域:市場規模と予測 2024-2029
- 米国:市場規模と予測 2024-2029
- カナダ:市場規模と予測 2024-2029
- ドイツ:市場規模と予測 2024-2029
- 英国:市場規模と予測 2024-2029
- フランス:市場規模と予測 2024-2029
- 中国:市場規模と予測 2024-2029
- イタリア:市場規模と予測 2024-2029
- メキシコ:市場規模と予測 2024-2029
- ブラジル:市場規模と予測 2024-2029
- 日本:市場規模と予測 2024-2029
- 市場機会:地域情勢別
第14章 促進要因・課題・機会・抑制要因
- 市場促進要因
- 市場の課題
- 促進要因と課題の影響
- 市場の機会・抑制要因
第15章 競合情勢
- 概要
- 競合情勢
- 混乱の状況
- 業界のリスク
第16章 競合分析
- 企業プロファイル
- 企業ランキング指数
- 企業の市場ポジショニング
- Alvogen Inc
- AstraZeneca Plc
- Boehringer Ingelheim International GmbH
- Eli Lilly and Co.
- Empros Pharma AB
- ERX Pharmaceuticals Inc.
- Gelesis Inc.
- GlaxoSmithKline Plc
- Innovent Biologics Inc.
- LG Chem Ltd.
- Novo Nordisk AS
- Rhythm Pharmaceuticals Inc.
- SCOHIA PHARMA Inc.
- VIVUS LLC
- Zydus Lifesciences Ltd.
第17章 付録
Exhibits:
- Exhibits1: Executive Summary - Chart on Market Overview
- Exhibits2: Executive Summary - Data Table on Market Overview
- Exhibits3: Executive Summary - Chart on Global Market Characteristics
- Exhibits4: Executive Summary - Chart on Market By Geographical Landscape
- Exhibits5: Executive Summary - Chart on Market Segmentation by Type
- Exhibits6: Executive Summary - Chart on Market Segmentation by Drug Class
- Exhibits7: Executive Summary - Chart on Market Segmentation by Distribution Channel
- Exhibits8: Executive Summary - Chart on Market Segmentation by Route of Administration
- Exhibits9: Executive Summary - Chart on Incremental Growth
- Exhibits10: Executive Summary - Data Table on Incremental Growth
- Exhibits11: Executive Summary - Chart on Company Market Positioning
- Exhibits12: Analysis of price sensitivity, lifecycle, customer purchase basket, adoption rates, and purchase criteria
- Exhibits13: Overview on criticality of inputs and factors of differentiation
- Exhibits14: Overview on factors of disruption
- Exhibits15: Impact of drivers and challenges in 2024 and 2029
- Exhibits16: Parent Market
- Exhibits17: Data Table on - Parent Market
- Exhibits18: Market characteristics analysis
- Exhibits19: Value chain analysis
- Exhibits20: Offerings of companies included in the market definition
- Exhibits21: Market segments
- Exhibits22: Chart on Global - Market size and forecast 2024-2029 ($ million)
- Exhibits23: Data Table on Global - Market size and forecast 2024-2029 ($ million)
- Exhibits24: Chart on Global Market: Year-over-year growth 2024-2029 (%)
- Exhibits25: Data Table on Global Market: Year-over-year growth 2024-2029 (%)
- Exhibits26: Historic Market Size - Data Table on Global Anti-Obesity Drugs Market 2019 - 2023 ($ million)
- Exhibits27: Historic Market Size - Type Segment 2019 - 2023 ($ million)
- Exhibits28: Historic Market Size - Drug Class Segment 2019 - 2023 ($ million)
- Exhibits29: Historic Market Size - Distribution Channel Segment 2019 - 2023 ($ million)
- Exhibits30: Historic Market Size - Route of Administration Segment 2019 - 2023 ($ million)
- Exhibits31: Historic Market Size - Geography Segment 2019 - 2023 ($ million)
- Exhibits32: Historic Market Size - Country Segment 2019 - 2023 ($ million)
- Exhibits33: Five forces analysis - Comparison between 2024 and 2029
- Exhibits34: Bargaining power of buyers - Impact of key factors 2024 and 2029
- Exhibits35: Bargaining power of suppliers - Impact of key factors in 2024 and 2029
- Exhibits36: Threat of new entrants - Impact of key factors in 2024 and 2029
- Exhibits37: Threat of substitutes - Impact of key factors in 2024 and 2029
- Exhibits38: Threat of rivalry - Impact of key factors in 2024 and 2029
- Exhibits39: Chart on Market condition - Five forces 2024 and 2029
- Exhibits40: Chart on Type - Market share 2024-2029 (%)
- Exhibits41: Data Table on Type - Market share 2024-2029 (%)
- Exhibits42: Chart on Comparison by Type
- Exhibits43: Data Table on Comparison by Type
- Exhibits44: Chart on Class III - Market size and forecast 2024-2029 ($ million)
- Exhibits45: Data Table on Class III - Market size and forecast 2024-2029 ($ million)
- Exhibits46: Chart on Class III - Year-over-year growth 2024-2029 (%)
- Exhibits47: Data Table on Class III - Year-over-year growth 2024-2029 (%)
- Exhibits48: Chart on Class II anti-obesity drugs - Market size and forecast 2024-2029 ($ million)
- Exhibits49: Data Table on Class II anti-obesity drugs - Market size and forecast 2024-2029 ($ million)
- Exhibits50: Chart on Class II anti-obesity drugs - Year-over-year growth 2024-2029 (%)
- Exhibits51: Data Table on Class II anti-obesity drugs - Year-over-year growth 2024-2029 (%)
- Exhibits52: Chart on Class I anti-obesity drugs - Market size and forecast 2024-2029 ($ million)
- Exhibits53: Data Table on Class I anti-obesity drugs - Market size and forecast 2024-2029 ($ million)
- Exhibits54: Chart on Class I anti-obesity drugs - Year-over-year growth 2024-2029 (%)
- Exhibits55: Data Table on Class I anti-obesity drugs - Year-over-year growth 2024-2029 (%)
- Exhibits56: Market opportunity by Type ($ million)
- Exhibits57: Data Table on Market opportunity by Type ($ million)
- Exhibits58: Chart on Drug Class - Market share 2024-2029 (%)
- Exhibits59: Data Table on Drug Class - Market share 2024-2029 (%)
- Exhibits60: Chart on Comparison by Drug Class
- Exhibits61: Data Table on Comparison by Drug Class
- Exhibits62: Chart on Peripherally acting drugs - Market size and forecast 2024-2029 ($ million)
- Exhibits63: Data Table on Peripherally acting drugs - Market size and forecast 2024-2029 ($ million)
- Exhibits64: Chart on Peripherally acting drugs - Year-over-year growth 2024-2029 (%)
- Exhibits65: Data Table on Peripherally acting drugs - Year-over-year growth 2024-2029 (%)
- Exhibits66: Chart on Centrally acting drugs - Market size and forecast 2024-2029 ($ million)
- Exhibits67: Data Table on Centrally acting drugs - Market size and forecast 2024-2029 ($ million)
- Exhibits68: Chart on Centrally acting drugs - Year-over-year growth 2024-2029 (%)
- Exhibits69: Data Table on Centrally acting drugs - Year-over-year growth 2024-2029 (%)
- Exhibits70: Market opportunity by Drug Class ($ million)
- Exhibits71: Data Table on Market opportunity by Drug Class ($ million)
- Exhibits72: Chart on Distribution Channel - Market share 2024-2029 (%)
- Exhibits73: Data Table on Distribution Channel - Market share 2024-2029 (%)
- Exhibits74: Chart on Comparison by Distribution Channel
- Exhibits75: Data Table on Comparison by Distribution Channel
- Exhibits76: Chart on Hospital pharmacies - Market size and forecast 2024-2029 ($ million)
- Exhibits77: Data Table on Hospital pharmacies - Market size and forecast 2024-2029 ($ million)
- Exhibits78: Chart on Hospital pharmacies - Year-over-year growth 2024-2029 (%)
- Exhibits79: Data Table on Hospital pharmacies - Year-over-year growth 2024-2029 (%)
- Exhibits80: Chart on Retail pharmacies - Market size and forecast 2024-2029 ($ million)
- Exhibits81: Data Table on Retail pharmacies - Market size and forecast 2024-2029 ($ million)
- Exhibits82: Chart on Retail pharmacies - Year-over-year growth 2024-2029 (%)
- Exhibits83: Data Table on Retail pharmacies - Year-over-year growth 2024-2029 (%)
- Exhibits84: Chart on Drug stores - Market size and forecast 2024-2029 ($ million)
- Exhibits85: Data Table on Drug stores - Market size and forecast 2024-2029 ($ million)
- Exhibits86: Chart on Drug stores - Year-over-year growth 2024-2029 (%)
- Exhibits87: Data Table on Drug stores - Year-over-year growth 2024-2029 (%)
- Exhibits88: Chart on E-commerce - Market size and forecast 2024-2029 ($ million)
- Exhibits89: Data Table on E-commerce - Market size and forecast 2024-2029 ($ million)
- Exhibits90: Chart on E-commerce - Year-over-year growth 2024-2029 (%)
- Exhibits91: Data Table on E-commerce - Year-over-year growth 2024-2029 (%)
- Exhibits92: Market opportunity by Distribution Channel ($ million)
- Exhibits93: Data Table on Market opportunity by Distribution Channel ($ million)
- Exhibits94: Chart on Route of Administration - Market share 2024-2029 (%)
- Exhibits95: Data Table on Route of Administration - Market share 2024-2029 (%)
- Exhibits96: Chart on Comparison by Route of Administration
- Exhibits97: Data Table on Comparison by Route of Administration
- Exhibits98: Chart on Oral route - Market size and forecast 2024-2029 ($ million)
- Exhibits99: Data Table on Oral route - Market size and forecast 2024-2029 ($ million)
- Exhibits100: Chart on Oral route - Year-over-year growth 2024-2029 (%)
- Exhibits101: Data Table on Oral route - Year-over-year growth 2024-2029 (%)
- Exhibits102: Chart on Subcutaneous route - Market size and forecast 2024-2029 ($ million)
- Exhibits103: Data Table on Subcutaneous route - Market size and forecast 2024-2029 ($ million)
- Exhibits104: Chart on Subcutaneous route - Year-over-year growth 2024-2029 (%)
- Exhibits105: Data Table on Subcutaneous route - Year-over-year growth 2024-2029 (%)
- Exhibits106: Market opportunity by Route of Administration ($ million)
- Exhibits107: Data Table on Market opportunity by Route of Administration ($ million)
- Exhibits108: Analysis of price sensitivity, lifecycle, customer purchase basket, adoption rates, and purchase criteria
- Exhibits109: Chart on Market share By Geographical Landscape 2024-2029 (%)
- Exhibits110: Data Table on Market share By Geographical Landscape 2024-2029 (%)
- Exhibits111: Chart on Geographic comparison
- Exhibits112: Data Table on Geographic comparison
- Exhibits113: Chart on North America - Market size and forecast 2024-2029 ($ million)
- Exhibits114: Data Table on North America - Market size and forecast 2024-2029 ($ million)
- Exhibits115: Chart on North America - Year-over-year growth 2024-2029 (%)
- Exhibits116: Data Table on North America - Year-over-year growth 2024-2029 (%)
- Exhibits117: Chart on Europe - Market size and forecast 2024-2029 ($ million)
- Exhibits118: Data Table on Europe - Market size and forecast 2024-2029 ($ million)
- Exhibits119: Chart on Europe - Year-over-year growth 2024-2029 (%)
- Exhibits120: Data Table on Europe - Year-over-year growth 2024-2029 (%)
- Exhibits121: Chart on Asia - Market size and forecast 2024-2029 ($ million)
- Exhibits122: Data Table on Asia - Market size and forecast 2024-2029 ($ million)
- Exhibits123: Chart on Asia - Year-over-year growth 2024-2029 (%)
- Exhibits124: Data Table on Asia - Year-over-year growth 2024-2029 (%)
- Exhibits125: Chart on Rest of World (ROW) - Market size and forecast 2024-2029 ($ million)
- Exhibits126: Data Table on Rest of World (ROW) - Market size and forecast 2024-2029 ($ million)
- Exhibits127: Chart on Rest of World (ROW) - Year-over-year growth 2024-2029 (%)
- Exhibits128: Data Table on Rest of World (ROW) - Year-over-year growth 2024-2029 (%)
- Exhibits129: Chart on US - Market size and forecast 2024-2029 ($ million)
- Exhibits130: Data Table on US - Market size and forecast 2024-2029 ($ million)
- Exhibits131: Chart on US - Year-over-year growth 2024-2029 (%)
- Exhibits132: Data Table on US - Year-over-year growth 2024-2029 (%)
- Exhibits133: Chart on Canada - Market size and forecast 2024-2029 ($ million)
- Exhibits134: Data Table on Canada - Market size and forecast 2024-2029 ($ million)
- Exhibits135: Chart on Canada - Year-over-year growth 2024-2029 (%)
- Exhibits136: Data Table on Canada - Year-over-year growth 2024-2029 (%)
- Exhibits137: Chart on Germany - Market size and forecast 2024-2029 ($ million)
- Exhibits138: Data Table on Germany - Market size and forecast 2024-2029 ($ million)
- Exhibits139: Chart on Germany - Year-over-year growth 2024-2029 (%)
- Exhibits140: Data Table on Germany - Year-over-year growth 2024-2029 (%)
- Exhibits141: Chart on UK - Market size and forecast 2024-2029 ($ million)
- Exhibits142: Data Table on UK - Market size and forecast 2024-2029 ($ million)
- Exhibits143: Chart on UK - Year-over-year growth 2024-2029 (%)
- Exhibits144: Data Table on UK - Year-over-year growth 2024-2029 (%)
- Exhibits145: Chart on France - Market size and forecast 2024-2029 ($ million)
- Exhibits146: Data Table on France - Market size and forecast 2024-2029 ($ million)
- Exhibits147: Chart on France - Year-over-year growth 2024-2029 (%)
- Exhibits148: Data Table on France - Year-over-year growth 2024-2029 (%)
- Exhibits149: Chart on China - Market size and forecast 2024-2029 ($ million)
- Exhibits150: Data Table on China - Market size and forecast 2024-2029 ($ million)
- Exhibits151: Chart on China - Year-over-year growth 2024-2029 (%)
- Exhibits152: Data Table on China - Year-over-year growth 2024-2029 (%)
- Exhibits153: Chart on Italy - Market size and forecast 2024-2029 ($ million)
- Exhibits154: Data Table on Italy - Market size and forecast 2024-2029 ($ million)
- Exhibits155: Chart on Italy - Year-over-year growth 2024-2029 (%)
- Exhibits156: Data Table on Italy - Year-over-year growth 2024-2029 (%)
- Exhibits157: Chart on Mexico - Market size and forecast 2024-2029 ($ million)
- Exhibits158: Data Table on Mexico - Market size and forecast 2024-2029 ($ million)
- Exhibits159: Chart on Mexico - Year-over-year growth 2024-2029 (%)
- Exhibits160: Data Table on Mexico - Year-over-year growth 2024-2029 (%)
- Exhibits161: Chart on Brazil - Market size and forecast 2024-2029 ($ million)
- Exhibits162: Data Table on Brazil - Market size and forecast 2024-2029 ($ million)
- Exhibits163: Chart on Brazil - Year-over-year growth 2024-2029 (%)
- Exhibits164: Data Table on Brazil - Year-over-year growth 2024-2029 (%)
- Exhibits165: Chart on Japan - Market size and forecast 2024-2029 ($ million)
- Exhibits166: Data Table on Japan - Market size and forecast 2024-2029 ($ million)
- Exhibits167: Chart on Japan - Year-over-year growth 2024-2029 (%)
- Exhibits168: Data Table on Japan - Year-over-year growth 2024-2029 (%)
- Exhibits169: Market opportunity By Geographical Landscape ($ million)
- Exhibits170: Data Tables on Market opportunity By Geographical Landscape ($ million)
- Exhibits171: Impact of drivers and challenges in 2024 and 2029
- Exhibits172: Overview on criticality of inputs and factors of differentiation
- Exhibits173: Overview on factors of disruption
- Exhibits174: Impact of key risks on business
- Exhibits175: Companies covered
- Exhibits176: Company ranking index
- Exhibits177: Matrix on companies position and classification
- Exhibits178: Alvogen Inc - Overview
- Exhibits179: Alvogen Inc - Product / Service
- Exhibits180: Alvogen Inc - Key offerings
- Exhibits181: SWOT
- Exhibits182: AstraZeneca Plc - Overview
- Exhibits183: AstraZeneca Plc - Product / Service
- Exhibits184: AstraZeneca Plc - Key news
- Exhibits185: AstraZeneca Plc - Key offerings
- Exhibits186: SWOT
- Exhibits187: Boehringer Ingelheim International GmbH - Overview
- Exhibits188: Boehringer Ingelheim International GmbH - Product / Service
- Exhibits189: Boehringer Ingelheim International GmbH - Key news
- Exhibits190: Boehringer Ingelheim International GmbH - Key offerings
- Exhibits191: SWOT
- Exhibits192: Eli Lilly and Co. - Overview
- Exhibits193: Eli Lilly and Co. - Product / Service
- Exhibits194: Eli Lilly and Co. - Key offerings
- Exhibits195: SWOT
- Exhibits196: Empros Pharma AB - Overview
- Exhibits197: Empros Pharma AB - Product / Service
- Exhibits198: Empros Pharma AB - Key offerings
- Exhibits199: SWOT
- Exhibits200: ERX Pharmaceuticals Inc. - Overview
- Exhibits201: ERX Pharmaceuticals Inc. - Product / Service
- Exhibits202: ERX Pharmaceuticals Inc. - Key offerings
- Exhibits203: SWOT
- Exhibits204: Gelesis Inc. - Overview
- Exhibits205: Gelesis Inc. - Product / Service
- Exhibits206: Gelesis Inc. - Key offerings
- Exhibits207: SWOT
- Exhibits208: GlaxoSmithKline Plc - Overview
- Exhibits209: GlaxoSmithKline Plc - Business segments
- Exhibits210: GlaxoSmithKline Plc - Key news
- Exhibits211: GlaxoSmithKline Plc - Key offerings
- Exhibits212: GlaxoSmithKline Plc - Segment focus
- Exhibits213: SWOT
- Exhibits214: Innovent Biologics Inc. - Overview
- Exhibits215: Innovent Biologics Inc. - Product / Service
- Exhibits216: Innovent Biologics Inc. - Key offerings
- Exhibits217: SWOT
- Exhibits218: LG Chem Ltd. - Overview
- Exhibits219: LG Chem Ltd. - Business segments
- Exhibits220: LG Chem Ltd. - Key news
- Exhibits221: LG Chem Ltd. - Key offerings
- Exhibits222: LG Chem Ltd. - Segment focus
- Exhibits223: SWOT
- Exhibits224: Novo Nordisk AS - Overview
- Exhibits225: Novo Nordisk AS - Business segments
- Exhibits226: Novo Nordisk AS - Key offerings
- Exhibits227: Novo Nordisk AS - Segment focus
- Exhibits228: SWOT
- Exhibits229: Rhythm Pharmaceuticals Inc. - Overview
- Exhibits230: Rhythm Pharmaceuticals Inc. - Product / Service
- Exhibits231: Rhythm Pharmaceuticals Inc. - Key news
- Exhibits232: Rhythm Pharmaceuticals Inc. - Key offerings
- Exhibits233: SWOT
- Exhibits234: SCOHIA PHARMA Inc. - Overview
- Exhibits235: SCOHIA PHARMA Inc. - Product / Service
- Exhibits236: SCOHIA PHARMA Inc. - Key news
- Exhibits237: SCOHIA PHARMA Inc. - Key offerings
- Exhibits238: SWOT
- Exhibits239: VIVUS LLC - Overview
- Exhibits240: VIVUS LLC - Product / Service
- Exhibits241: VIVUS LLC - Key offerings
- Exhibits242: SWOT
- Exhibits243: Zydus Lifesciences Ltd. - Overview
- Exhibits244: Zydus Lifesciences Ltd. - Business segments
- Exhibits245: Zydus Lifesciences Ltd. - Key news
- Exhibits246: Zydus Lifesciences Ltd. - Key offerings
- Exhibits247: Zydus Lifesciences Ltd. - Segment focus
- Exhibits248: SWOT
- Exhibits249: Inclusions checklist
- Exhibits250: Exclusions checklist
- Exhibits251: Currency conversion rates for US$
- Exhibits252: Research methodology
- Exhibits253: Information sources
- Exhibits254: Data validation
- Exhibits255: Validation techniques employed for market sizing
- Exhibits256: Data synthesis
- Exhibits257: 360 degree market analysis
- Exhibits258: List of abbreviations
The anti-obesity drugs market is forecasted to grow by USD 22905.3 million during 2024-2029, accelerating at a CAGR of 15.7% during the forecast period. The report on the anti-obesity drugs market provides a holistic analysis, market size and forecast, trends, growth drivers, and challenges, as well as vendor analysis covering around 25 vendors.
The report offers an up-to-date analysis regarding the current market scenario, the latest trends and drivers, and the overall market environment. The market is driven by growing obese population, use of bariatric surgery limited for morbid obesity, and limited number of approved drugs.
| Market Scope | |
|---|---|
| Base Year | 2025 |
| End Year | 2029 |
| Series Year | 2025-2029 |
| Growth Momentum | Accelerate |
| YOY 2025 | 13.2% |
| CAGR | 15.7% |
| Incremental Value | $22905.3 mn |
The study was conducted using an objective combination of primary and secondary information including inputs from key participants in the industry. The report contains a comprehensive market size data, segment with regional analysis and vendor landscape in addition to an analysis of the key companies. Reports have historic and forecast data.
Technavio's anti-obesity drugs market is segmented as below:
By Type
- Class III
- Class II anti-obesity drugs
- Class I anti-obesity drugs
By Drug Class
- Peripherally acting drugs
- Centrally acting drugs
By Distribution Channel
- Hospital pharmacies
- Retail pharmacies
- Drug stores
- E-commerce
By Route Of Administration
- Oral route
- Subcutaneous route
By Geographical Landscape
- North America
- Europe
- Asia
- Rest of World (ROW)
This study identifies the research on drugs that target both obesity and type 2 diabetes mellitus as one of the prime reasons driving the anti-obesity drugs market growth during the next few years. Also, awareness about weight management and increase in childhood obesity and morbid obesity incidence will lead to sizable demand in the market.
The report on the anti-obesity drugs market covers the following areas:
- Anti-Obesity Drugs Market sizing
- Anti-Obesity Drugs Market forecast
- Anti-Obesity Drugs Market industry analysis
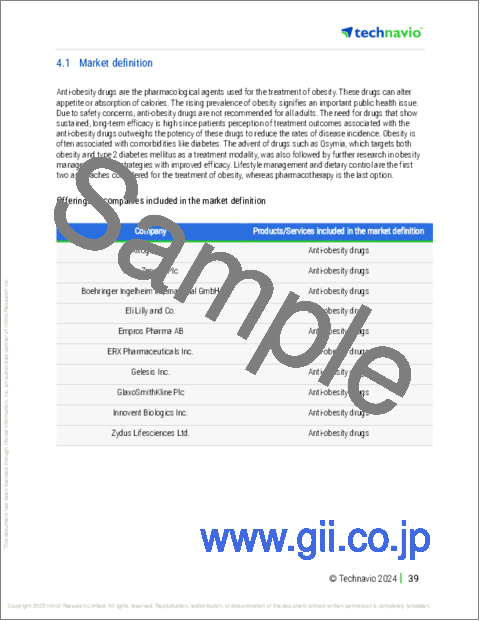
The robust vendor analysis is designed to help clients improve their market position, and in line with this, this report provides a detailed analysis of several leading anti-obesity drugs market vendors that include Alvogen Inc, Amgen Inc., AstraZeneca PLC, Boehringer Ingelheim International GmbH, Eli Lilly and Co., Empros Pharma AB, ERX Pharmaceuticals Inc., Gelesis Inc., GlaxoSmithKline PLC, Innovent Biologics Inc., LG Chem Ltd., Novo Nordisk AS, Rhythm Pharmaceuticals Inc., SCOHIA PHARMA Inc., VIVUS LLC, and Zydus Lifesciences Ltd.. Also, the anti-obesity drugs market analysis report includes information on upcoming trends and challenges that will influence market growth. This is to help companies strategize and leverage all forthcoming growth opportunities.
The publisher presents a detailed picture of the market by the way of study, synthesis, and summation of data from multiple sources by an analysis of key parameters such as profit, pricing, competition, and promotions. It presents various market facets by identifying the key industry influencers. The data presented is comprehensive, reliable, and a result of extensive primary and secondary research. The market research reports provide a complete competitive landscape and an in-depth vendor selection methodology and analysis using qualitative and quantitative research to forecast accurate market growth.
Table of Contents
1 Executive Summary
- 1.1 Market overview
- Executive Summary - Chart on Market Overview
- Executive Summary - Data Table on Market Overview
- Executive Summary - Chart on Global Market Characteristics
- Executive Summary - Chart on Market By Geographical Landscape
- Executive Summary - Chart on Market Segmentation by Type
- Executive Summary - Chart on Market Segmentation by Drug Class
- Executive Summary - Chart on Market Segmentation by Distribution Channel
- Executive Summary - Chart on Market Segmentation by Route of Administration
- Executive Summary - Chart on Incremental Growth
- Executive Summary - Data Table on Incremental Growth
- Executive Summary - Chart on Company Market Positioning
2 Technavio Analysis
- 2.1 Analysis of price sensitivity, lifecycle, customer purchase basket, adoption rates, and purchase criteria
- Analysis of price sensitivity, lifecycle, customer purchase basket, adoption rates, and purchase criteria
- 2.2 Criticality of inputs and Factors of differentiation
- Overview on criticality of inputs and factors of differentiation
- 2.3 Factors of disruption
- Overview on factors of disruption
- 2.4 Impact of drivers and challenges
- Impact of drivers and challenges in 2024 and 2029
3 Market Landscape
- 3.1 Market ecosystem
- Parent Market
- Data Table on - Parent Market
- 3.2 Market characteristics
- Market characteristics analysis
- 3.3 Value chain analysis
- Value chain analysis
4 Market Sizing
- 4.1 Market definition
- Offerings of companies included in the market definition
- 4.2 Market segment analysis
- Market segments
- 4.3 Market size 2024
- 4.4 Market outlook: Forecast for 2024-2029
- Chart on Global - Market size and forecast 2024-2029 ($ million)
- Data Table on Global - Market size and forecast 2024-2029 ($ million)
- Chart on Global Market: Year-over-year growth 2024-2029 (%)
- Data Table on Global Market: Year-over-year growth 2024-2029 (%)
5 Historic Market Size
- 5.1 Global Anti-Obesity Drugs Market 2019 - 2023
- Historic Market Size - Data Table on Global Anti-Obesity Drugs Market 2019 - 2023 ($ million)
- 5.2 Type segment analysis 2019 - 2023
- Historic Market Size - Type Segment 2019 - 2023 ($ million)
- 5.3 Drug Class segment analysis 2019 - 2023
- Historic Market Size - Drug Class Segment 2019 - 2023 ($ million)
- 5.4 Distribution Channel segment analysis 2019 - 2023
- Historic Market Size - Distribution Channel Segment 2019 - 2023 ($ million)
- 5.5 Route of Administration segment analysis 2019 - 2023
- Historic Market Size - Route of Administration Segment 2019 - 2023 ($ million)
- 5.6 Geography segment analysis 2019 - 2023
- Historic Market Size - Geography Segment 2019 - 2023 ($ million)
- 5.7 Country segment analysis 2019 - 2023
- Historic Market Size - Country Segment 2019 - 2023 ($ million)
6 Qualitative Analysis
- 6.1 Impact of AI on Global Anti-obesity Drugs Market
7 Five Forces Analysis
- 7.1 Five forces summary
- Five forces analysis - Comparison between 2024 and 2029
- 7.2 Bargaining power of buyers
- Bargaining power of buyers - Impact of key factors 2024 and 2029
- 7.3 Bargaining power of suppliers
- Bargaining power of suppliers - Impact of key factors in 2024 and 2029
- 7.4 Threat of new entrants
- Threat of new entrants - Impact of key factors in 2024 and 2029
- 7.5 Threat of substitutes
- Threat of substitutes - Impact of key factors in 2024 and 2029
- 7.6 Threat of rivalry
- Threat of rivalry - Impact of key factors in 2024 and 2029
- 7.7 Market condition
- Chart on Market condition - Five forces 2024 and 2029
8 Market Segmentation by Type
- 8.1 Market segments
- Chart on Type - Market share 2024-2029 (%)
- Data Table on Type - Market share 2024-2029 (%)
- 8.2 Comparison by Type
- Chart on Comparison by Type
- Data Table on Comparison by Type
- 8.3 Class III - Market size and forecast 2024-2029
- Chart on Class III - Market size and forecast 2024-2029 ($ million)
- Data Table on Class III - Market size and forecast 2024-2029 ($ million)
- Chart on Class III - Year-over-year growth 2024-2029 (%)
- Data Table on Class III - Year-over-year growth 2024-2029 (%)
- 8.4 Class II anti-obesity drugs - Market size and forecast 2024-2029
- Chart on Class II anti-obesity drugs - Market size and forecast 2024-2029 ($ million)
- Data Table on Class II anti-obesity drugs - Market size and forecast 2024-2029 ($ million)
- Chart on Class II anti-obesity drugs - Year-over-year growth 2024-2029 (%)
- Data Table on Class II anti-obesity drugs - Year-over-year growth 2024-2029 (%)
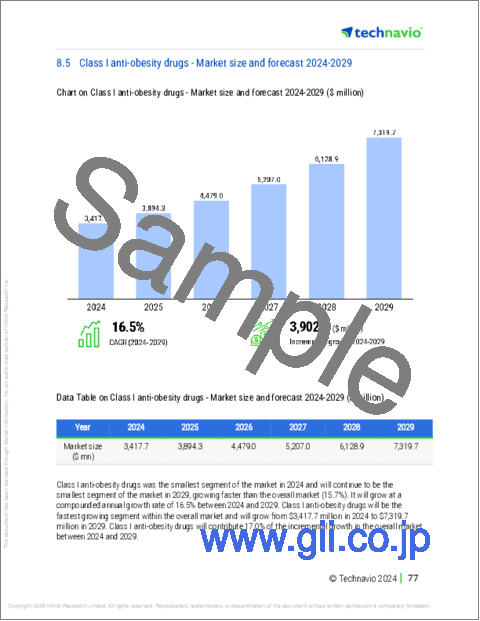
- 8.5 Class I anti-obesity drugs - Market size and forecast 2024-2029
- Chart on Class I anti-obesity drugs - Market size and forecast 2024-2029 ($ million)
- Data Table on Class I anti-obesity drugs - Market size and forecast 2024-2029 ($ million)
- Chart on Class I anti-obesity drugs - Year-over-year growth 2024-2029 (%)
- Data Table on Class I anti-obesity drugs - Year-over-year growth 2024-2029 (%)
- 8.6 Market opportunity by Type
- Market opportunity by Type ($ million)
- Data Table on Market opportunity by Type ($ million)
9 Market Segmentation by Drug Class
- 9.1 Market segments
- Chart on Drug Class - Market share 2024-2029 (%)
- Data Table on Drug Class - Market share 2024-2029 (%)
- 9.2 Comparison by Drug Class
- Chart on Comparison by Drug Class
- Data Table on Comparison by Drug Class
- 9.3 Peripherally acting drugs - Market size and forecast 2024-2029
- Chart on Peripherally acting drugs - Market size and forecast 2024-2029 ($ million)
- Data Table on Peripherally acting drugs - Market size and forecast 2024-2029 ($ million)
- Chart on Peripherally acting drugs - Year-over-year growth 2024-2029 (%)
- Data Table on Peripherally acting drugs - Year-over-year growth 2024-2029 (%)
- 9.4 Centrally acting drugs - Market size and forecast 2024-2029
- Chart on Centrally acting drugs - Market size and forecast 2024-2029 ($ million)
- Data Table on Centrally acting drugs - Market size and forecast 2024-2029 ($ million)
- Chart on Centrally acting drugs - Year-over-year growth 2024-2029 (%)
- Data Table on Centrally acting drugs - Year-over-year growth 2024-2029 (%)
- 9.5 Market opportunity by Drug Class
- Market opportunity by Drug Class ($ million)
- Data Table on Market opportunity by Drug Class ($ million)
10 Market Segmentation by Distribution Channel
- 10.1 Market segments
- Chart on Distribution Channel - Market share 2024-2029 (%)
- Data Table on Distribution Channel - Market share 2024-2029 (%)
- 10.2 Comparison by Distribution Channel
- Chart on Comparison by Distribution Channel
- Data Table on Comparison by Distribution Channel
- 10.3 Hospital pharmacies - Market size and forecast 2024-2029
- Chart on Hospital pharmacies - Market size and forecast 2024-2029 ($ million)
- Data Table on Hospital pharmacies - Market size and forecast 2024-2029 ($ million)
- Chart on Hospital pharmacies - Year-over-year growth 2024-2029 (%)
- Data Table on Hospital pharmacies - Year-over-year growth 2024-2029 (%)
- 10.4 Retail pharmacies - Market size and forecast 2024-2029
- Chart on Retail pharmacies - Market size and forecast 2024-2029 ($ million)
- Data Table on Retail pharmacies - Market size and forecast 2024-2029 ($ million)
- Chart on Retail pharmacies - Year-over-year growth 2024-2029 (%)
- Data Table on Retail pharmacies - Year-over-year growth 2024-2029 (%)
- 10.5 Drug stores - Market size and forecast 2024-2029
- Chart on Drug stores - Market size and forecast 2024-2029 ($ million)
- Data Table on Drug stores - Market size and forecast 2024-2029 ($ million)
- Chart on Drug stores - Year-over-year growth 2024-2029 (%)
- Data Table on Drug stores - Year-over-year growth 2024-2029 (%)
- 10.6 E-commerce - Market size and forecast 2024-2029
- Chart on E-commerce - Market size and forecast 2024-2029 ($ million)
- Data Table on E-commerce - Market size and forecast 2024-2029 ($ million)
- Chart on E-commerce - Year-over-year growth 2024-2029 (%)
- Data Table on E-commerce - Year-over-year growth 2024-2029 (%)
- 10.7 Market opportunity by Distribution Channel
- Market opportunity by Distribution Channel ($ million)
- Data Table on Market opportunity by Distribution Channel ($ million)
11 Market Segmentation by Route of Administration
- 11.1 Market segments
- Chart on Route of Administration - Market share 2024-2029 (%)
- Data Table on Route of Administration - Market share 2024-2029 (%)
- 11.2 Comparison by Route of Administration
- Chart on Comparison by Route of Administration
- Data Table on Comparison by Route of Administration
- 11.3 Oral route - Market size and forecast 2024-2029
- Chart on Oral route - Market size and forecast 2024-2029 ($ million)
- Data Table on Oral route - Market size and forecast 2024-2029 ($ million)
- Chart on Oral route - Year-over-year growth 2024-2029 (%)
- Data Table on Oral route - Year-over-year growth 2024-2029 (%)
- 11.4 Subcutaneous route - Market size and forecast 2024-2029
- Chart on Subcutaneous route - Market size and forecast 2024-2029 ($ million)
- Data Table on Subcutaneous route - Market size and forecast 2024-2029 ($ million)
- Chart on Subcutaneous route - Year-over-year growth 2024-2029 (%)
- Data Table on Subcutaneous route - Year-over-year growth 2024-2029 (%)
- 11.5 Market opportunity by Route of Administration
- Market opportunity by Route of Administration ($ million)
- Data Table on Market opportunity by Route of Administration ($ million)
12 Customer Landscape
- 12.1 Customer landscape overview
- Analysis of price sensitivity, lifecycle, customer purchase basket, adoption rates, and purchase criteria
13 Geographic Landscape
- 13.1 Geographic segmentation
- Chart on Market share By Geographical Landscape 2024-2029 (%)
- Data Table on Market share By Geographical Landscape 2024-2029 (%)
- 13.2 Geographic comparison
- Chart on Geographic comparison
- Data Table on Geographic comparison
- 13.3 North America - Market size and forecast 2024-2029
- Chart on North America - Market size and forecast 2024-2029 ($ million)
- Data Table on North America - Market size and forecast 2024-2029 ($ million)
- Chart on North America - Year-over-year growth 2024-2029 (%)
- Data Table on North America - Year-over-year growth 2024-2029 (%)
- 13.4 Europe - Market size and forecast 2024-2029
- Chart on Europe - Market size and forecast 2024-2029 ($ million)
- Data Table on Europe - Market size and forecast 2024-2029 ($ million)
- Chart on Europe - Year-over-year growth 2024-2029 (%)
- Data Table on Europe - Year-over-year growth 2024-2029 (%)
- 13.5 Asia - Market size and forecast 2024-2029
- Chart on Asia - Market size and forecast 2024-2029 ($ million)
- Data Table on Asia - Market size and forecast 2024-2029 ($ million)
- Chart on Asia - Year-over-year growth 2024-2029 (%)
- Data Table on Asia - Year-over-year growth 2024-2029 (%)
- 13.6 Rest of World (ROW) - Market size and forecast 2024-2029
- Chart on Rest of World (ROW) - Market size and forecast 2024-2029 ($ million)
- Data Table on Rest of World (ROW) - Market size and forecast 2024-2029 ($ million)
- Chart on Rest of World (ROW) - Year-over-year growth 2024-2029 (%)
- Data Table on Rest of World (ROW) - Year-over-year growth 2024-2029 (%)
- 13.7 US - Market size and forecast 2024-2029
- Chart on US - Market size and forecast 2024-2029 ($ million)
- Data Table on US - Market size and forecast 2024-2029 ($ million)
- Chart on US - Year-over-year growth 2024-2029 (%)
- Data Table on US - Year-over-year growth 2024-2029 (%)
- 13.8 Canada - Market size and forecast 2024-2029
- Chart on Canada - Market size and forecast 2024-2029 ($ million)
- Data Table on Canada - Market size and forecast 2024-2029 ($ million)
- Chart on Canada - Year-over-year growth 2024-2029 (%)
- Data Table on Canada - Year-over-year growth 2024-2029 (%)
- 13.9 Germany - Market size and forecast 2024-2029
- Chart on Germany - Market size and forecast 2024-2029 ($ million)
- Data Table on Germany - Market size and forecast 2024-2029 ($ million)
- Chart on Germany - Year-over-year growth 2024-2029 (%)
- Data Table on Germany - Year-over-year growth 2024-2029 (%)
- 13.10 UK - Market size and forecast 2024-2029
- Chart on UK - Market size and forecast 2024-2029 ($ million)
- Data Table on UK - Market size and forecast 2024-2029 ($ million)
- Chart on UK - Year-over-year growth 2024-2029 (%)
- Data Table on UK - Year-over-year growth 2024-2029 (%)
- 13.11 France - Market size and forecast 2024-2029
- Chart on France - Market size and forecast 2024-2029 ($ million)
- Data Table on France - Market size and forecast 2024-2029 ($ million)
- Chart on France - Year-over-year growth 2024-2029 (%)
- Data Table on France - Year-over-year growth 2024-2029 (%)
- 13.12 China - Market size and forecast 2024-2029
- Chart on China - Market size and forecast 2024-2029 ($ million)
- Data Table on China - Market size and forecast 2024-2029 ($ million)
- Chart on China - Year-over-year growth 2024-2029 (%)
- Data Table on China - Year-over-year growth 2024-2029 (%)
- 13.13 Italy - Market size and forecast 2024-2029
- Chart on Italy - Market size and forecast 2024-2029 ($ million)
- Data Table on Italy - Market size and forecast 2024-2029 ($ million)
- Chart on Italy - Year-over-year growth 2024-2029 (%)
- Data Table on Italy - Year-over-year growth 2024-2029 (%)
- 13.14 Mexico - Market size and forecast 2024-2029
- Chart on Mexico - Market size and forecast 2024-2029 ($ million)
- Data Table on Mexico - Market size and forecast 2024-2029 ($ million)
- Chart on Mexico - Year-over-year growth 2024-2029 (%)
- Data Table on Mexico - Year-over-year growth 2024-2029 (%)
- 13.15 Brazil - Market size and forecast 2024-2029
- Chart on Brazil - Market size and forecast 2024-2029 ($ million)
- Data Table on Brazil - Market size and forecast 2024-2029 ($ million)
- Chart on Brazil - Year-over-year growth 2024-2029 (%)
- Data Table on Brazil - Year-over-year growth 2024-2029 (%)
- 13.16 Japan - Market size and forecast 2024-2029
- Chart on Japan - Market size and forecast 2024-2029 ($ million)
- Data Table on Japan - Market size and forecast 2024-2029 ($ million)
- Chart on Japan - Year-over-year growth 2024-2029 (%)
- Data Table on Japan - Year-over-year growth 2024-2029 (%)
- 13.17 Market opportunity By Geographical Landscape
- Market opportunity By Geographical Landscape ($ million)
- Data Tables on Market opportunity By Geographical Landscape ($ million)
14 Drivers, Challenges, and Opportunity/Restraints
- 14.1 Market drivers
- 14.2 Market challenges
- 14.3 Impact of drivers and challenges
- Impact of drivers and challenges in 2024 and 2029
- 14.4 Market opportunities/restraints
15 Competitive Landscape
- 15.1 Overview
- 15.2 Competitive Landscape
- Overview on criticality of inputs and factors of differentiation
- 15.3 Landscape disruption
- Overview on factors of disruption
- 15.4 Industry risks
- Impact of key risks on business
16 Competitive Analysis
- 16.1 Companies profiled
- Companies covered
- 16.2 Company ranking index
- Company ranking index
- 16.3 Market positioning of companies
- Matrix on companies position and classification
- 16.4 Alvogen Inc
- Alvogen Inc - Overview
- Alvogen Inc - Product / Service
- Alvogen Inc - Key offerings
- SWOT
- 16.5 AstraZeneca Plc
- AstraZeneca Plc - Overview
- AstraZeneca Plc - Product / Service
- AstraZeneca Plc - Key news
- AstraZeneca Plc - Key offerings
- SWOT
- 16.6 Boehringer Ingelheim International GmbH
- Boehringer Ingelheim International GmbH - Overview
- Boehringer Ingelheim International GmbH - Product / Service
- Boehringer Ingelheim International GmbH - Key news
- Boehringer Ingelheim International GmbH - Key offerings
- SWOT
- 16.7 Eli Lilly and Co.
- Eli Lilly and Co. - Overview
- Eli Lilly and Co. - Product / Service
- Eli Lilly and Co. - Key offerings
- SWOT
- 16.8 Empros Pharma AB
- Empros Pharma AB - Overview
- Empros Pharma AB - Product / Service
- Empros Pharma AB - Key offerings
- SWOT
- 16.9 ERX Pharmaceuticals Inc.
- ERX Pharmaceuticals Inc. - Overview
- ERX Pharmaceuticals Inc. - Product / Service
- ERX Pharmaceuticals Inc. - Key offerings
- SWOT
- 16.10 Gelesis Inc.
- Gelesis Inc. - Overview
- Gelesis Inc. - Product / Service
- Gelesis Inc. - Key offerings
- SWOT
- 16.11 GlaxoSmithKline Plc
- GlaxoSmithKline Plc - Overview
- GlaxoSmithKline Plc - Business segments
- GlaxoSmithKline Plc - Key news
- GlaxoSmithKline Plc - Key offerings
- GlaxoSmithKline Plc - Segment focus
- SWOT
- 16.12 Innovent Biologics Inc.
- Innovent Biologics Inc. - Overview
- Innovent Biologics Inc. - Product / Service
- Innovent Biologics Inc. - Key offerings
- SWOT
- 16.13 LG Chem Ltd.
- LG Chem Ltd. - Overview
- LG Chem Ltd. - Business segments
- LG Chem Ltd. - Key news
- LG Chem Ltd. - Key offerings
- LG Chem Ltd. - Segment focus
- SWOT
- 16.14 Novo Nordisk AS
- Novo Nordisk AS - Overview
- Novo Nordisk AS - Business segments
- Novo Nordisk AS - Key offerings
- Novo Nordisk AS - Segment focus
- SWOT
- 16.15 Rhythm Pharmaceuticals Inc.
- Rhythm Pharmaceuticals Inc. - Overview
- Rhythm Pharmaceuticals Inc. - Product / Service
- Rhythm Pharmaceuticals Inc. - Key news
- Rhythm Pharmaceuticals Inc. - Key offerings
- SWOT
- 16.16 SCOHIA PHARMA Inc.
- SCOHIA PHARMA Inc. - Overview
- SCOHIA PHARMA Inc. - Product / Service
- SCOHIA PHARMA Inc. - Key news
- SCOHIA PHARMA Inc. - Key offerings
- SWOT
- 16.17 VIVUS LLC
- VIVUS LLC - Overview
- VIVUS LLC - Product / Service
- VIVUS LLC - Key offerings
- SWOT
- 16.18 Zydus Lifesciences Ltd.
- Zydus Lifesciences Ltd. - Overview
- Zydus Lifesciences Ltd. - Business segments
- Zydus Lifesciences Ltd. - Key news
- Zydus Lifesciences Ltd. - Key offerings
- Zydus Lifesciences Ltd. - Segment focus
- SWOT
17 Appendix
- 17.1 Scope of the report
- 17.2 Inclusions and exclusions checklist
- Inclusions checklist
- Exclusions checklist
- 17.3 Currency conversion rates for US$
- Currency conversion rates for US$
- 17.4 Research methodology
- Research methodology
- 17.5 Data procurement
- Information sources
- 17.6 Data validation
- Data validation
- 17.7 Validation techniques employed for market sizing
- Validation techniques employed for market sizing
- 17.8 Data synthesis
- Data synthesis
- 17.9 360 degree market analysis
- 360 degree market analysis
- 17.10 List of abbreviations
- List of abbreviations

