|
|
市場調査レポート
商品コード
1762934
食品包装の世界市場 2025-2029Global Food Packaging Market 2025-2029 |
||||||

|
|||||||
カスタマイズ可能
|
|||||||


| 食品包装の世界市場 2025-2029 |
|
出版日: 2025年06月19日
発行: TechNavio
ページ情報: 英文 245 Pages
納期: 即納可能
|

全表示
- 概要
- 図表
- 目次
食品包装市場は2024-2029年に796億米ドル、予測期間中のCAGRは4.1%で成長すると予測されます。
当レポートでは、食品包装市場の全体的な分析、市場規模・予測、動向、成長促進要因、課題、約25のベンダーを網羅したベンダー分析などを掲載しています。
現在の市場シナリオ、最新動向と促進要因、市場環境全体に関する最新分析を提供しています。食品偽造防止、食品廃棄回避の必要性、市場企業による食品包装に関する最近の開発動向などが市場を牽引しています。
| 市場範囲 | |
|---|---|
| 基準年 | 2025 |
| 終了年 | 2029 |
| 予測期間 | 2025-2029 |
| 成長モメンタム | 加速 |
| 前年比 | 3.8% |
| CAGR | 4.1% |
| 増分額 | 796億米ドル |
本調査は、業界の主要参加者からのインプットを含め、一次情報と二次情報を客観的に組み合わせて実施しました。レポートには、主要企業の分析に加え、包括的な市場規模データ、地域別分析によるセグメント、ベンダー情勢が含まれています。レポートには過去データと予測データがあります。
本調査では、今後数年間の食品包装市場の成長を促進する主な理由の一つとして、eコマースプラットフォームでの食品販売の増加を挙げています。また、市場ベンダーによる持続可能なパッケージングやスマートパッケージングソリューションの採用が増加し、市場の大きな需要につながります。
目次
第1章 エグゼクティブサマリー
- 市場概要
第2章 Technavio分析
- 価格・ライフサイクル・顧客購入バスケット・採用率・購入基準の分析
- インプットの重要性と差別化の要因
- 混乱の要因
- 促進要因と課題の影響
第3章 市場情勢
- 市場エコシステム
- 市場の特徴
- バリューチェーン分析
第4章 市場規模
- 市場の定義
- 市場セグメント分析
- 市場規模 2024
- 市場の見通し 2024-2029
第5章 市場規模実績
- 食品包装の世界市場 2019-2023
- 製品セグメント分析 2019-2023
- 用途別セグメント分析 2019-2023
- パッケージングセグメント分析 2019-2023
- 地域別セグメント分析 2019-2023
- 国別セグメント分析 2019-2023
第6章 定性分析
- AIの影響食品包装の世界市場
第7章 ファイブフォース分析
- ファイブフォースの要約
- 買い手の交渉力
- 供給企業の交渉力
- 新規参入業者の脅威
- 代替品の脅威
- 競争の脅威
- 市況
第8章 市場セグメンテーション:製品別
- 市場セグメント
- 比較:製品別
- 柔軟なプラスチック:市場規模と予測 2024-2029
- 硬質プラスチック:市場規模と予測 2024-2029
- ガラス:市場規模と予測 2024-2029
- 金属:市場規模と予測 2024-2029
- その他:市場規模と予測 2024-2029
- 市場機会:製品別
第9章 市場セグメンテーション:用途別
- 市場セグメント
- 比較:用途別
- パンと菓子類:市場規模と予測 2024-2029
- 乳製品:市場規模と予測 2024-2029
- 鶏肉と魚介類:市場規模と予測 2024-2029
- 果物と野菜:市場規模と予測 2024-2029
- その他:市場規模と予測 2024-2029
- 市場機会:用途別
第10章 市場セグメンテーション:パッケージング別
- 市場セグメント
- 比較:パッケージング別
- バッグとポーチ:市場規模と予測 2024-2029
- ボトルと瓶:市場規模と予測 2024-2029
- フィルムとラップ:市場規模と予測 2024-2029
- 箱とカートン:市場規模と予測 2024-2029
- その他:市場規模と予測 2024-2029
- 市場機会:パッケージング別
第11章 顧客情勢
- 顧客情勢の概要
第12章 地域別情勢
- 地域別セグメンテーション
- 地域別比較
- アジア太平洋:市場規模と予測 2024-2029
- 欧州:市場規模と予測 2024-2029
- 北米:市場規模と予測 2024-2029
- 南米:市場規模と予測 2024-2029
- 中東・アフリカ:市場規模と予測 2024-2029
- 米国:市場規模と予測 2024-2029
- 中国:市場規模と予測 2024-2029
- 日本:市場規模と予測 2024-2029
- インド:市場規模と予測 2024-2029
- ドイツ:市場規模と予測 2024-2029
- 英国:市場規模と予測 2024-2029
- カナダ:市場規模と予測 2024-2029
- フランス:市場規模と予測 2024-2029
- イタリア:市場規模と予測 2024-2029
- ブラジル:市場規模と予測 2024-2029
- 市場機会:地域情勢別
第13章 促進要因・課題・機会・抑制要因
- 市場促進要因
- 市場の課題
- 促進要因と課題の影響
- 市場の機会・抑制要因
第14章 競合情勢
- 概要
- 競合情勢
- 混乱の状況
- 業界のリスク
第15章 競合分析
- 企業プロファイル
- 企業ランキング指数
- 企業の市場ポジショニング
- Amcor Plc
- Ardagh Group SA
- Ball Corp.
- Berry Global Inc.
- BWAY Corp.
- COFCO Corp.
- Crown Holdings Inc.
- DS Smith Plc
- Huhtamaki Oyj
- International Paper Co.
- O I Glass Inc.
- Orora Ltd.
- Sealed Air Corp.
- Tetra Laval SA
- Toyo Seikan Group Holdings Ltd.
第16章 付録
Exhibits:
- Exhibits1: Executive Summary - Chart on Market Overview
- Exhibits2: Executive Summary - Data Table on Market Overview
- Exhibits3: Executive Summary - Chart on Global Market Characteristics
- Exhibits4: Executive Summary - Chart on Market By Geographical Landscape
- Exhibits5: Executive Summary - Chart on Market Segmentation by Product
- Exhibits6: Executive Summary - Chart on Market Segmentation by Application
- Exhibits7: Executive Summary - Chart on Market Segmentation by Packaging
- Exhibits8: Executive Summary - Chart on Incremental Growth
- Exhibits9: Executive Summary - Data Table on Incremental Growth
- Exhibits10: Executive Summary - Chart on Company Market Positioning
- Exhibits11: Analysis of price sensitivity, lifecycle, customer purchase basket, adoption rates, and purchase criteria
- Exhibits12: Overview on criticality of inputs and factors of differentiation
- Exhibits13: Overview on factors of disruption
- Exhibits14: Impact of drivers and challenges in 2024 and 2029
- Exhibits15: Parent Market
- Exhibits16: Data Table on - Parent Market
- Exhibits17: Market characteristics analysis
- Exhibits18: Value chain analysis
- Exhibits19: Offerings of companies included in the market definition
- Exhibits20: Market segments
- Exhibits21: Chart on Global - Market size and forecast 2024-2029 ($ billion)
- Exhibits22: Data Table on Global - Market size and forecast 2024-2029 ($ billion)
- Exhibits23: Chart on Global Market: Year-over-year growth 2024-2029 (%)
- Exhibits24: Data Table on Global Market: Year-over-year growth 2024-2029 (%)
- Exhibits25: Historic Market Size - Data Table on Global Food Packaging Market 2019 - 2023 ($ billion)
- Exhibits26: Historic Market Size - Product Segment 2019 - 2023 ($ billion)
- Exhibits27: Historic Market Size - Application Segment 2019 - 2023 ($ billion)
- Exhibits28: Historic Market Size - Packaging Segment 2019 - 2023 ($ billion)
- Exhibits29: Historic Market Size - Geography Segment 2019 - 2023 ($ billion)
- Exhibits30: Historic Market Size - Country Segment 2019 - 2023 ($ billion)
- Exhibits31: Five forces analysis - Comparison between 2024 and 2029
- Exhibits32: Bargaining power of buyers - Impact of key factors 2024 and 2029
- Exhibits33: Bargaining power of suppliers - Impact of key factors in 2024 and 2029
- Exhibits34: Threat of new entrants - Impact of key factors in 2024 and 2029
- Exhibits35: Threat of substitutes - Impact of key factors in 2024 and 2029
- Exhibits36: Threat of rivalry - Impact of key factors in 2024 and 2029
- Exhibits37: Chart on Market condition - Five forces 2024 and 2029
- Exhibits38: Chart on Product - Market share 2024-2029 (%)
- Exhibits39: Data Table on Product - Market share 2024-2029 (%)
- Exhibits40: Chart on Comparison by Product
- Exhibits41: Data Table on Comparison by Product
- Exhibits42: Chart on Flexible plastic - Market size and forecast 2024-2029 ($ billion)
- Exhibits43: Data Table on Flexible plastic - Market size and forecast 2024-2029 ($ billion)
- Exhibits44: Chart on Flexible plastic - Year-over-year growth 2024-2029 (%)
- Exhibits45: Data Table on Flexible plastic - Year-over-year growth 2024-2029 (%)
- Exhibits46: Chart on Rigid plastic - Market size and forecast 2024-2029 ($ billion)
- Exhibits47: Data Table on Rigid plastic - Market size and forecast 2024-2029 ($ billion)
- Exhibits48: Chart on Rigid plastic - Year-over-year growth 2024-2029 (%)
- Exhibits49: Data Table on Rigid plastic - Year-over-year growth 2024-2029 (%)
- Exhibits50: Chart on Glass - Market size and forecast 2024-2029 ($ billion)
- Exhibits51: Data Table on Glass - Market size and forecast 2024-2029 ($ billion)
- Exhibits52: Chart on Glass - Year-over-year growth 2024-2029 (%)
- Exhibits53: Data Table on Glass - Year-over-year growth 2024-2029 (%)
- Exhibits54: Chart on Metal - Market size and forecast 2024-2029 ($ billion)
- Exhibits55: Data Table on Metal - Market size and forecast 2024-2029 ($ billion)
- Exhibits56: Chart on Metal - Year-over-year growth 2024-2029 (%)
- Exhibits57: Data Table on Metal - Year-over-year growth 2024-2029 (%)
- Exhibits58: Chart on Others - Market size and forecast 2024-2029 ($ billion)
- Exhibits59: Data Table on Others - Market size and forecast 2024-2029 ($ billion)
- Exhibits60: Chart on Others - Year-over-year growth 2024-2029 (%)
- Exhibits61: Data Table on Others - Year-over-year growth 2024-2029 (%)
- Exhibits62: Market opportunity by Product ($ billion)
- Exhibits63: Data Table on Market opportunity by Product ($ billion)
- Exhibits64: Chart on Application - Market share 2024-2029 (%)
- Exhibits65: Data Table on Application - Market share 2024-2029 (%)
- Exhibits66: Chart on Comparison by Application
- Exhibits67: Data Table on Comparison by Application
- Exhibits68: Chart on Bakery and confectionery - Market size and forecast 2024-2029 ($ billion)
- Exhibits69: Data Table on Bakery and confectionery - Market size and forecast 2024-2029 ($ billion)
- Exhibits70: Chart on Bakery and confectionery - Year-over-year growth 2024-2029 (%)
- Exhibits71: Data Table on Bakery and confectionery - Year-over-year growth 2024-2029 (%)
- Exhibits72: Chart on Dairy products - Market size and forecast 2024-2029 ($ billion)
- Exhibits73: Data Table on Dairy products - Market size and forecast 2024-2029 ($ billion)
- Exhibits74: Chart on Dairy products - Year-over-year growth 2024-2029 (%)
- Exhibits75: Data Table on Dairy products - Year-over-year growth 2024-2029 (%)
- Exhibits76: Chart on Poultry meat and sea food - Market size and forecast 2024-2029 ($ billion)
- Exhibits77: Data Table on Poultry meat and sea food - Market size and forecast 2024-2029 ($ billion)
- Exhibits78: Chart on Poultry meat and sea food - Year-over-year growth 2024-2029 (%)
- Exhibits79: Data Table on Poultry meat and sea food - Year-over-year growth 2024-2029 (%)
- Exhibits80: Chart on Fruits and vegetables - Market size and forecast 2024-2029 ($ billion)
- Exhibits81: Data Table on Fruits and vegetables - Market size and forecast 2024-2029 ($ billion)
- Exhibits82: Chart on Fruits and vegetables - Year-over-year growth 2024-2029 (%)
- Exhibits83: Data Table on Fruits and vegetables - Year-over-year growth 2024-2029 (%)
- Exhibits84: Chart on Others - Market size and forecast 2024-2029 ($ billion)
- Exhibits85: Data Table on Others - Market size and forecast 2024-2029 ($ billion)
- Exhibits86: Chart on Others - Year-over-year growth 2024-2029 (%)
- Exhibits87: Data Table on Others - Year-over-year growth 2024-2029 (%)
- Exhibits88: Market opportunity by Application ($ billion)
- Exhibits89: Data Table on Market opportunity by Application ($ billion)
- Exhibits90: Chart on Packaging - Market share 2024-2029 (%)
- Exhibits91: Data Table on Packaging - Market share 2024-2029 (%)
- Exhibits92: Chart on Comparison by Packaging
- Exhibits93: Data Table on Comparison by Packaging
- Exhibits94: Chart on Bags and pouches - Market size and forecast 2024-2029 ($ billion)
- Exhibits95: Data Table on Bags and pouches - Market size and forecast 2024-2029 ($ billion)
- Exhibits96: Chart on Bags and pouches - Year-over-year growth 2024-2029 (%)
- Exhibits97: Data Table on Bags and pouches - Year-over-year growth 2024-2029 (%)
- Exhibits98: Chart on Bottles and jars - Market size and forecast 2024-2029 ($ billion)
- Exhibits99: Data Table on Bottles and jars - Market size and forecast 2024-2029 ($ billion)
- Exhibits100: Chart on Bottles and jars - Year-over-year growth 2024-2029 (%)
- Exhibits101: Data Table on Bottles and jars - Year-over-year growth 2024-2029 (%)
- Exhibits102: Chart on Films and wraps - Market size and forecast 2024-2029 ($ billion)
- Exhibits103: Data Table on Films and wraps - Market size and forecast 2024-2029 ($ billion)
- Exhibits104: Chart on Films and wraps - Year-over-year growth 2024-2029 (%)
- Exhibits105: Data Table on Films and wraps - Year-over-year growth 2024-2029 (%)
- Exhibits106: Chart on Boxes and cartons - Market size and forecast 2024-2029 ($ billion)
- Exhibits107: Data Table on Boxes and cartons - Market size and forecast 2024-2029 ($ billion)
- Exhibits108: Chart on Boxes and cartons - Year-over-year growth 2024-2029 (%)
- Exhibits109: Data Table on Boxes and cartons - Year-over-year growth 2024-2029 (%)
- Exhibits110: Chart on Others - Market size and forecast 2024-2029 ($ billion)
- Exhibits111: Data Table on Others - Market size and forecast 2024-2029 ($ billion)
- Exhibits112: Chart on Others - Year-over-year growth 2024-2029 (%)
- Exhibits113: Data Table on Others - Year-over-year growth 2024-2029 (%)
- Exhibits114: Market opportunity by Packaging ($ billion)
- Exhibits115: Data Table on Market opportunity by Packaging ($ billion)
- Exhibits116: Analysis of price sensitivity, lifecycle, customer purchase basket, adoption rates, and purchase criteria
- Exhibits117: Chart on Market share By Geographical Landscape 2024-2029 (%)
- Exhibits118: Data Table on Market share By Geographical Landscape 2024-2029 (%)
- Exhibits119: Chart on Geographic comparison
- Exhibits120: Data Table on Geographic comparison
- Exhibits121: Chart on APAC - Market size and forecast 2024-2029 ($ billion)
- Exhibits122: Data Table on APAC - Market size and forecast 2024-2029 ($ billion)
- Exhibits123: Chart on APAC - Year-over-year growth 2024-2029 (%)
- Exhibits124: Data Table on APAC - Year-over-year growth 2024-2029 (%)
- Exhibits125: Chart on Europe - Market size and forecast 2024-2029 ($ billion)
- Exhibits126: Data Table on Europe - Market size and forecast 2024-2029 ($ billion)
- Exhibits127: Chart on Europe - Year-over-year growth 2024-2029 (%)
- Exhibits128: Data Table on Europe - Year-over-year growth 2024-2029 (%)
- Exhibits129: Chart on North America - Market size and forecast 2024-2029 ($ billion)
- Exhibits130: Data Table on North America - Market size and forecast 2024-2029 ($ billion)
- Exhibits131: Chart on North America - Year-over-year growth 2024-2029 (%)
- Exhibits132: Data Table on North America - Year-over-year growth 2024-2029 (%)
- Exhibits133: Chart on South America - Market size and forecast 2024-2029 ($ billion)
- Exhibits134: Data Table on South America - Market size and forecast 2024-2029 ($ billion)
- Exhibits135: Chart on South America - Year-over-year growth 2024-2029 (%)
- Exhibits136: Data Table on South America - Year-over-year growth 2024-2029 (%)
- Exhibits137: Chart on Middle East and Africa - Market size and forecast 2024-2029 ($ billion)
- Exhibits138: Data Table on Middle East and Africa - Market size and forecast 2024-2029 ($ billion)
- Exhibits139: Chart on Middle East and Africa - Year-over-year growth 2024-2029 (%)
- Exhibits140: Data Table on Middle East and Africa - Year-over-year growth 2024-2029 (%)
- Exhibits141: Chart on US - Market size and forecast 2024-2029 ($ billion)
- Exhibits142: Data Table on US - Market size and forecast 2024-2029 ($ billion)
- Exhibits143: Chart on US - Year-over-year growth 2024-2029 (%)
- Exhibits144: Data Table on US - Year-over-year growth 2024-2029 (%)
- Exhibits145: Chart on China - Market size and forecast 2024-2029 ($ billion)
- Exhibits146: Data Table on China - Market size and forecast 2024-2029 ($ billion)
- Exhibits147: Chart on China - Year-over-year growth 2024-2029 (%)
- Exhibits148: Data Table on China - Year-over-year growth 2024-2029 (%)
- Exhibits149: Chart on Japan - Market size and forecast 2024-2029 ($ billion)
- Exhibits150: Data Table on Japan - Market size and forecast 2024-2029 ($ billion)
- Exhibits151: Chart on Japan - Year-over-year growth 2024-2029 (%)
- Exhibits152: Data Table on Japan - Year-over-year growth 2024-2029 (%)
- Exhibits153: Chart on India - Market size and forecast 2024-2029 ($ billion)
- Exhibits154: Data Table on India - Market size and forecast 2024-2029 ($ billion)
- Exhibits155: Chart on India - Year-over-year growth 2024-2029 (%)
- Exhibits156: Data Table on India - Year-over-year growth 2024-2029 (%)
- Exhibits157: Chart on Germany - Market size and forecast 2024-2029 ($ billion)
- Exhibits158: Data Table on Germany - Market size and forecast 2024-2029 ($ billion)
- Exhibits159: Chart on Germany - Year-over-year growth 2024-2029 (%)
- Exhibits160: Data Table on Germany - Year-over-year growth 2024-2029 (%)
- Exhibits161: Chart on UK - Market size and forecast 2024-2029 ($ billion)
- Exhibits162: Data Table on UK - Market size and forecast 2024-2029 ($ billion)
- Exhibits163: Chart on UK - Year-over-year growth 2024-2029 (%)
- Exhibits164: Data Table on UK - Year-over-year growth 2024-2029 (%)
- Exhibits165: Chart on Canada - Market size and forecast 2024-2029 ($ billion)
- Exhibits166: Data Table on Canada - Market size and forecast 2024-2029 ($ billion)
- Exhibits167: Chart on Canada - Year-over-year growth 2024-2029 (%)
- Exhibits168: Data Table on Canada - Year-over-year growth 2024-2029 (%)
- Exhibits169: Chart on France - Market size and forecast 2024-2029 ($ billion)
- Exhibits170: Data Table on France - Market size and forecast 2024-2029 ($ billion)
- Exhibits171: Chart on France - Year-over-year growth 2024-2029 (%)
- Exhibits172: Data Table on France - Year-over-year growth 2024-2029 (%)
- Exhibits173: Chart on Italy - Market size and forecast 2024-2029 ($ billion)
- Exhibits174: Data Table on Italy - Market size and forecast 2024-2029 ($ billion)
- Exhibits175: Chart on Italy - Year-over-year growth 2024-2029 (%)
- Exhibits176: Data Table on Italy - Year-over-year growth 2024-2029 (%)
- Exhibits177: Chart on Brazil - Market size and forecast 2024-2029 ($ billion)
- Exhibits178: Data Table on Brazil - Market size and forecast 2024-2029 ($ billion)
- Exhibits179: Chart on Brazil - Year-over-year growth 2024-2029 (%)
- Exhibits180: Data Table on Brazil - Year-over-year growth 2024-2029 (%)
- Exhibits181: Market opportunity By Geographical Landscape ($ billion)
- Exhibits182: Data Tables on Market opportunity By Geographical Landscape ($ billion)
- Exhibits183: Impact of drivers and challenges in 2024 and 2029
- Exhibits184: Overview on criticality of inputs and factors of differentiation
- Exhibits185: Overview on factors of disruption
- Exhibits186: Impact of key risks on business
- Exhibits187: Companies covered
- Exhibits188: Company ranking index
- Exhibits189: Matrix on companies position and classification
- Exhibits190: Amcor Plc - Overview
- Exhibits191: Amcor Plc - Business segments
- Exhibits192: Amcor Plc - Key news
- Exhibits193: Amcor Plc - Key offerings
- Exhibits194: Amcor Plc - Segment focus
- Exhibits195: SWOT
- Exhibits196: Ardagh Group SA - Overview
- Exhibits197: Ardagh Group SA - Business segments
- Exhibits198: Ardagh Group SA - Key news
- Exhibits199: Ardagh Group SA - Key offerings
- Exhibits200: Ardagh Group SA - Segment focus
- Exhibits201: SWOT
- Exhibits202: Ball Corp. - Overview
- Exhibits203: Ball Corp. - Business segments
- Exhibits204: Ball Corp. - Key offerings
- Exhibits205: Ball Corp. - Segment focus
- Exhibits206: SWOT
- Exhibits207: Berry Global Inc. - Overview
- Exhibits208: Berry Global Inc. - Business segments
- Exhibits209: Berry Global Inc. - Key news
- Exhibits210: Berry Global Inc. - Key offerings
- Exhibits211: Berry Global Inc. - Segment focus
- Exhibits212: SWOT
- Exhibits213: BWAY Corp. - Overview
- Exhibits214: BWAY Corp. - Product / Service
- Exhibits215: BWAY Corp. - Key offerings
- Exhibits216: SWOT
- Exhibits217: COFCO Corp. - Overview
- Exhibits218: COFCO Corp. - Product / Service
- Exhibits219: COFCO Corp. - Key offerings
- Exhibits220: SWOT
- Exhibits221: Crown Holdings Inc. - Overview
- Exhibits222: Crown Holdings Inc. - Business segments
- Exhibits223: Crown Holdings Inc. - Key offerings
- Exhibits224: Crown Holdings Inc. - Segment focus
- Exhibits225: SWOT
- Exhibits226: DS Smith Plc - Overview
- Exhibits227: DS Smith Plc - Business segments
- Exhibits228: DS Smith Plc - Key news
- Exhibits229: DS Smith Plc - Key offerings
- Exhibits230: DS Smith Plc - Segment focus
- Exhibits231: SWOT
- Exhibits232: Huhtamaki Oyj - Overview
- Exhibits233: Huhtamaki Oyj - Business segments
- Exhibits234: Huhtamaki Oyj - Key news
- Exhibits235: Huhtamaki Oyj - Key offerings
- Exhibits236: Huhtamaki Oyj - Segment focus
- Exhibits237: SWOT
- Exhibits238: International Paper Co. - Overview
- Exhibits239: International Paper Co. - Business segments
- Exhibits240: International Paper Co. - Key news
- Exhibits241: International Paper Co. - Key offerings
- Exhibits242: International Paper Co. - Segment focus
- Exhibits243: SWOT
- Exhibits244: O I Glass Inc. - Overview
- Exhibits245: O I Glass Inc. - Business segments
- Exhibits246: O I Glass Inc. - Key news
- Exhibits247: O I Glass Inc. - Key offerings
- Exhibits248: O I Glass Inc. - Segment focus
- Exhibits249: SWOT
- Exhibits250: Orora Ltd. - Overview
- Exhibits251: Orora Ltd. - Business segments
- Exhibits252: Orora Ltd. - Key offerings
- Exhibits253: Orora Ltd. - Segment focus
- Exhibits254: SWOT
- Exhibits255: Sealed Air Corp. - Overview
- Exhibits256: Sealed Air Corp. - Business segments
- Exhibits257: Sealed Air Corp. - Key news
- Exhibits258: Sealed Air Corp. - Key offerings
- Exhibits259: Sealed Air Corp. - Segment focus
- Exhibits260: SWOT
- Exhibits261: Tetra Laval SA - Overview
- Exhibits262: Tetra Laval SA - Product / Service
- Exhibits263: Tetra Laval SA - Key news
- Exhibits264: Tetra Laval SA - Key offerings
- Exhibits265: SWOT
- Exhibits266: Toyo Seikan Group Holdings Ltd. - Overview
- Exhibits267: Toyo Seikan Group Holdings Ltd. - Business segments
- Exhibits268: Toyo Seikan Group Holdings Ltd. - Key offerings
- Exhibits269: Toyo Seikan Group Holdings Ltd. - Segment focus
- Exhibits270: SWOT
- Exhibits271: Inclusions checklist
- Exhibits272: Exclusions checklist
- Exhibits273: Currency conversion rates for US$
- Exhibits274: Research methodology
- Exhibits275: Information sources
- Exhibits276: Data validation
- Exhibits277: Validation techniques employed for market sizing
- Exhibits278: Data synthesis
- Exhibits279: 360 degree market analysis
- Exhibits280: List of abbreviations
The food packaging market is forecasted to grow by USD 79.6 bn during 2024-2029, accelerating at a CAGR of 4.1% during the forecast period. The report on the food packaging market provides a holistic analysis, market size and forecast, trends, growth drivers, and challenges, as well as vendor analysis covering around 25 vendors.
The report offers an up-to-date analysis regarding the current market scenario, the latest trends and drivers, and the overall market environment. The market is driven by prevention of food counterfeiting, need to avoid food wastage, and recent development on food packaging by market companies.
| Market Scope | |
|---|---|
| Base Year | 2025 |
| End Year | 2029 |
| Series Year | 2025-2029 |
| Growth Momentum | Accelerate |
| YOY 2025 | 3.8% |
| CAGR | 4.1% |
| Incremental Value | $79.6 bn |
The study was conducted using an objective combination of primary and secondary information including inputs from key participants in the industry. The report contains a comprehensive market size data, segment with regional analysis and vendor landscape in addition to an analysis of the key companies. Reports have historic and forecast data.
Technavio's food packaging market is segmented as below:
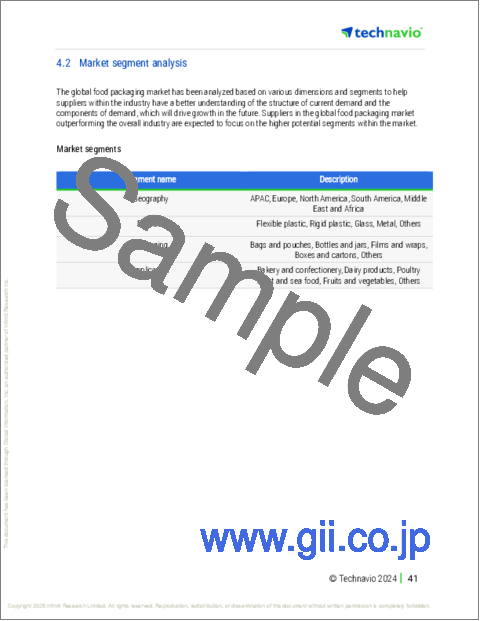
By Product
- Flexible plastic
- Rigid plastic
- Glass
- Metal
- Others
By Application
- Bakery and confectionery
- Dairy products
- Poultry meat and sea food
- Fruits and vegetables
- Others
By Packaging
- Bags and pouches
- Bottles and jars
- Films and wraps
- Boxes and cartons
- Others
By Geographical Landscape
- APAC
- Europe
- North America
- South America
- Middle East and Africa
This study identifies the growing sales of food products on e-commerce platforms as one of the prime reasons driving the food packaging market growth during the next few years. Also, rising adoption of sustainable packaging and smart packaging solutions by market vendors will lead to sizable demand in the market.
The report on the food packaging market covers the following areas:
- Food Packaging Market sizing
- Food Packaging Market forecast
- Food Packaging Market industry analysis
The robust vendor analysis is designed to help clients improve their market position, and in line with this, this report provides a detailed analysis of several leading food packaging market vendors that include Amcor Plc, Ardagh Group SA, Ball Corp., Berry Global Inc., BWAY Corp., CANPACK SA, COFCO Corp., Crown Holdings Inc., DS Smith Plc, Huhtamaki Oyj, International Paper Co., Kian Joo Can Factory Bhd, Metal Packaging Europe, O I Glass Inc., Orora Ltd., Sealed Air Corp., Silgan Holdings Inc., Tata Steel Ltd., Tetra Laval SA, and Toyo Seikan Group Holdings Ltd.. Also, the food packaging market analysis report includes information on upcoming trends and challenges that will influence market growth. This is to help companies strategize and leverage all forthcoming growth opportunities.
The publisher presents a detailed picture of the market by the way of study, synthesis, and summation of data from multiple sources by an analysis of key parameters such as profit, pricing, competition, and promotions. It presents various market facets by identifying the key industry influencers. The data presented is comprehensive, reliable, and a result of extensive primary and secondary research. The market research reports provide a complete competitive landscape and an in-depth vendor selection methodology and analysis using qualitative and quantitative research to forecast accurate market growth.
Table of Contents
1 Executive Summary
- 1.1 Market overview
- Executive Summary - Chart on Market Overview
- Executive Summary - Data Table on Market Overview
- Executive Summary - Chart on Global Market Characteristics
- Executive Summary - Chart on Market By Geographical Landscape
- Executive Summary - Chart on Market Segmentation by Product
- Executive Summary - Chart on Market Segmentation by Application
- Executive Summary - Chart on Market Segmentation by Packaging
- Executive Summary - Chart on Incremental Growth
- Executive Summary - Data Table on Incremental Growth
- Executive Summary - Chart on Company Market Positioning
2 Technavio Analysis
- 2.1 Analysis of price sensitivity, lifecycle, customer purchase basket, adoption rates, and purchase criteria
- Analysis of price sensitivity, lifecycle, customer purchase basket, adoption rates, and purchase criteria
- 2.2 Criticality of inputs and Factors of differentiation
- Overview on criticality of inputs and factors of differentiation
- 2.3 Factors of disruption
- Overview on factors of disruption
- 2.4 Impact of drivers and challenges
- Impact of drivers and challenges in 2024 and 2029
3 Market Landscape
- 3.1 Market ecosystem
- Parent Market
- Data Table on - Parent Market
- 3.2 Market characteristics
- Market characteristics analysis
- 3.3 Value chain analysis
- Value chain analysis
4 Market Sizing
- 4.1 Market definition
- Offerings of companies included in the market definition
- 4.2 Market segment analysis
- Market segments
- 4.3 Market size 2024
- 4.4 Market outlook: Forecast for 2024-2029
- Chart on Global - Market size and forecast 2024-2029 ($ billion)
- Data Table on Global - Market size and forecast 2024-2029 ($ billion)
- Chart on Global Market: Year-over-year growth 2024-2029 (%)
- Data Table on Global Market: Year-over-year growth 2024-2029 (%)
5 Historic Market Size
- 5.1 Global Food Packaging Market 2019 - 2023
- Historic Market Size - Data Table on Global Food Packaging Market 2019 - 2023 ($ billion)
- 5.2 Product segment analysis 2019 - 2023
- Historic Market Size - Product Segment 2019 - 2023 ($ billion)
- 5.3 Application segment analysis 2019 - 2023
- Historic Market Size - Application Segment 2019 - 2023 ($ billion)
- 5.4 Packaging segment analysis 2019 - 2023
- Historic Market Size - Packaging Segment 2019 - 2023 ($ billion)
- 5.5 Geography segment analysis 2019 - 2023
- Historic Market Size - Geography Segment 2019 - 2023 ($ billion)
- 5.6 Country segment analysis 2019 - 2023
- Historic Market Size - Country Segment 2019 - 2023 ($ billion)
6 Qualitative Analysis
- 6.1 Impact of AI in the Global Food Packaging Market
7 Five Forces Analysis
- 7.1 Five forces summary
- Five forces analysis - Comparison between 2024 and 2029
- 7.2 Bargaining power of buyers
- Bargaining power of buyers - Impact of key factors 2024 and 2029
- 7.3 Bargaining power of suppliers
- Bargaining power of suppliers - Impact of key factors in 2024 and 2029
- 7.4 Threat of new entrants
- Threat of new entrants - Impact of key factors in 2024 and 2029
- 7.5 Threat of substitutes
- Threat of substitutes - Impact of key factors in 2024 and 2029
- 7.6 Threat of rivalry
- Threat of rivalry - Impact of key factors in 2024 and 2029
- 7.7 Market condition
- Chart on Market condition - Five forces 2024 and 2029
8 Market Segmentation by Product
- 8.1 Market segments
- Chart on Product - Market share 2024-2029 (%)
- Data Table on Product - Market share 2024-2029 (%)
- 8.2 Comparison by Product
- Chart on Comparison by Product
- Data Table on Comparison by Product
- 8.3 Flexible plastic - Market size and forecast 2024-2029
- Chart on Flexible plastic - Market size and forecast 2024-2029 ($ billion)
- Data Table on Flexible plastic - Market size and forecast 2024-2029 ($ billion)
- Chart on Flexible plastic - Year-over-year growth 2024-2029 (%)
- Data Table on Flexible plastic - Year-over-year growth 2024-2029 (%)
- 8.4 Rigid plastic - Market size and forecast 2024-2029
- Chart on Rigid plastic - Market size and forecast 2024-2029 ($ billion)
- Data Table on Rigid plastic - Market size and forecast 2024-2029 ($ billion)
- Chart on Rigid plastic - Year-over-year growth 2024-2029 (%)
- Data Table on Rigid plastic - Year-over-year growth 2024-2029 (%)
- 8.5 Glass - Market size and forecast 2024-2029
- Chart on Glass - Market size and forecast 2024-2029 ($ billion)
- Data Table on Glass - Market size and forecast 2024-2029 ($ billion)
- Chart on Glass - Year-over-year growth 2024-2029 (%)
- Data Table on Glass - Year-over-year growth 2024-2029 (%)
- 8.6 Metal - Market size and forecast 2024-2029
- Chart on Metal - Market size and forecast 2024-2029 ($ billion)
- Data Table on Metal - Market size and forecast 2024-2029 ($ billion)
- Chart on Metal - Year-over-year growth 2024-2029 (%)
- Data Table on Metal - Year-over-year growth 2024-2029 (%)
- 8.7 Others - Market size and forecast 2024-2029
- Chart on Others - Market size and forecast 2024-2029 ($ billion)
- Data Table on Others - Market size and forecast 2024-2029 ($ billion)
- Chart on Others - Year-over-year growth 2024-2029 (%)
- Data Table on Others - Year-over-year growth 2024-2029 (%)
- 8.8 Market opportunity by Product
- Market opportunity by Product ($ billion)
- Data Table on Market opportunity by Product ($ billion)
9 Market Segmentation by Application
- 9.1 Market segments
- Chart on Application - Market share 2024-2029 (%)
- Data Table on Application - Market share 2024-2029 (%)
- 9.2 Comparison by Application
- Chart on Comparison by Application
- Data Table on Comparison by Application
- 9.3 Bakery and confectionery - Market size and forecast 2024-2029
- Chart on Bakery and confectionery - Market size and forecast 2024-2029 ($ billion)
- Data Table on Bakery and confectionery - Market size and forecast 2024-2029 ($ billion)
- Chart on Bakery and confectionery - Year-over-year growth 2024-2029 (%)
- Data Table on Bakery and confectionery - Year-over-year growth 2024-2029 (%)
- 9.4 Dairy products - Market size and forecast 2024-2029
- Chart on Dairy products - Market size and forecast 2024-2029 ($ billion)
- Data Table on Dairy products - Market size and forecast 2024-2029 ($ billion)
- Chart on Dairy products - Year-over-year growth 2024-2029 (%)
- Data Table on Dairy products - Year-over-year growth 2024-2029 (%)
- 9.5 Poultry meat and sea food - Market size and forecast 2024-2029
- Chart on Poultry meat and sea food - Market size and forecast 2024-2029 ($ billion)
- Data Table on Poultry meat and sea food - Market size and forecast 2024-2029 ($ billion)
- Chart on Poultry meat and sea food - Year-over-year growth 2024-2029 (%)
- Data Table on Poultry meat and sea food - Year-over-year growth 2024-2029 (%)
- 9.6 Fruits and vegetables - Market size and forecast 2024-2029
- Chart on Fruits and vegetables - Market size and forecast 2024-2029 ($ billion)
- Data Table on Fruits and vegetables - Market size and forecast 2024-2029 ($ billion)
- Chart on Fruits and vegetables - Year-over-year growth 2024-2029 (%)
- Data Table on Fruits and vegetables - Year-over-year growth 2024-2029 (%)
- 9.7 Others - Market size and forecast 2024-2029
- Chart on Others - Market size and forecast 2024-2029 ($ billion)
- Data Table on Others - Market size and forecast 2024-2029 ($ billion)
- Chart on Others - Year-over-year growth 2024-2029 (%)
- Data Table on Others - Year-over-year growth 2024-2029 (%)
- 9.8 Market opportunity by Application
- Market opportunity by Application ($ billion)
- Data Table on Market opportunity by Application ($ billion)
10 Market Segmentation by Packaging
- 10.1 Market segments
- Chart on Packaging - Market share 2024-2029 (%)
- Data Table on Packaging - Market share 2024-2029 (%)
- 10.2 Comparison by Packaging
- Chart on Comparison by Packaging
- Data Table on Comparison by Packaging
- 10.3 Bags and pouches - Market size and forecast 2024-2029
- Chart on Bags and pouches - Market size and forecast 2024-2029 ($ billion)
- Data Table on Bags and pouches - Market size and forecast 2024-2029 ($ billion)
- Chart on Bags and pouches - Year-over-year growth 2024-2029 (%)
- Data Table on Bags and pouches - Year-over-year growth 2024-2029 (%)
- 10.4 Bottles and jars - Market size and forecast 2024-2029
- Chart on Bottles and jars - Market size and forecast 2024-2029 ($ billion)
- Data Table on Bottles and jars - Market size and forecast 2024-2029 ($ billion)
- Chart on Bottles and jars - Year-over-year growth 2024-2029 (%)
- Data Table on Bottles and jars - Year-over-year growth 2024-2029 (%)
- 10.5 Films and wraps - Market size and forecast 2024-2029
- Chart on Films and wraps - Market size and forecast 2024-2029 ($ billion)
- Data Table on Films and wraps - Market size and forecast 2024-2029 ($ billion)
- Chart on Films and wraps - Year-over-year growth 2024-2029 (%)
- Data Table on Films and wraps - Year-over-year growth 2024-2029 (%)
- 10.6 Boxes and cartons - Market size and forecast 2024-2029
- Chart on Boxes and cartons - Market size and forecast 2024-2029 ($ billion)
- Data Table on Boxes and cartons - Market size and forecast 2024-2029 ($ billion)
- Chart on Boxes and cartons - Year-over-year growth 2024-2029 (%)
- Data Table on Boxes and cartons - Year-over-year growth 2024-2029 (%)
- 10.7 Others - Market size and forecast 2024-2029
- Chart on Others - Market size and forecast 2024-2029 ($ billion)
- Data Table on Others - Market size and forecast 2024-2029 ($ billion)
- Chart on Others - Year-over-year growth 2024-2029 (%)
- Data Table on Others - Year-over-year growth 2024-2029 (%)
- 10.8 Market opportunity by Packaging
- Market opportunity by Packaging ($ billion)
- Data Table on Market opportunity by Packaging ($ billion)
11 Customer Landscape
- 11.1 Customer landscape overview
- Analysis of price sensitivity, lifecycle, customer purchase basket, adoption rates, and purchase criteria
12 Geographic Landscape
- 12.1 Geographic segmentation
- Chart on Market share By Geographical Landscape 2024-2029 (%)
- Data Table on Market share By Geographical Landscape 2024-2029 (%)
- 12.2 Geographic comparison
- Chart on Geographic comparison
- Data Table on Geographic comparison
- 12.3 APAC - Market size and forecast 2024-2029
- Chart on APAC - Market size and forecast 2024-2029 ($ billion)
- Data Table on APAC - Market size and forecast 2024-2029 ($ billion)
- Chart on APAC - Year-over-year growth 2024-2029 (%)
- Data Table on APAC - Year-over-year growth 2024-2029 (%)
- 12.4 Europe - Market size and forecast 2024-2029
- Chart on Europe - Market size and forecast 2024-2029 ($ billion)
- Data Table on Europe - Market size and forecast 2024-2029 ($ billion)
- Chart on Europe - Year-over-year growth 2024-2029 (%)
- Data Table on Europe - Year-over-year growth 2024-2029 (%)
- 12.5 North America - Market size and forecast 2024-2029
- Chart on North America - Market size and forecast 2024-2029 ($ billion)
- Data Table on North America - Market size and forecast 2024-2029 ($ billion)
- Chart on North America - Year-over-year growth 2024-2029 (%)
- Data Table on North America - Year-over-year growth 2024-2029 (%)
- 12.6 South America - Market size and forecast 2024-2029
- Chart on South America - Market size and forecast 2024-2029 ($ billion)
- Data Table on South America - Market size and forecast 2024-2029 ($ billion)
- Chart on South America - Year-over-year growth 2024-2029 (%)
- Data Table on South America - Year-over-year growth 2024-2029 (%)
- 12.7 Middle East and Africa - Market size and forecast 2024-2029
- Chart on Middle East and Africa - Market size and forecast 2024-2029 ($ billion)
- Data Table on Middle East and Africa - Market size and forecast 2024-2029 ($ billion)
- Chart on Middle East and Africa - Year-over-year growth 2024-2029 (%)
- Data Table on Middle East and Africa - Year-over-year growth 2024-2029 (%)
- 12.8 US - Market size and forecast 2024-2029
- Chart on US - Market size and forecast 2024-2029 ($ billion)
- Data Table on US - Market size and forecast 2024-2029 ($ billion)
- Chart on US - Year-over-year growth 2024-2029 (%)
- Data Table on US - Year-over-year growth 2024-2029 (%)
- 12.9 China - Market size and forecast 2024-2029
- Chart on China - Market size and forecast 2024-2029 ($ billion)
- Data Table on China - Market size and forecast 2024-2029 ($ billion)
- Chart on China - Year-over-year growth 2024-2029 (%)
- Data Table on China - Year-over-year growth 2024-2029 (%)
- 12.10 Japan - Market size and forecast 2024-2029
- Chart on Japan - Market size and forecast 2024-2029 ($ billion)
- Data Table on Japan - Market size and forecast 2024-2029 ($ billion)
- Chart on Japan - Year-over-year growth 2024-2029 (%)
- Data Table on Japan - Year-over-year growth 2024-2029 (%)
- 12.11 India - Market size and forecast 2024-2029
- Chart on India - Market size and forecast 2024-2029 ($ billion)
- Data Table on India - Market size and forecast 2024-2029 ($ billion)
- Chart on India - Year-over-year growth 2024-2029 (%)
- Data Table on India - Year-over-year growth 2024-2029 (%)
- 12.12 Germany - Market size and forecast 2024-2029
- Chart on Germany - Market size and forecast 2024-2029 ($ billion)
- Data Table on Germany - Market size and forecast 2024-2029 ($ billion)
- Chart on Germany - Year-over-year growth 2024-2029 (%)
- Data Table on Germany - Year-over-year growth 2024-2029 (%)
- 12.13 UK - Market size and forecast 2024-2029
- Chart on UK - Market size and forecast 2024-2029 ($ billion)
- Data Table on UK - Market size and forecast 2024-2029 ($ billion)
- Chart on UK - Year-over-year growth 2024-2029 (%)
- Data Table on UK - Year-over-year growth 2024-2029 (%)
- 12.14 Canada - Market size and forecast 2024-2029
- Chart on Canada - Market size and forecast 2024-2029 ($ billion)
- Data Table on Canada - Market size and forecast 2024-2029 ($ billion)
- Chart on Canada - Year-over-year growth 2024-2029 (%)
- Data Table on Canada - Year-over-year growth 2024-2029 (%)
- 12.15 France - Market size and forecast 2024-2029
- Chart on France - Market size and forecast 2024-2029 ($ billion)
- Data Table on France - Market size and forecast 2024-2029 ($ billion)
- Chart on France - Year-over-year growth 2024-2029 (%)
- Data Table on France - Year-over-year growth 2024-2029 (%)
- 12.16 Italy - Market size and forecast 2024-2029
- Chart on Italy - Market size and forecast 2024-2029 ($ billion)
- Data Table on Italy - Market size and forecast 2024-2029 ($ billion)
- Chart on Italy - Year-over-year growth 2024-2029 (%)
- Data Table on Italy - Year-over-year growth 2024-2029 (%)
- 12.17 Brazil - Market size and forecast 2024-2029
- Chart on Brazil - Market size and forecast 2024-2029 ($ billion)
- Data Table on Brazil - Market size and forecast 2024-2029 ($ billion)
- Chart on Brazil - Year-over-year growth 2024-2029 (%)
- Data Table on Brazil - Year-over-year growth 2024-2029 (%)
- 12.18 Market opportunity By Geographical Landscape
- Market opportunity By Geographical Landscape ($ billion)
- Data Tables on Market opportunity By Geographical Landscape ($ billion)
13 Drivers, Challenges, and Opportunity/Restraints
- 13.1 Market drivers
- 13.2 Market challenges
- 13.3 Impact of drivers and challenges
- Impact of drivers and challenges in 2024 and 2029
- 13.4 Market opportunities/restraints
14 Competitive Landscape
- 14.1 Overview
- 14.2 Competitive Landscape
- Overview on criticality of inputs and factors of differentiation
- 14.3 Landscape disruption
- Overview on factors of disruption
- 14.4 Industry risks
- Impact of key risks on business
15 Competitive Analysis
- 15.1 Companies profiled
- Companies covered
- 15.2 Company ranking index
- Company ranking index
- 15.3 Market positioning of companies
- Matrix on companies position and classification
- 15.4 Amcor Plc
- Amcor Plc - Overview
- Amcor Plc - Business segments
- Amcor Plc - Key news
- Amcor Plc - Key offerings
- Amcor Plc - Segment focus
- SWOT
- 15.5 Ardagh Group SA
- Ardagh Group SA - Overview
- Ardagh Group SA - Business segments
- Ardagh Group SA - Key news
- Ardagh Group SA - Key offerings
- Ardagh Group SA - Segment focus
- SWOT
- 15.6 Ball Corp.
- Ball Corp. - Overview
- Ball Corp. - Business segments
- Ball Corp. - Key offerings
- Ball Corp. - Segment focus
- SWOT
- 15.7 Berry Global Inc.
- Berry Global Inc. - Overview
- Berry Global Inc. - Business segments
- Berry Global Inc. - Key news
- Berry Global Inc. - Key offerings
- Berry Global Inc. - Segment focus
- SWOT
- 15.8 BWAY Corp.
- BWAY Corp. - Overview
- BWAY Corp. - Product / Service
- BWAY Corp. - Key offerings
- SWOT
- 15.9 COFCO Corp.
- COFCO Corp. - Overview
- COFCO Corp. - Product / Service
- COFCO Corp. - Key offerings
- SWOT
- 15.10 Crown Holdings Inc.
- Crown Holdings Inc. - Overview
- Crown Holdings Inc. - Business segments
- Crown Holdings Inc. - Key offerings
- Crown Holdings Inc. - Segment focus
- SWOT
- 15.11 DS Smith Plc
- DS Smith Plc - Overview
- DS Smith Plc - Business segments
- DS Smith Plc - Key news
- DS Smith Plc - Key offerings
- DS Smith Plc - Segment focus
- SWOT
- 15.12 Huhtamaki Oyj
- Huhtamaki Oyj - Overview
- Huhtamaki Oyj - Business segments
- Huhtamaki Oyj - Key news
- Huhtamaki Oyj - Key offerings
- Huhtamaki Oyj - Segment focus
- SWOT
- 15.13 International Paper Co.
- International Paper Co. - Overview
- International Paper Co. - Business segments
- International Paper Co. - Key news
- International Paper Co. - Key offerings
- International Paper Co. - Segment focus
- SWOT
- 15.14 O I Glass Inc.
- O I Glass Inc. - Overview
- O I Glass Inc. - Business segments
- O I Glass Inc. - Key news
- O I Glass Inc. - Key offerings
- O I Glass Inc. - Segment focus
- SWOT
- 15.15 Orora Ltd.
- Orora Ltd. - Overview
- Orora Ltd. - Business segments
- Orora Ltd. - Key offerings
- Orora Ltd. - Segment focus
- SWOT
- 15.16 Sealed Air Corp.
- Sealed Air Corp. - Overview
- Sealed Air Corp. - Business segments
- Sealed Air Corp. - Key news
- Sealed Air Corp. - Key offerings
- Sealed Air Corp. - Segment focus
- SWOT
- 15.17 Tetra Laval SA
- Tetra Laval SA - Overview
- Tetra Laval SA - Product / Service
- Tetra Laval SA - Key news
- Tetra Laval SA - Key offerings
- SWOT
- 15.18 Toyo Seikan Group Holdings Ltd.
- Toyo Seikan Group Holdings Ltd. - Overview
- Toyo Seikan Group Holdings Ltd. - Business segments
- Toyo Seikan Group Holdings Ltd. - Key offerings
- Toyo Seikan Group Holdings Ltd. - Segment focus
- SWOT
16 Appendix
- 16.1 Scope of the report
- 16.2 Inclusions and exclusions checklist
- Inclusions checklist
- Exclusions checklist
- 16.3 Currency conversion rates for US$
- Currency conversion rates for US$
- 16.4 Research methodology
- Research methodology
- 16.5 Data procurement
- Information sources
- 16.6 Data validation
- Data validation
- 16.7 Validation techniques employed for market sizing
- Validation techniques employed for market sizing
- 16.8 Data synthesis
- Data synthesis
- 16.9 360 degree market analysis
- 360 degree market analysis
- 16.10 List of abbreviations
- List of abbreviations

