|
|
市場調査レポート
商品コード
1975439
赤ちゃん用食品と乳児用粉ミルクの世界市場 2026年~2030年Global Baby Food And Infant Formula Market 2026-2030 |
||||||
|
|||||||
カスタマイズ可能
|
|||||||

| 赤ちゃん用食品と乳児用粉ミルクの世界市場 2026年~2030年 |
|
出版日: 2026年03月09日
発行: TechNavio
ページ情報: 英文 296 Pages
納期: 即納可能
|

概要
世界のベビーフードおよび乳児用調製粉乳市場は、2025年から2030年にかけて450億6,730万米ドルの成長が見込まれ、予測期間中のCAGRは7.5%と予測されています。
本報告書では、世界のベビーフードおよび乳児用調製粉乳市場に関する包括的な分析、市場規模と予測、動向、成長要因、課題に加え、約25社のベンダー分析を提供しております。
本レポートは、現在の市場状況、最新の市場動向と促進要因、市場環境全般に関する最新の分析を提供します。市場は、機能性強化とヒト乳オリゴ糖(HMO)の主流化、デジタルオムニチャネル流通とサブスクリプションモデルの産業化、クリーンラベルの透明性と持続可能な植物由来代替品の普及によって牽引されています。
本調査は、業界の主要関係者からの情報を含む、一次情報と二次情報の客観的な組み合わせを用いて実施されました。本レポートには、主要企業の分析に加え、包括的な市場規模データ、地域別分析を伴うセグメント、ベンダー情勢が含まれています。レポートには過去データと予測データが掲載されています。
| 市場範囲 | |
|---|---|
| 基準年 | 2026年 |
| 終了年 | 2030年 |
| 予測期間 | 2026-2030 |
| 成長モメンタム | 加速 |
| 前年比2026年 | 7.1% |
| CAGR | 7.5% |
| 増分額 | 450億6,730万米ドル |
本調査では、今後数年間における世界のベビーフードおよび乳児用調製粉乳市場の成長を牽引する主要要因の一つとして、乳児用調製粉乳分野におけるバイオミメティクス(生物模倣技術)と精密発酵技術の台頭が挙げられます。また、味覚工学の進展、風味重視の離乳食への移行、持続可能性の制度化、プラスチックフリーで循環型包装の普及が、市場において相当な需要を生み出すと予測されます。
目次
第1章 エグゼクティブサマリー
第2章 Technavio分析
- 価格・ライフサイクル・顧客購入バスケット・採用率・購入基準の分析
- インプットの重要性と差別化の要因
- 混乱の要因
- 促進要因と課題の影響
第3章 市場情勢
- 市場エコシステム
- 市場の特徴
- バリューチェーン分析
第4章 市場規模
- 市場の定義
- 市場セグメント分析
- 市場規模 2025
- 市場の見通し 2025-2030
第5章 市場規模実績
- 赤ちゃん用食品と乳児用粉ミルクの世界市場 2020-2024
- 製品セグメント分析 2020-2024
- タイプセグメント分析 2020-2024
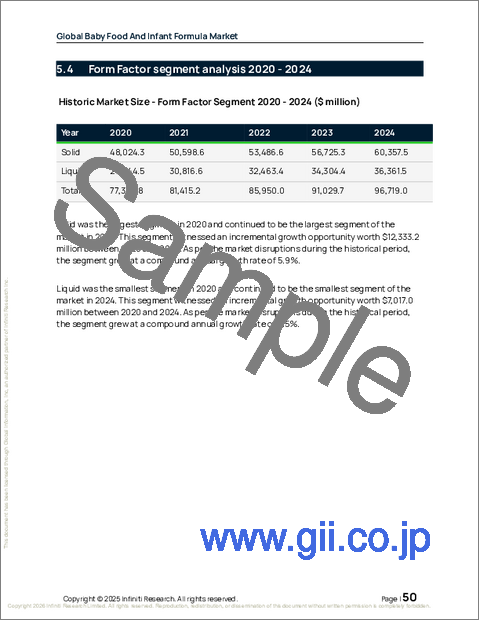
- 形状別セグメント分析 2020-2024
- 地域別セグメント分析 2020-2024
- 国別セグメント分析 2020-2024
第6章 定性分析
- AIの影響:赤ちゃん用食品と乳児用粉ミルクの世界市場
第7章 ファイブフォース分析
- ファイブフォースの要約
- 買い手の交渉力
- 供給企業の交渉力
- 新規参入業者の脅威
- 代替品の脅威
- 競争の脅威
- 市況
第8章 市場セグメンテーション:製品別
- 比較:製品別
- 乳児用調製粉乳
- ベビーフード
- 市場機会:製品別
第9章 市場セグメンテーション:タイプ別
- 比較:タイプ別
- 粉ミルク
- 乾燥ベビーフード
- 調理済みベビーフード
- その他
- 市場機会:タイプ別
第10章 市場セグメンテーション:フォームファクター別
- 比較:フォームファクター別
- 固体
- 液体
- 市場機会:フォームファクター別
第11章 顧客情勢
第12章 地域別情勢
- 地域別セグメンテーション
- 地域別比較
- アジア太平洋
- 中国
- インド
- インドネシア
- 日本
- オーストラリア
- 韓国
- 欧州
- ドイツ
- 英国
- フランス
- イタリア
- スペイン
- オランダ
- 北米
- 米国
- カナダ
- メキシコ
- 南米
- ブラジル
- アルゼンチン
- チリ
- 中東・アフリカ
- サウジアラビア
- アラブ首長国連邦
- 南アフリカ
- トルコ
- エジプト
- 市場機会:地域別
第13章 促進要因・課題・機会
- 市場促進要因
- 市場の課題
- 促進要因と課題の影響
- 市場機会
第14章 競合情勢
- 概要
- 競合情勢
- 混乱の状況
- 業界のリスク
第15章 競合分析
- 企業プロファイル
- 企業ランキング指標
- 企業の市場ポジショニング
- Abbott Laboratories
- Albertsons Companies Inc.
- Ausnutria Dairy Corp. Ltd.
- Danone SA
- Else Nutrition Holdings Inc.
- Fonterra Cooperative Group Ltd.
- Groupe Lactalis
- Gujarat Co. Milk Ltd.
- Hero AG
- HiPP GmbH and Co. Vertrieb KG
- Meiji Holdings Co. Ltd.
- Nestle SA
- Plum Organics PBC
- PZ Cussons Plc
- Reckitt Benckiser Group Plc

