|
|
市場調査レポート
商品コード
1788476
心臓病学におけるAIの世界市場 2025-2029Global AI in Cardiology Market 2025-2029 |
||||||

|
|||||||
カスタマイズ可能
|
|||||||

| 心臓病学におけるAIの世界市場 2025-2029 |
|
出版日: 2025年08月06日
発行: TechNavio
ページ情報: 英文 234 Pages
納期: 即納可能
|

全表示
- 概要
- 図表
- 目次
心臓病学におけるAI市場は2024-2029年に103億8,170万米ドル、予測期間中のCAGRは46.1%で成長すると予測されます。
当レポートでは、心臓病学におけるAI市場の全体的な分析、市場規模・予測、動向、成長促進要因、課題、約25のベンダーを網羅したベンダー分析などを掲載しています。
現在の市場シナリオ、最新動向と促進要因、市場環境全体に関する最新分析を提供しています。市場は、心血管データの急増と複雑化、効率性の向上、コスト管理、転帰の改善に対するヘルスケアシステムへの圧力の高まり、規制状況の好転と臨床検証の蓄積によって牽引されています。
| 市場範囲 | |
|---|---|
| 基準年 | 2025 |
| 終了年 | 2029 |
| 予測期間 | 2025-2029 |
| 成長モメンタム | 加速 |
| 前年比 | 39% |
| CAGR | 46.1% |
| 増分額 | 103億8,170万米ドル |
本調査は、業界の主要参加者からのインプットを含め、一次情報と二次情報を客観的に組み合わせて実施しました。レポートには、主要企業の分析に加え、包括的な市場規模データ、地域別分析によるセグメント、ベンダー情勢が含まれています。レポートには過去データと予測データがあります。
本調査では、今後数年間の心臓病学におけるAI市場の成長を促進する主な理由の一つとして、全人的な患者評価のためのマルチモーダルAIと基盤モデルの出現を挙げています。また、ポイントオブケアやエッジデバイスへのAIの分散化、創薬や個別化治療シミュレーションへのジェネレーティブAIの応用は、市場の大きな需要につながります。
目次
第1章 エグゼクティブサマリー
- 市場概要
第2章 Technavio分析
- 価格・ライフサイクル・顧客購入バスケット・採用率・購入基準の分析
- インプットの重要性と差別化の要因
- 混乱の要因
- 促進要因と課題の影響
第3章 市場情勢
- 市場エコシステム
- 市場の特徴
- バリューチェーン分析
第4章 市場規模
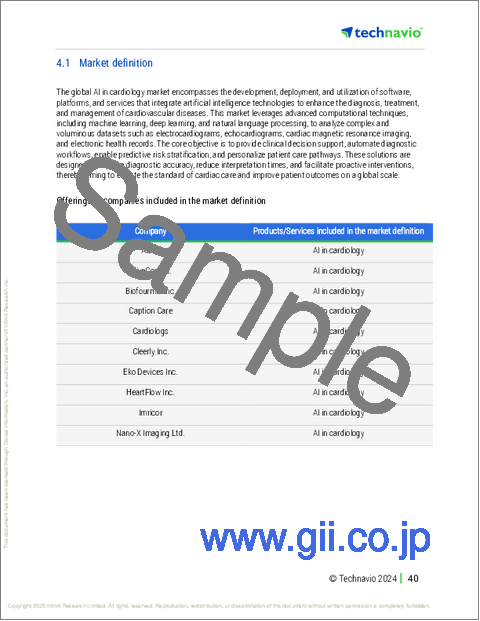
- 市場の定義
- 市場セグメント分析
- 市場規模 2024
- 市場の見通し 2024-2029
第5章 市場規模実績
- 心臓病学におけるAIの世界市場 2019-2023
- 部品セグメント分析 2019-2023
- タイプセグメント分析 2019-2023
- 用途別セグメント分析 2019-2023
- 地域別セグメント分析 2019-2023
- 国別セグメント分析 2019-2023
第6章 ファイブフォース分析
- ファイブフォースの要約
- 買い手の交渉力
- 供給企業の交渉力
- 新規参入業者の脅威
- 代替品の脅威
- 競争の脅威
- 市況
第7章 市場セグメンテーション:コンポーネント別
- 市場セグメント
- 比較:コンポーネント別
- ソフトウェア:市場規模と予測 2024-2029
- サービス:市場規模と予測 2024-2029
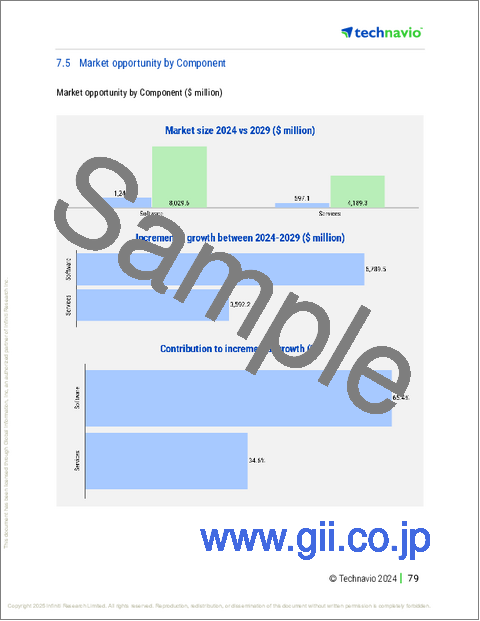
- 市場機会:コンポーネント別
第8章 市場セグメンテーション:タイプ別
- 市場セグメント
- 比較:タイプ別
- 心臓診断:市場規模と予測 2024-2029
- 心臓モニタリング:市場規模と予測 2024-2029
- 市場機会:タイプ別
第9章 市場セグメンテーション:用途別
- 市場セグメント
- 比較:用途別
- 診断:市場規模と予測 2024-2029
- 予測とリスク評価:市場規模と予測 2024-2029
- 治療計画:市場規模と予測 2024-2029
- リモート監視:市場規模と予測 2024-2029
- 創薬:市場規模と予測 2024-2029
- 市場機会:用途別
第10章 顧客情勢
- 顧客情勢の概要
第11章 地域別情勢
- 地域別セグメンテーション
- 地域別比較
- 北米:市場規模と予測 2024-2029
- 欧州:市場規模と予測 2024-2029
- アジア太平洋:市場規模と予測 2024-2029
- 南米:市場規模と予測 2024-2029
- 中東・アフリカ:市場規模と予測 2024-2029
- 米国:市場規模と予測 2024-2029
- ドイツ:市場規模と予測 2024-2029
- 中国:市場規模と予測 2024-2029
- カナダ:市場規模と予測 2024-2029
- 英国:市場規模と予測 2024-2029
- 日本:市場規模と予測 2024-2029
- フランス:市場規模と予測 2024-2029
- インド:市場規模と予測 2024-2029
- イタリア:市場規模と予測 2024-2029
- オランダ:市場規模と予測 2024-2029
- 市場機会:地域情勢別
第12章 促進要因・課題・機会・抑制要因
- 市場促進要因
- 市場の課題
- 促進要因と課題の影響
- 市場の機会・抑制要因
第13章 競合情勢
- 概要
- 競合情勢
- 混乱の状況
- 業界のリスク
第14章 競合分析
- 企業プロファイル
- 企業ランキング指数
- 企業の市場ポジショニング
- Aidoc
- AliveCor Inc.
- Biofourmis Inc.
- Caption Care
- Cardiologs
- Cleerly Inc.
- Eko Devices Inc.
- HeartFlow Inc.
- Imricor
- Nano-X Imaging Ltd.
- Perspectum Ltd
- Siemens Healthineers AG
- Tempus Labs Inc.
- Ultromics Ltd.
- Vista AI Inc.
第15章 付録
Exhibits:
- Exhibits1: Executive Summary - Chart on Market Overview
- Exhibits2: Executive Summary - Data Table on Market Overview
- Exhibits3: Executive Summary - Chart on Global Market Characteristics
- Exhibits4: Executive Summary - Chart on Market By Geographical Landscape
- Exhibits5: Executive Summary - Chart on Market Segmentation by Component
- Exhibits6: Executive Summary - Chart on Market Segmentation by Type
- Exhibits7: Executive Summary - Chart on Market Segmentation by Application
- Exhibits8: Executive Summary - Chart on Incremental Growth
- Exhibits9: Executive Summary - Data Table on Incremental Growth
- Exhibits10: Executive Summary - Chart on Company Market Positioning
- Exhibits11: Analysis of price sensitivity, lifecycle, customer purchase basket, adoption rates, and purchase criteria
- Exhibits12: Overview on criticality of inputs and factors of differentiation
- Exhibits13: Overview on factors of disruption
- Exhibits14: Impact of drivers and challenges in 2024 and 2029
- Exhibits15: Parent Market
- Exhibits16: Data Table on - Parent Market
- Exhibits17: Market characteristics analysis
- Exhibits18: Value chain analysis
- Exhibits19: Offerings of companies included in the market definition
- Exhibits20: Market segments
- Exhibits21: Chart on Global - Market size and forecast 2024-2029 ($ million)
- Exhibits22: Data Table on Global - Market size and forecast 2024-2029 ($ million)
- Exhibits23: Chart on Global Market: Year-over-year growth 2024-2029 (%)
- Exhibits24: Data Table on Global Market: Year-over-year growth 2024-2029 (%)
- Exhibits25: Historic Market Size - Data Table on Global AI In Cardiology Market 2019 - 2023 ($ million)
- Exhibits26: Historic Market Size - Component Segment 2019 - 2023 ($ million)
- Exhibits27: Historic Market Size - Type Segment 2019 - 2023 ($ million)
- Exhibits28: Historic Market Size - Application Segment 2019 - 2023 ($ million)
- Exhibits29: Historic Market Size - Geography Segment 2019 - 2023 ($ million)
- Exhibits30: Historic Market Size - Country Segment 2019 - 2023 ($ million)
- Exhibits31: Five forces analysis - Comparison between 2024 and 2029
- Exhibits32: Bargaining power of buyers - Impact of key factors 2024 and 2029
- Exhibits33: Bargaining power of suppliers - Impact of key factors in 2024 and 2029
- Exhibits34: Threat of new entrants - Impact of key factors in 2024 and 2029
- Exhibits35: Threat of substitutes - Impact of key factors in 2024 and 2029
- Exhibits36: Threat of rivalry - Impact of key factors in 2024 and 2029
- Exhibits37: Chart on Market condition - Five forces 2024 and 2029
- Exhibits38: Chart on Component - Market share 2024-2029 (%)
- Exhibits39: Data Table on Component - Market share 2024-2029 (%)
- Exhibits40: Chart on Comparison by Component
- Exhibits41: Data Table on Comparison by Component
- Exhibits42: Chart on Software - Market size and forecast 2024-2029 ($ million)
- Exhibits43: Data Table on Software - Market size and forecast 2024-2029 ($ million)
- Exhibits44: Chart on Software - Year-over-year growth 2024-2029 (%)
- Exhibits45: Data Table on Software - Year-over-year growth 2024-2029 (%)
- Exhibits46: Chart on Services - Market size and forecast 2024-2029 ($ million)
- Exhibits47: Data Table on Services - Market size and forecast 2024-2029 ($ million)
- Exhibits48: Chart on Services - Year-over-year growth 2024-2029 (%)
- Exhibits49: Data Table on Services - Year-over-year growth 2024-2029 (%)
- Exhibits50: Market opportunity by Component ($ million)
- Exhibits51: Data Table on Market opportunity by Component ($ million)
- Exhibits52: Chart on Type - Market share 2024-2029 (%)
- Exhibits53: Data Table on Type - Market share 2024-2029 (%)
- Exhibits54: Chart on Comparison by Type
- Exhibits55: Data Table on Comparison by Type
- Exhibits56: Chart on Cardiac diagnostics - Market size and forecast 2024-2029 ($ million)
- Exhibits57: Data Table on Cardiac diagnostics - Market size and forecast 2024-2029 ($ million)
- Exhibits58: Chart on Cardiac diagnostics - Year-over-year growth 2024-2029 (%)
- Exhibits59: Data Table on Cardiac diagnostics - Year-over-year growth 2024-2029 (%)
- Exhibits60: Chart on Cardiac monitoring - Market size and forecast 2024-2029 ($ million)
- Exhibits61: Data Table on Cardiac monitoring - Market size and forecast 2024-2029 ($ million)
- Exhibits62: Chart on Cardiac monitoring - Year-over-year growth 2024-2029 (%)
- Exhibits63: Data Table on Cardiac monitoring - Year-over-year growth 2024-2029 (%)
- Exhibits64: Market opportunity by Type ($ million)
- Exhibits65: Data Table on Market opportunity by Type ($ million)
- Exhibits66: Chart on Application - Market share 2024-2029 (%)
- Exhibits67: Data Table on Application - Market share 2024-2029 (%)
- Exhibits68: Chart on Comparison by Application
- Exhibits69: Data Table on Comparison by Application
- Exhibits70: Chart on Diagnosis - Market size and forecast 2024-2029 ($ million)
- Exhibits71: Data Table on Diagnosis - Market size and forecast 2024-2029 ($ million)
- Exhibits72: Chart on Diagnosis - Year-over-year growth 2024-2029 (%)
- Exhibits73: Data Table on Diagnosis - Year-over-year growth 2024-2029 (%)
- Exhibits74: Chart on Prediction and risk assessment - Market size and forecast 2024-2029 ($ million)
- Exhibits75: Data Table on Prediction and risk assessment - Market size and forecast 2024-2029 ($ million)
- Exhibits76: Chart on Prediction and risk assessment - Year-over-year growth 2024-2029 (%)
- Exhibits77: Data Table on Prediction and risk assessment - Year-over-year growth 2024-2029 (%)
- Exhibits78: Chart on Treatment planning - Market size and forecast 2024-2029 ($ million)
- Exhibits79: Data Table on Treatment planning - Market size and forecast 2024-2029 ($ million)
- Exhibits80: Chart on Treatment planning - Year-over-year growth 2024-2029 (%)
- Exhibits81: Data Table on Treatment planning - Year-over-year growth 2024-2029 (%)
- Exhibits82: Chart on Remote monitoring - Market size and forecast 2024-2029 ($ million)
- Exhibits83: Data Table on Remote monitoring - Market size and forecast 2024-2029 ($ million)
- Exhibits84: Chart on Remote monitoring - Year-over-year growth 2024-2029 (%)
- Exhibits85: Data Table on Remote monitoring - Year-over-year growth 2024-2029 (%)
- Exhibits86: Chart on Drug discovery - Market size and forecast 2024-2029 ($ million)
- Exhibits87: Data Table on Drug discovery - Market size and forecast 2024-2029 ($ million)
- Exhibits88: Chart on Drug discovery - Year-over-year growth 2024-2029 (%)
- Exhibits89: Data Table on Drug discovery - Year-over-year growth 2024-2029 (%)
- Exhibits90: Market opportunity by Application ($ million)
- Exhibits91: Data Table on Market opportunity by Application ($ million)
- Exhibits92: Analysis of price sensitivity, lifecycle, customer purchase basket, adoption rates, and purchase criteria
- Exhibits93: Chart on Market share By Geographical Landscape 2024-2029 (%)
- Exhibits94: Data Table on Market share By Geographical Landscape 2024-2029 (%)
- Exhibits95: Chart on Geographic comparison
- Exhibits96: Data Table on Geographic comparison
- Exhibits97: Chart on North America - Market size and forecast 2024-2029 ($ million)
- Exhibits98: Data Table on North America - Market size and forecast 2024-2029 ($ million)
- Exhibits99: Chart on North America - Year-over-year growth 2024-2029 (%)
- Exhibits100: Data Table on North America - Year-over-year growth 2024-2029 (%)
- Exhibits101: Chart on Europe - Market size and forecast 2024-2029 ($ million)
- Exhibits102: Data Table on Europe - Market size and forecast 2024-2029 ($ million)
- Exhibits103: Chart on Europe - Year-over-year growth 2024-2029 (%)
- Exhibits104: Data Table on Europe - Year-over-year growth 2024-2029 (%)
- Exhibits105: Chart on APAC - Market size and forecast 2024-2029 ($ million)
- Exhibits106: Data Table on APAC - Market size and forecast 2024-2029 ($ million)
- Exhibits107: Chart on APAC - Year-over-year growth 2024-2029 (%)
- Exhibits108: Data Table on APAC - Year-over-year growth 2024-2029 (%)
- Exhibits109: Chart on South America - Market size and forecast 2024-2029 ($ million)
- Exhibits110: Data Table on South America - Market size and forecast 2024-2029 ($ million)
- Exhibits111: Chart on South America - Year-over-year growth 2024-2029 (%)
- Exhibits112: Data Table on South America - Year-over-year growth 2024-2029 (%)
- Exhibits113: Chart on Middle East and Africa - Market size and forecast 2024-2029 ($ million)
- Exhibits114: Data Table on Middle East and Africa - Market size and forecast 2024-2029 ($ million)
- Exhibits115: Chart on Middle East and Africa - Year-over-year growth 2024-2029 (%)
- Exhibits116: Data Table on Middle East and Africa - Year-over-year growth 2024-2029 (%)
- Exhibits117: Chart on US - Market size and forecast 2024-2029 ($ million)
- Exhibits118: Data Table on US - Market size and forecast 2024-2029 ($ million)
- Exhibits119: Chart on US - Year-over-year growth 2024-2029 (%)
- Exhibits120: Data Table on US - Year-over-year growth 2024-2029 (%)
- Exhibits121: Chart on Germany - Market size and forecast 2024-2029 ($ million)
- Exhibits122: Data Table on Germany - Market size and forecast 2024-2029 ($ million)
- Exhibits123: Chart on Germany - Year-over-year growth 2024-2029 (%)
- Exhibits124: Data Table on Germany - Year-over-year growth 2024-2029 (%)
- Exhibits125: Chart on China - Market size and forecast 2024-2029 ($ million)
- Exhibits126: Data Table on China - Market size and forecast 2024-2029 ($ million)
- Exhibits127: Chart on China - Year-over-year growth 2024-2029 (%)
- Exhibits128: Data Table on China - Year-over-year growth 2024-2029 (%)
- Exhibits129: Chart on Canada - Market size and forecast 2024-2029 ($ million)
- Exhibits130: Data Table on Canada - Market size and forecast 2024-2029 ($ million)
- Exhibits131: Chart on Canada - Year-over-year growth 2024-2029 (%)
- Exhibits132: Data Table on Canada - Year-over-year growth 2024-2029 (%)
- Exhibits133: Chart on UK - Market size and forecast 2024-2029 ($ million)
- Exhibits134: Data Table on UK - Market size and forecast 2024-2029 ($ million)
- Exhibits135: Chart on UK - Year-over-year growth 2024-2029 (%)
- Exhibits136: Data Table on UK - Year-over-year growth 2024-2029 (%)
- Exhibits137: Chart on Japan - Market size and forecast 2024-2029 ($ million)
- Exhibits138: Data Table on Japan - Market size and forecast 2024-2029 ($ million)
- Exhibits139: Chart on Japan - Year-over-year growth 2024-2029 (%)
- Exhibits140: Data Table on Japan - Year-over-year growth 2024-2029 (%)
- Exhibits141: Chart on France - Market size and forecast 2024-2029 ($ million)
- Exhibits142: Data Table on France - Market size and forecast 2024-2029 ($ million)
- Exhibits143: Chart on France - Year-over-year growth 2024-2029 (%)
- Exhibits144: Data Table on France - Year-over-year growth 2024-2029 (%)
- Exhibits145: Chart on India - Market size and forecast 2024-2029 ($ million)
- Exhibits146: Data Table on India - Market size and forecast 2024-2029 ($ million)
- Exhibits147: Chart on India - Year-over-year growth 2024-2029 (%)
- Exhibits148: Data Table on India - Year-over-year growth 2024-2029 (%)
- Exhibits149: Chart on Italy - Market size and forecast 2024-2029 ($ million)
- Exhibits150: Data Table on Italy - Market size and forecast 2024-2029 ($ million)
- Exhibits151: Chart on Italy - Year-over-year growth 2024-2029 (%)
- Exhibits152: Data Table on Italy - Year-over-year growth 2024-2029 (%)
- Exhibits153: Chart on The Netherlands - Market size and forecast 2024-2029 ($ million)
- Exhibits154: Data Table on The Netherlands - Market size and forecast 2024-2029 ($ million)
- Exhibits155: Chart on The Netherlands - Year-over-year growth 2024-2029 (%)
- Exhibits156: Data Table on The Netherlands - Year-over-year growth 2024-2029 (%)
- Exhibits157: Market opportunity By Geographical Landscape ($ million)
- Exhibits158: Data Tables on Market opportunity By Geographical Landscape ($ million)
- Exhibits159: Impact of drivers and challenges in 2024 and 2029
- Exhibits160: Overview on criticality of inputs and factors of differentiation
- Exhibits161: Overview on factors of disruption
- Exhibits162: Impact of key risks on business
- Exhibits163: Companies covered
- Exhibits164: Company ranking index
- Exhibits165: Matrix on companies position and classification
- Exhibits166: Aidoc - Overview
- Exhibits167: Aidoc - Product / Service
- Exhibits168: Aidoc - Key offerings
- Exhibits169: SWOT
- Exhibits170: AliveCor Inc. - Overview
- Exhibits171: AliveCor Inc. - Product / Service
- Exhibits172: AliveCor Inc. - Key offerings
- Exhibits173: SWOT
- Exhibits174: Biofourmis Inc. - Overview
- Exhibits175: Biofourmis Inc. - Product / Service
- Exhibits176: Biofourmis Inc. - Key offerings
- Exhibits177: SWOT
- Exhibits178: Caption Care - Overview
- Exhibits179: Caption Care - Product / Service
- Exhibits180: Caption Care - Key offerings
- Exhibits181: SWOT
- Exhibits182: Cardiologs - Overview
- Exhibits183: Cardiologs - Product / Service
- Exhibits184: Cardiologs - Key offerings
- Exhibits185: SWOT
- Exhibits186: Cleerly Inc. - Overview
- Exhibits187: Cleerly Inc. - Product / Service
- Exhibits188: Cleerly Inc. - Key offerings
- Exhibits189: SWOT
- Exhibits190: Eko Devices Inc. - Overview
- Exhibits191: Eko Devices Inc. - Product / Service
- Exhibits192: Eko Devices Inc. - Key offerings
- Exhibits193: SWOT
- Exhibits194: HeartFlow Inc. - Overview
- Exhibits195: HeartFlow Inc. - Product / Service
- Exhibits196: HeartFlow Inc. - Key news
- Exhibits197: HeartFlow Inc. - Key offerings
- Exhibits198: SWOT
- Exhibits199: Imricor - Overview
- Exhibits200: Imricor - Product / Service
- Exhibits201: Imricor - Key offerings
- Exhibits202: SWOT
- Exhibits203: Nano-X Imaging Ltd. - Overview
- Exhibits204: Nano-X Imaging Ltd. - Product / Service
- Exhibits205: Nano-X Imaging Ltd. - Key offerings
- Exhibits206: SWOT
- Exhibits207: Perspectum Ltd - Overview
- Exhibits208: Perspectum Ltd - Product / Service
- Exhibits209: Perspectum Ltd - Key offerings
- Exhibits210: SWOT
- Exhibits211: Siemens Healthineers AG - Overview
- Exhibits212: Siemens Healthineers AG - Business segments
- Exhibits213: Siemens Healthineers AG - Key news
- Exhibits214: Siemens Healthineers AG - Key offerings
- Exhibits215: Siemens Healthineers AG - Segment focus
- Exhibits216: SWOT
- Exhibits217: Tempus Labs Inc. - Overview
- Exhibits218: Tempus Labs Inc. - Product / Service
- Exhibits219: Tempus Labs Inc. - Key offerings
- Exhibits220: SWOT
- Exhibits221: Ultromics Ltd. - Overview
- Exhibits222: Ultromics Ltd. - Product / Service
- Exhibits223: Ultromics Ltd. - Key offerings
- Exhibits224: SWOT
- Exhibits225: Vista AI Inc. - Overview
- Exhibits226: Vista AI Inc. - Product / Service
- Exhibits227: Vista AI Inc. - Key offerings
- Exhibits228: SWOT
- Exhibits229: Inclusions checklist
- Exhibits230: Exclusions checklist
- Exhibits231: Currency conversion rates for US$
- Exhibits232: Research methodology
- Exhibits233: Information sources
- Exhibits234: Data validation
- Exhibits235: Validation techniques employed for market sizing
- Exhibits236: Data synthesis
- Exhibits237: 360 degree market analysis
- Exhibits238: List of abbreviations
The AI in cardiology market is forecasted to grow by USD 10,381.7 mn during 2024-2029, accelerating at a CAGR of 46.1% during the forecast period. The report on the AI in cardiology market provides a holistic analysis, market size and forecast, trends, growth drivers, and challenges, as well as vendor analysis covering around 25 vendors.
The report offers an up-to-date analysis regarding the current market scenario, the latest trends and drivers, and the overall market environment. The market is driven by proliferation and increasing complexity of cardiovascular data, mounting pressure on healthcare systems to enhance efficiency, control costs, and improve outcomes, and increasingly favorable regulatory landscape and growing body of clinical validation.
| Market Scope | |
|---|---|
| Base Year | 2025 |
| End Year | 2029 |
| Series Year | 2025-2029 |
| Growth Momentum | Accelerate |
| YOY 2025 | 39% |
| CAGR | 46.1% |
| Incremental Value | $10,381.7 mn |
The study was conducted using an objective combination of primary and secondary information including inputs from key participants in the industry. The report contains a comprehensive market size data, segment with regional analysis and vendor landscape in addition to an analysis of the key companies. Reports have historic and forecast data.
Technavio's AI in cardiology market is segmented as below:
By Component
- Software
- Services
By Type
- Cardiac diagnostics
- Cardiac monitoring
By Application
- Diagnosis
- Prediction and risk assessment
- Treatment planning
- Remote monitoring
- Drug discovery
By Geographical Landscape
- North America
- Europe
- APAC
- South America
- Middle East and Africa
This study identifies the emergence of multimodal AI and foundation models for holistic patient assessment as one of the prime reasons driving the AI in cardiology market growth during the next few years. Also, decentralization of AI to point of care and edge devices and application of generative AI in drug discovery and personalized treatment simulation will lead to sizable demand in the market.
The report on the AI in cardiology market covers the following areas:
- AI In Cardiology Market sizing
- AI In Cardiology Market forecast
- AI In Cardiology Market industry analysis
The robust vendor analysis is designed to help clients improve their market position, and in line with this, this report provides a detailed analysis of several leading AI in cardiology market vendors that include Aidoc, AliveCor Inc., Biofourmis Inc., Caption Care, Cardiologs, Cleerly Inc., Eko Devices Inc., HeartFlow Inc., Imricor, Merative L.P., Nano-X Imaging Ltd., Perspectum Ltd, RSIP VISION LTD, Siemens Healthineers AG, Tempus Labs Inc., UltraSight Ltd, Ultromics Ltd., Vista AI Inc., and ZEBRA MEDICAL. Also, the AI in cardiology market analysis report includes information on upcoming trends and challenges that will influence market growth. This is to help companies strategize and leverage all forthcoming growth opportunities.
The publisher presents a detailed picture of the market by the way of study, synthesis, and summation of data from multiple sources by an analysis of key parameters such as profit, pricing, competition, and promotions. It presents various market facets by identifying the key industry influencers. The data presented is comprehensive, reliable, and a result of extensive primary and secondary research. The market research reports provide a complete competitive landscape and an in-depth vendor selection methodology and analysis using qualitative and quantitative research to forecast accurate market growth.
Table of Contents
1 Executive Summary
- 1.1 Market overview
- Executive Summary - Chart on Market Overview
- Executive Summary - Data Table on Market Overview
- Executive Summary - Chart on Global Market Characteristics
- Executive Summary - Chart on Market By Geographical Landscape
- Executive Summary - Chart on Market Segmentation by Component
- Executive Summary - Chart on Market Segmentation by Type
- Executive Summary - Chart on Market Segmentation by Application
- Executive Summary - Chart on Incremental Growth
- Executive Summary - Data Table on Incremental Growth
- Executive Summary - Chart on Company Market Positioning
2 Technavio Analysis
- 2.1 Analysis of price sensitivity, lifecycle, customer purchase basket, adoption rates, and purchase criteria
- Analysis of price sensitivity, lifecycle, customer purchase basket, adoption rates, and purchase criteria
- 2.2 Criticality of inputs and Factors of differentiation
- Overview on criticality of inputs and factors of differentiation
- 2.3 Factors of disruption
- Overview on factors of disruption
- 2.4 Impact of drivers and challenges
- Impact of drivers and challenges in 2024 and 2029
3 Market Landscape
- 3.1 Market ecosystem
- Parent Market
- Data Table on - Parent Market
- 3.2 Market characteristics
- Market characteristics analysis
- 3.3 Value chain analysis
- Value chain analysis
4 Market Sizing
- 4.1 Market definition
- Offerings of companies included in the market definition
- 4.2 Market segment analysis
- Market segments
- 4.3 Market size 2024
- 4.4 Market outlook: Forecast for 2024-2029
- Chart on Global - Market size and forecast 2024-2029 ($ million)
- Data Table on Global - Market size and forecast 2024-2029 ($ million)
- Chart on Global Market: Year-over-year growth 2024-2029 (%)
- Data Table on Global Market: Year-over-year growth 2024-2029 (%)
5 Historic Market Size
- 5.1 Global AI In Cardiology Market 2019 - 2023
- Historic Market Size - Data Table on Global AI In Cardiology Market 2019 - 2023 ($ million)
- 5.2 Component segment analysis 2019 - 2023
- Historic Market Size - Component Segment 2019 - 2023 ($ million)
- 5.3 Type segment analysis 2019 - 2023
- Historic Market Size - Type Segment 2019 - 2023 ($ million)
- 5.4 Application segment analysis 2019 - 2023
- Historic Market Size - Application Segment 2019 - 2023 ($ million)
- 5.5 Geography segment analysis 2019 - 2023
- Historic Market Size - Geography Segment 2019 - 2023 ($ million)
- 5.6 Country segment analysis 2019 - 2023
- Historic Market Size - Country Segment 2019 - 2023 ($ million)
6 Five Forces Analysis
- 6.1 Five forces summary
- Five forces analysis - Comparison between 2024 and 2029
- 6.2 Bargaining power of buyers
- Bargaining power of buyers - Impact of key factors 2024 and 2029
- 6.3 Bargaining power of suppliers
- Bargaining power of suppliers - Impact of key factors in 2024 and 2029
- 6.4 Threat of new entrants
- Threat of new entrants - Impact of key factors in 2024 and 2029
- 6.5 Threat of substitutes
- Threat of substitutes - Impact of key factors in 2024 and 2029
- 6.6 Threat of rivalry
- Threat of rivalry - Impact of key factors in 2024 and 2029
- 6.7 Market condition
- Chart on Market condition - Five forces 2024 and 2029
7 Market Segmentation by Component
- 7.1 Market segments
- Chart on Component - Market share 2024-2029 (%)
- Data Table on Component - Market share 2024-2029 (%)
- 7.2 Comparison by Component
- Chart on Comparison by Component
- Data Table on Comparison by Component
- 7.3 Software - Market size and forecast 2024-2029
- Chart on Software - Market size and forecast 2024-2029 ($ million)
- Data Table on Software - Market size and forecast 2024-2029 ($ million)
- Chart on Software - Year-over-year growth 2024-2029 (%)
- Data Table on Software - Year-over-year growth 2024-2029 (%)
- 7.4 Services - Market size and forecast 2024-2029
- Chart on Services - Market size and forecast 2024-2029 ($ million)
- Data Table on Services - Market size and forecast 2024-2029 ($ million)
- Chart on Services - Year-over-year growth 2024-2029 (%)
- Data Table on Services - Year-over-year growth 2024-2029 (%)
- 7.5 Market opportunity by Component
- Market opportunity by Component ($ million)
- Data Table on Market opportunity by Component ($ million)
8 Market Segmentation by Type
- 8.1 Market segments
- Chart on Type - Market share 2024-2029 (%)
- Data Table on Type - Market share 2024-2029 (%)
- 8.2 Comparison by Type
- Chart on Comparison by Type
- Data Table on Comparison by Type
- 8.3 Cardiac diagnostics - Market size and forecast 2024-2029
- Chart on Cardiac diagnostics - Market size and forecast 2024-2029 ($ million)
- Data Table on Cardiac diagnostics - Market size and forecast 2024-2029 ($ million)
- Chart on Cardiac diagnostics - Year-over-year growth 2024-2029 (%)
- Data Table on Cardiac diagnostics - Year-over-year growth 2024-2029 (%)
- 8.4 Cardiac monitoring - Market size and forecast 2024-2029
- Chart on Cardiac monitoring - Market size and forecast 2024-2029 ($ million)
- Data Table on Cardiac monitoring - Market size and forecast 2024-2029 ($ million)
- Chart on Cardiac monitoring - Year-over-year growth 2024-2029 (%)
- Data Table on Cardiac monitoring - Year-over-year growth 2024-2029 (%)
- 8.5 Market opportunity by Type
- Market opportunity by Type ($ million)
- Data Table on Market opportunity by Type ($ million)
9 Market Segmentation by Application
- 9.1 Market segments
- Chart on Application - Market share 2024-2029 (%)
- Data Table on Application - Market share 2024-2029 (%)
- 9.2 Comparison by Application
- Chart on Comparison by Application
- Data Table on Comparison by Application
- 9.3 Diagnosis - Market size and forecast 2024-2029
- Chart on Diagnosis - Market size and forecast 2024-2029 ($ million)
- Data Table on Diagnosis - Market size and forecast 2024-2029 ($ million)
- Chart on Diagnosis - Year-over-year growth 2024-2029 (%)
- Data Table on Diagnosis - Year-over-year growth 2024-2029 (%)
- 9.4 Prediction and risk assessment - Market size and forecast 2024-2029
- Chart on Prediction and risk assessment - Market size and forecast 2024-2029 ($ million)
- Data Table on Prediction and risk assessment - Market size and forecast 2024-2029 ($ million)
- Chart on Prediction and risk assessment - Year-over-year growth 2024-2029 (%)
- Data Table on Prediction and risk assessment - Year-over-year growth 2024-2029 (%)
- 9.5 Treatment planning - Market size and forecast 2024-2029
- Chart on Treatment planning - Market size and forecast 2024-2029 ($ million)
- Data Table on Treatment planning - Market size and forecast 2024-2029 ($ million)
- Chart on Treatment planning - Year-over-year growth 2024-2029 (%)
- Data Table on Treatment planning - Year-over-year growth 2024-2029 (%)
- 9.6 Remote monitoring - Market size and forecast 2024-2029
- Chart on Remote monitoring - Market size and forecast 2024-2029 ($ million)
- Data Table on Remote monitoring - Market size and forecast 2024-2029 ($ million)
- Chart on Remote monitoring - Year-over-year growth 2024-2029 (%)
- Data Table on Remote monitoring - Year-over-year growth 2024-2029 (%)
- 9.7 Drug discovery - Market size and forecast 2024-2029
- Chart on Drug discovery - Market size and forecast 2024-2029 ($ million)
- Data Table on Drug discovery - Market size and forecast 2024-2029 ($ million)
- Chart on Drug discovery - Year-over-year growth 2024-2029 (%)
- Data Table on Drug discovery - Year-over-year growth 2024-2029 (%)
- 9.8 Market opportunity by Application
- Market opportunity by Application ($ million)
- Data Table on Market opportunity by Application ($ million)
10 Customer Landscape
- 10.1 Customer landscape overview
- Analysis of price sensitivity, lifecycle, customer purchase basket, adoption rates, and purchase criteria
11 Geographic Landscape
- 11.1 Geographic segmentation
- Chart on Market share By Geographical Landscape 2024-2029 (%)
- Data Table on Market share By Geographical Landscape 2024-2029 (%)
- 11.2 Geographic comparison
- Chart on Geographic comparison
- Data Table on Geographic comparison
- 11.3 North America - Market size and forecast 2024-2029
- Chart on North America - Market size and forecast 2024-2029 ($ million)
- Data Table on North America - Market size and forecast 2024-2029 ($ million)
- Chart on North America - Year-over-year growth 2024-2029 (%)
- Data Table on North America - Year-over-year growth 2024-2029 (%)
- 11.4 Europe - Market size and forecast 2024-2029
- Chart on Europe - Market size and forecast 2024-2029 ($ million)
- Data Table on Europe - Market size and forecast 2024-2029 ($ million)
- Chart on Europe - Year-over-year growth 2024-2029 (%)
- Data Table on Europe - Year-over-year growth 2024-2029 (%)
- 11.5 APAC - Market size and forecast 2024-2029
- Chart on APAC - Market size and forecast 2024-2029 ($ million)
- Data Table on APAC - Market size and forecast 2024-2029 ($ million)
- Chart on APAC - Year-over-year growth 2024-2029 (%)
- Data Table on APAC - Year-over-year growth 2024-2029 (%)
- 11.6 South America - Market size and forecast 2024-2029
- Chart on South America - Market size and forecast 2024-2029 ($ million)
- Data Table on South America - Market size and forecast 2024-2029 ($ million)
- Chart on South America - Year-over-year growth 2024-2029 (%)
- Data Table on South America - Year-over-year growth 2024-2029 (%)
- 11.7 Middle East and Africa - Market size and forecast 2024-2029
- Chart on Middle East and Africa - Market size and forecast 2024-2029 ($ million)
- Data Table on Middle East and Africa - Market size and forecast 2024-2029 ($ million)
- Chart on Middle East and Africa - Year-over-year growth 2024-2029 (%)
- Data Table on Middle East and Africa - Year-over-year growth 2024-2029 (%)
- 11.8 US - Market size and forecast 2024-2029
- Chart on US - Market size and forecast 2024-2029 ($ million)
- Data Table on US - Market size and forecast 2024-2029 ($ million)
- Chart on US - Year-over-year growth 2024-2029 (%)
- Data Table on US - Year-over-year growth 2024-2029 (%)
- 11.9 Germany - Market size and forecast 2024-2029
- Chart on Germany - Market size and forecast 2024-2029 ($ million)
- Data Table on Germany - Market size and forecast 2024-2029 ($ million)
- Chart on Germany - Year-over-year growth 2024-2029 (%)
- Data Table on Germany - Year-over-year growth 2024-2029 (%)
- 11.10 China - Market size and forecast 2024-2029
- Chart on China - Market size and forecast 2024-2029 ($ million)
- Data Table on China - Market size and forecast 2024-2029 ($ million)
- Chart on China - Year-over-year growth 2024-2029 (%)
- Data Table on China - Year-over-year growth 2024-2029 (%)
- 11.11 Canada - Market size and forecast 2024-2029
- Chart on Canada - Market size and forecast 2024-2029 ($ million)
- Data Table on Canada - Market size and forecast 2024-2029 ($ million)
- Chart on Canada - Year-over-year growth 2024-2029 (%)
- Data Table on Canada - Year-over-year growth 2024-2029 (%)
- 11.12 UK - Market size and forecast 2024-2029
- Chart on UK - Market size and forecast 2024-2029 ($ million)
- Data Table on UK - Market size and forecast 2024-2029 ($ million)
- Chart on UK - Year-over-year growth 2024-2029 (%)
- Data Table on UK - Year-over-year growth 2024-2029 (%)
- 11.13 Japan - Market size and forecast 2024-2029
- Chart on Japan - Market size and forecast 2024-2029 ($ million)
- Data Table on Japan - Market size and forecast 2024-2029 ($ million)
- Chart on Japan - Year-over-year growth 2024-2029 (%)
- Data Table on Japan - Year-over-year growth 2024-2029 (%)
- 11.14 France - Market size and forecast 2024-2029
- Chart on France - Market size and forecast 2024-2029 ($ million)
- Data Table on France - Market size and forecast 2024-2029 ($ million)
- Chart on France - Year-over-year growth 2024-2029 (%)
- Data Table on France - Year-over-year growth 2024-2029 (%)
- 11.15 India - Market size and forecast 2024-2029
- Chart on India - Market size and forecast 2024-2029 ($ million)
- Data Table on India - Market size and forecast 2024-2029 ($ million)
- Chart on India - Year-over-year growth 2024-2029 (%)
- Data Table on India - Year-over-year growth 2024-2029 (%)
- 11.16 Italy - Market size and forecast 2024-2029
- Chart on Italy - Market size and forecast 2024-2029 ($ million)
- Data Table on Italy - Market size and forecast 2024-2029 ($ million)
- Chart on Italy - Year-over-year growth 2024-2029 (%)
- Data Table on Italy - Year-over-year growth 2024-2029 (%)
- 11.17 The Netherlands - Market size and forecast 2024-2029
- Chart on The Netherlands - Market size and forecast 2024-2029 ($ million)
- Data Table on The Netherlands - Market size and forecast 2024-2029 ($ million)
- Chart on The Netherlands - Year-over-year growth 2024-2029 (%)
- Data Table on The Netherlands - Year-over-year growth 2024-2029 (%)
- 11.18 Market opportunity By Geographical Landscape
- Market opportunity By Geographical Landscape ($ million)
- Data Tables on Market opportunity By Geographical Landscape ($ million)
12 Drivers, Challenges, and Opportunity/Restraints
- 12.1 Market drivers
- 12.2 Market challenges
- 12.3 Impact of drivers and challenges
- Impact of drivers and challenges in 2024 and 2029
- 12.4 Market opportunities/restraints
13 Competitive Landscape
- 13.1 Overview
- 13.2 Competitive Landscape
- Overview on criticality of inputs and factors of differentiation
- 13.3 Landscape disruption
- Overview on factors of disruption
- 13.4 Industry risks
- Impact of key risks on business
14 Competitive Analysis
- 14.1 Companies profiled
- Companies covered
- 14.2 Company ranking index
- Company ranking index
- 14.3 Market positioning of companies
- Matrix on companies position and classification
- 14.4 Aidoc
- Aidoc - Overview
- Aidoc - Product / Service
- Aidoc - Key offerings
- SWOT
- 14.5 AliveCor Inc.
- AliveCor Inc. - Overview
- AliveCor Inc. - Product / Service
- AliveCor Inc. - Key offerings
- SWOT
- 14.6 Biofourmis Inc.
- Biofourmis Inc. - Overview
- Biofourmis Inc. - Product / Service
- Biofourmis Inc. - Key offerings
- SWOT
- 14.7 Caption Care
- Caption Care - Overview
- Caption Care - Product / Service
- Caption Care - Key offerings
- SWOT
- 14.8 Cardiologs
- Cardiologs - Overview
- Cardiologs - Product / Service
- Cardiologs - Key offerings
- SWOT
- 14.9 Cleerly Inc.
- Cleerly Inc. - Overview
- Cleerly Inc. - Product / Service
- Cleerly Inc. - Key offerings
- SWOT
- 14.10 Eko Devices Inc.
- Eko Devices Inc. - Overview
- Eko Devices Inc. - Product / Service
- Eko Devices Inc. - Key offerings
- SWOT
- 14.11 HeartFlow Inc.
- HeartFlow Inc. - Overview
- HeartFlow Inc. - Product / Service
- HeartFlow Inc. - Key news
- HeartFlow Inc. - Key offerings
- SWOT
- 14.12 Imricor
- Imricor - Overview
- Imricor - Product / Service
- Imricor - Key offerings
- SWOT
- 14.13 Nano-X Imaging Ltd.
- Nano-X Imaging Ltd. - Overview
- Nano-X Imaging Ltd. - Product / Service
- Nano-X Imaging Ltd. - Key offerings
- SWOT
- 14.14 Perspectum Ltd
- Perspectum Ltd - Overview
- Perspectum Ltd - Product / Service
- Perspectum Ltd - Key offerings
- SWOT
- 14.15 Siemens Healthineers AG
- Siemens Healthineers AG - Overview
- Siemens Healthineers AG - Business segments
- Siemens Healthineers AG - Key news
- Siemens Healthineers AG - Key offerings
- Siemens Healthineers AG - Segment focus
- SWOT
- 14.16 Tempus Labs Inc.
- Tempus Labs Inc. - Overview
- Tempus Labs Inc. - Product / Service
- Tempus Labs Inc. - Key offerings
- SWOT
- 14.17 Ultromics Ltd.
- Ultromics Ltd. - Overview
- Ultromics Ltd. - Product / Service
- Ultromics Ltd. - Key offerings
- SWOT
- 14.18 Vista AI Inc.
- Vista AI Inc. - Overview
- Vista AI Inc. - Product / Service
- Vista AI Inc. - Key offerings
- SWOT
15 Appendix
- 15.1 Scope of the report
- 15.2 Inclusions and exclusions checklist
- Inclusions checklist
- Exclusions checklist
- 15.3 Currency conversion rates for US$
- Currency conversion rates for US$
- 15.4 Research methodology
- Research methodology
- 15.5 Data procurement
- Information sources
- 15.6 Data validation
- Data validation
- 15.7 Validation techniques employed for market sizing
- Validation techniques employed for market sizing
- 15.8 Data synthesis
- Data synthesis
- 15.9 360 degree market analysis
- 360 degree market analysis
- 15.10 List of abbreviations
- List of abbreviations

